Sharif University of Technology
Scientia IranicaTransactions E: Industrial Engineering http://scientiairanica.sharif.edu
A multi-objective SCOR-based decision alignment for
supply chain performance management
M. Rezaei, M. Akbarpour Shirazi
, and B. Karimi
Department of Industrial Engineering, Amirkabir University of Technology, 424 Hafez Ave., Tehran, 15875-4413, Iran. Received 10 August 2016; received in revised form 8 April 2017; accepted 17 July 2017
KEYWORDS Multi-objective; NSGAII; SCOR model; Decision alignment; Supply chain; Performance management.
Abstract. A dynamic integrated solution to three main problems through integrating all metrics using SCOR is proposed in this research. This dynamic solution comprises strategic decisions in high level, operational decisions in low level, and alignment of these two decision levels. In this regard, a human intelligence-based process for high-level decisions and machine-intelligence based Decision Support Systems (DSSs) for low-level decisions are proposed using a novel approach. The presented operational model considers important supply chain features thoroughly, such as dierent echelons, several suppliers, several manufacturers, and several products, during multiple periods. A multi-objective mathematical programming model is then developed to yield the operational decisions with Pareto ecient performance values and solved using a well-known meta-heuristic algorithm, i.e., NSGAII, the parameters of which are tuned using Taguchi method. Afterwards, an intermediate machine-intelligence module is used to determine the best operational solution based on the strategic idea of the decision maker. The eciency of the proposed framework is shown through numerical example and then, a sensitivity analysis is conducted for the obtained results so as to show the impact of the strategic scenario planning on the performance of the considered supply chain.
© 2018 Sharif University of Technology. All rights reserved.
1. Introduction
To make agile, responsive, sustainable, robust, eec-tive, and competitive Supply Chain (SC), we need to employ all models and technologies that ensure protability and stability. In this regard, Supply Chain Management (SCM) decisions are categorized into two levels in this research, i.e., human-intelligence and machine-intelligence based decisions, based upon their nature. We develop a process-based method for
high-*. Corresponding author. Tel.:+98 21 64545370; Fax: +98 21 66954569
E-mail address: [email protected] (M. Akbarpour Shirazi)
doi: 10.24200/sci.2017.4463
level decisions, a multi-objective method for low-level decisions, and an intermediate multi-objective method for aligning high- and low-level decisions using a novel approach.
Due to SCM resource constraints, only a limited number of objectives are able to take high priorities [1]. We employ a prioritization method to deal with the multi-objective problem in the strategic level. This paper aims at two main objectives: (1) improving the Supply Chain Performance Management (SCPM) by aligning dierent decision levels in the integrated process of transforming strategies into operational programs; and (2) improving the SCPM by using appropriate decision-making models in each level.
Performance management is a necessity for or-ganizational competitiveness [2]. It determines what must be maintained as the strong point and what
needs to be overcome as the weak point [3]. The important aspect that has impacts on the success and eciency of optimization models is to design such models based on reliable performance indicators. Sup-ply Chain Operations Reference (SCOR) model is one of the important models in performance management that contains major processes, metrics, and standard characteristics [4]. The SCOR model divides major metrics into many partial indicators at lower levels.
Although the main goals of SCPM are pursued at the strategic level, the activities that directly create value-added products and services are involved in the operational level [5]. Therefore, the alignment of decisions is an important matter that should be investigated [6]. However, most of the researches in the literature consider that the decisions at dierent levels of SC are independent. As an attempt to ll the mentioned gaps, an SCOR based framework for measuring, evaluating, and improving SCPM is proposed in this research.
The remainder of this paper is organized as follows. Section 2 presents a summary of recent and major studies carried out on SCPM. In Section 3, the main new framework of SCPM is described. Solu-tion approach is presented in SecSolu-tion 4. SecSolu-tion 5 comprises problem description, in which a sample SC is illustrated. Techniques and tools used in this research are explained in Section 6. Experimental design is explained in Section 7. Section 8 discusses computational results, in which illustrative tables and gures are presented. Finally, Section 9 provides the conclusions by discussing the advantages of the proposed framework and further research areas as well.
2. Literature survey 2.1. Review papers
Because of the importance of SCPM, signicant studies have been conducted on this topic and many models have been developed so far. In this regard, Estampe et al. (2013) classied and discussed the most im-portant frameworks for performance management in a review paper [7]. They dened ve levels for SC maturity grid at rst and then compared 16 frameworks including type of usage, conditions and constraints, degree of conceptualization, and established indicators. They also presented the applications and limitations of the selected frameworks. Singh and Acharya (2014) investigated the eective factors on the performance of SC [8]. Schaltegger et al. (2014) carried out a structured review of the existing literature and re-searches in the eld of sustainable SC's measurement and improvement [9]. A systematic literature review of SCOR model applications with special attention to environmental issues was carried out by Ntabe et al. (2015) [10].
2.2. Concepts
Performance measurement provides important mea-sures and tools for assessing the outputs and makes the overall improvement in SC [9]. One of the key elements in an ecient and protable SCM is to employ an eec-tive performance measurement system [11]. Kocaoglu et al. (2013) emphasized the structural integration of performance measurement and quantication of models for selecting SC strategies [12].
SCPM is an important issue in the competitive business environments and plays a vital role in dening the objectives, evaluating the results, and determining the future measures. Because of the importance of SCPM, signicant studies have been conducted on this topic and many models have been developed so far. In this regard, Estampe et al. classied and discussed the most important frameworks for performance manage-ment in a review paper [7].
Flexibility, output, and resources are the three im-portant aspects of SC performance [13]. However, Gu-nasekaran et al. classied the performance metrics into strategic, tactical, and operational levels [14]. Some researches presented administrative frameworks and step-by-step methods for performance improvement. Cai et al. introduced a framework for performance management and proposed a new approach for selecting key performance metrics (KPIs) in strategic level [15]. Elgazzar et al. suggested a performance assessment framework based on a nancial approach using SCOR model and Analytic Hierarchy Process (AHP) [16]. Agami et al. proposed a performance improvement model to determine the bottleneck of KPIs using a successive ve-step process [11].
2.3. Mathematical models
A given SC has a multi-level, multi-criteria, and interrelated structure in which the performance im-provement of one unit does not clearly assure the optimized performance of the whole SC [17]. Agami et al. developed a fuzzy model so as to identify the critical KPIs [18]. In this regard, Blanco presented an Integer Linear Programming (ILP) model including three objectives and extended a solution approach for solving the studied problem [19]. Liu and Papageor-giou presented a multi-objective Mixed Integer Linear Programming (MILP) model to optimize a multi-period problem dealing with production, distribution, and capacity planning in an SC in process industries [20]. Hamta et al. developed a hybrid Particle Swarm Optimization (PSO) algorithm for a multi-objective assembly line balancing problem with exible operation times, Sequence-Dependent Setup Times (SDST), and learning eect [21]. Kolahan and Kayvanfar developed a heuristic algorithm approach for scheduling of multi-criteria unrelated parallel machines [22].
the Genetic Algorithm (GA) to solve a multi-period real-time model [23]. High usability and exciting philosophy of Goal Programing (GP) for practitioners and researchers in handling decision-making problems with multi-objective structures made it very applicable [24,25]. In [26], an interactive GP model was created for virtual manufacturing cells procedure, while Mah-davi et al. (2011) developed a fuzzy GP method for solving a multi-objective model of production planning in a virtual manufacturing system [27].
Wong developed a Decision Support System (DSS) using fuzzy logic based on expert judgments to select 3PL [28]. Xu et al. proposed a multi-objective model to optimize a multi-period SC with stochastic demand using a fuzzy method [29]. Cai et al. developed a multi-objective optimization model based on SCOR indicators and solved the problem using PSO algorithm [30].
2.4. SCOR
Designing the models based on reliable performance indicators is one of the most important aspects aect-ing the success and eciency of optimization models. SCOR model is the performance assessment frame-work in the literature that provides the mentioned comprehensiveness and reliability to respond to our concerns. Zhang and Reimann used ve high-level indicators of SCOR, simultaneously, to optimize SC performance and proposed a ve-objective multi-period mathematical model for planning a two-echelon SC with deterministic demand by applying customized indicators [31]. Kocaoglu et al. presented a multi-objective model to align the operational decisions with the strategic decisions using SCOR framework [12]. They determined the relative importance of dierent strategies using AHP and the hierarchical structure of SCOR and then selected the best scenarios in which SC performance was optimal by applying Technique for Order of Preference by Similarity to Ideal Solution (TOPSIS) method.
2.5. Research gap
Despite devoting many eorts over the past decade, there are still gaps in this area and, owing to some shortcomings, the capabilities of SCPM frameworks are not adequate [12,32]. Obviously, one element is not able to optimize the whole SC. The question is how we must manage such complex system to be able to achieve continuous and acceptable productivity [33]. Attaining appropriate optimization approach and continuous im-provement as well as proper guarantee of them through the SC is the critical issue that should be addressed in dierent levels of SC studies [34]. Management strategies should be designed based on the changing conditions of the market [35]. In many studies, dierent parts of the SC are assumed independent
and their internal relations and changing behaviors are not considered. In addition, there are some defects in analysis of feedback in design and implementation stages in order to adapt the behavior of SC for the environmental changes [36]. Many of the studies are not comprehensive enough and cannot evaluate and improve the performance based on the performance indicators. Static nature of some proposed systems for performance evaluation is one of the critical issues. The proposed quantitative models mostly focus on individual factors such as scal measures to assess SC performance [37]. The problem is how we can model and analyze the strategic and operational objectives, and connect them to each other appropriately [12]. According to Wang et al. [38], despite the ability of SCOR to provide appropriate indicators, it has not been used enough in the literature. According to the recommendations in the literature, it is better to employ comprehensive and reliable indicators such as SCOR to develop the mathematical models for performance management [39].
In conclusion, with respect to the importance of SCPM and mentioned deciencies, more studies have to be carried out to cover these research gaps. Finally, the main problems and defects are presented according to the literature. It can be claimed that most of the current studies suer from one or more of the following shortcomings:
Limited number of studies on the combination of related concepts (keywords of this paper) and taking advantage of their synergies;
Inability to support the continuous improvement;
Local optimization;
Lack of comprehensive and acceptable performance evaluation models.
As an attempt to ll the mentioned gaps, an SCOR based framework for measuring, evaluating, and improving SCPM is proposed in this research. The presented framework is comprehensive, dynamic, and continuous. It applies sciences, techniques, and tools, namely, SCPM, strategic planning, multi-objective optimization, and SCOR model, to a new SCPM.
3. A SCOR-based dynamic SCPM framework To design an integrated SCPM structure, SCOR model has been used. The SCOR model divides major metrics into many partial indicators at lower levels. Given the hierarchical structure of SCOR, achieving higher values for performance indicators at any level enables better performance through the entire SC. This detailed structure enables us to design acceptable and comprehensive multi-objective functions. Figure 1 shows the new SCPM proposed in this study.
Figure 1. The logical design for integrated SCOR-based SCPM framework.
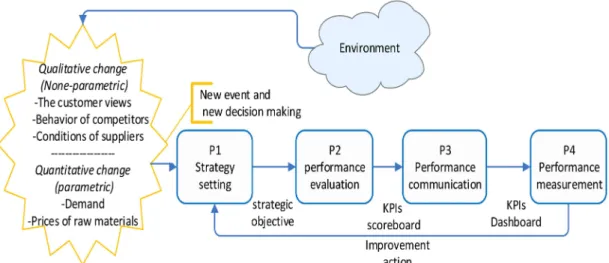
Figure 2. The human-intelligence based decision-making.
Given such adaptive approach, we assume that all internal and external changes aecting decisions are detected and proper responses for these events are then presented. Therefore, for adaptation to the latest changes, related decisions will be updated. In other words, event-driven policy is used. Based on the nature of events and type of decisions, the new denition proposed in this paper categorizes decisions into two groups. The rst category is human-intelligence based decisions. Such decisions are taken at the highest level of SCPM and inuence all the lower levels. The second group of decisions is machine-intelligence based
deci-sions. These decisions are less complex than human-intelligence ones and more structured. Typically, problems such as inventory control, and production and distribution planning are considered at this level.
A process model is usually used for decisions on strategy planning in the literature, which only matches the capabilities of human intelligence [11]. In this paper, a specic process is developed for human-intelligence based decisions. The main phases of the proposed process of human-intelligence based decision-making are illustrated in Figure 2.
objec-tives. In this step, we employ a prioritization method to deal with the multi-objective problem. In the second phase (P2), the current performance of each metric is evaluated and the gap between actual and target values is measured (according to Table 1). In the third phase (P3), the results of operations and analysis of metrics are demonstrated in a dashboard to determine which performance metric does not meet predetermined expectations. Such metrics are iden-tied as performance bottlenecks. The performance results which are the \operational level's output" have impact on strategic design of the next level. In the nal phase (P4), according to the results, management takes appropriate measures to improve and achieve higher levels of performance metrics in subsequent operations.
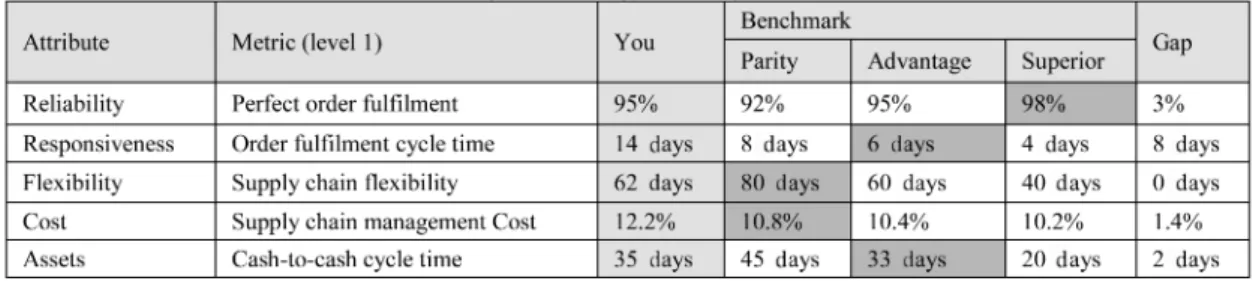
Table 1 employs the rst level of SCOR's metrics and shows the analysis of the current condition, the strategy setting, priority of performance objectives, and the gap between current condition and target value. First, numerical column shows the current condition of the SCPM. The next three columns show the benchmark values of each metric in three levels, i.e., parity, advantage, and superior [40]. Grey cells indicate the priority of each of the ve objectives. Finally, the last column shows the gap between current condition and target value. Once Table 1 is set, a new strategic plan can be designed. By determining the SC objective priorities, all plans and programs are designed using these priorities while we try to ll the gap. This is the main approach to align all SCPM decisions.
To deal with operational planning problems, we can develop DSSs using machine-intelligence. All quantitative models including Linear Programing (LP), Non-Linear Programing (NLP), fuzzy, meta-heuristic, simulation, deterministic, stochastic, or a combination of them can be used at machine-intelligence level.
Once any change or update comes up on decision-making modules in the strategic and operational levels, an intermediate decision-making module is updated to align high- and low-level decisions (Figure 3). In this case, the module selects a solution from the Pareto optimal solutions provided by the mathematical model at the low level which has the highest alignment with the strategic objectives of SCM. This module has
Figure 3. The relationship between human- and machine-intelligence based decisions.
been developed on the basis of machine intelligence. In this case, the multi-objective function of opera-tional plan should be adjusted according to strategic goals and priorities. Fuzzy and TOPSIS approaches could be employed so as to develop this module as well.
4. Solution approach
Any change in parameters will be detected as a new event and, therefore, will cause change in inputs of the decision model. Consequently, the optimization model is run again in the correspondent level and the best decision will be updated. Then, the decisions in all levels will be aligned with each other using the appropriate decision models.
4.1. Levels of decision
Strategy setting: First, the SC's priorities are de-termined. For some objectives, worse values than the corresponding single-objective optimum values might be considered. In such a condition, accessibility to so-lutions with higher values for higher priority objectives
increases. In another situation, similar to what is ex-plained in Table 1, one can consider the least acceptable values for \Advantage" and \Parity" objectives and optimize one of the objectives as \superior" at the most possible value. Each of these approaches is a dierent strategic scenario, which could be taken in high level of SC and applied to the lower levels. The multi-objective mathematical model is initially separated into the single-objective problems. In other words, in order to obtain the best possible value for each objective, one should optimize each objective separately. By doing so and setting the SC's priorities as described above, the ideal solutions are obtained, which will then be used by TOPSIS method (Machine decisions or operational decisions).
Operational decisions: On the other hand, in the second step, the multi-objective problem is solved in parallel with NSGAII algorithm to achieve the feasible solutions to the entire problem regarding all con-straints. These solutions are not optimum with respect to the obtained optimum values from the rst step. The solutions gained at this step are sorted based on non-domination method and the best Pareto solutions could be chosen by the decision maker (Operational decisions).
Decisions alignment: Finally, in the third step, we need to align the strategic decisions with the operational ones. To do so, the Pareto set solutions are used in TOPSIS method, as a multi-criteria decision analysis, to yield the best compromise solutions which satisfy the dierent objectives to the possible extent. Actually, TOPSIS compares the gained feasible solu-tions of Pareto set with the ideal solusolu-tions. In other words, TOPSIS stands on the concept that the selected alternative should have the shortest geometric distance from the positive ideal solution while there should be the longest geometric distance from the negative ideal one.
5. Problem formulation
In order to demonstrate how the new proposed frame-work performs, a sample SC is suggested and a nu-merical example is then solved and described to show the eciency of the proposed approach. Suppose a two-echelon SC including several suppliers and manu-facturer. Several products of a family are produced in this SC and planning is accomplished during multiple periods. A multi-objective multi-period two-echelon mathematical model for the considered SC is proposed in this section. The other assumptions are summarized as follows:
The parameters in each period are assumed to
be known, deterministic, and xed throughout the planning periods;
The objective of the proposed model is to minimize the total cost of logistics and maximize the agility and reliability in the considered SC, simultaneously;
In each period, demands are given and determined;
Both xed and variable transportation costs from suppliers to manufacturers are considered.
5.1. The mathematical model Notations
Indices
I Number of suppliers; J Number of plants; L Number of products; N Number of materials; T Number of periods; Parameters
Dljt The demand of product l from plant j
in period t;
Urnl The amount of material n to produce
one unit of product l;
Capsnit Capacity of supplier i to supply
material n in period t;
Cappljt Capacity of plant j to produce product
l in period t;
V mrj The volume of raw materials at plant
warehouse;
V mpj The volume of the nished product at
plant warehouse;
P clj Production cost of one unit of product
l (with the exception of raw material) by plant j;
P rni Price of material n determined by
supplier i;
Hmrnj Inventory holding cost of material n at
plant j;
Hmplj Inventory holding cost of product l at
plant j;
Qpl Required space per unit of product l;
Qrn Required space per unit of material n;
F crnij Fixed transportation cost for handling
material l from supplier i to plant j; V crnij Transportation cost for handling a unit
of material l from supplier i to plant j; T drnijt Delivery time of a unit batch of
material n from supplier i to plant j in period t;
T rmaxnijt Due date for delivering a unit batches
of material n from supplier i to plant j in period t;
Bsmni Batch size of material n at supplier i;
SSmnjt Safety stock of material n at plant
warehouse j in period t;
Cbllj Backlog unit cost of product l in plant
j in period t;
ljt Maximum backlog amount of product
l at plant j in period t (percent of unsatised demand);
Decision variables
Xnijt Amount of supplied material n by
supplier i to plant j in period t; Yljt Amount of produced product l by
plant j in period t;
IRmnjt Inventory level of material n at plant j
at the end of period t;
Ipmljt Inventory level of product l at plant j
at the end of period t;
T Rnijt Receiving time of material n from
supplier i by plant j in period t; Wnijt 1, if plant j orders material l from
supplier i in period t; 0, otherwise; BLgljt Backlog level of product l at plant j in
period t;
Qljt Sale amount of product l at plant j in
period t; Objective functions
T C The cost of supply chain; T Cs(Cost) The costs of the suppliers;
T Cp(Cost) The costs of the plants;
Ag(Agility) Flexibility: Surplus capacity; Ags(Agility) Flexibility: Surplus capacity of
suppliers;
Agp(Agility) Flexibility: Surplus capacity of plants; Rel(Reliability)Perfect order fullment;
Mathematical model Minimize TC (Cost)
T C = T Cs+ T Cp; (1)
T Cs=
X t X n X i X j
Xnijt:P rni
+X t X n X i X j
Wnijt:F crnij
+X t X n X i X j
Xnijt:V crnij
+X t X n X j
Hmrnj:IRmnjt (2)
T Cp =
X t X l X j
Yljt:P clj
+X t X l X j
Hmplj:Impljt
+X t X l X j
Cbllj:BLgljt: (3)
Maximize Ag(Agility)
Ag = Ags + Agp; (4)
Ags =X
t X n X i 0 @Capnit X j Xnijt 1 A; (5) Agp =X
t
X
l
X
j
Capljt Yljt: (6)
Maximize Rel(Reliability)
Rel =X
t
X
l
X
j
Reltlj; (7)
Reltlj Yljt+Ipmljt 8l;j and 8t2 [1; T ] ; (8)
Reltlj Dljt 8l;j and 8t2 [1; T ] : (9)
The rst main objective minimizes total costs of system, including costs of suppliers and manufacturers (Eq. (1)). Supply costs (Eq. (2)) comprise raw material costs, xed transportation costs of raw materials and variable transportation costs of materials to facilities, and holding cost of raw materials at plants in each period. Eq. (3) signies production costs including manufacturing costs, holding costs of nished products at plants, and backlogged costs in each period. The second main objective maximizes the system agility (Eqs. (4)-(6)). The most signicant metric to measure agility of an SC is exibility, which reects the ability of reacting to external inuences. According to Sabri and Beamon (2000) [41], exibility could be measured through surplus capacity. In this paper, in order to evaluate exibility, the maximum extra demand, which could be satised through surplus capacity of the SC, is considered. The third main objective maximizes reliability of the system. Reliability could be dened as ability of satisfying customer demands on time with the right quantity. Perfect order fulllment could be called the rst-level metric of reliability (Eq. (7)). The perfect order fulllment depends on the minimum of products available (Eq. (8)) and demands (Eq. (9)) in the same period. The applied constraints of the considered SC are as follows:
Subject to: Inventory level
Note: Inventory in the initial time period (period 0) is zero:
IRmnjt= IRmnj;t 1+
X
i
Xnijt
X
l
Urnl:Yljt;
8t;n;j; (10)
IP mljt= IP mlj;t 1+ Yljt Qljt; 8t;l;j; (11)
IRmnjt SSmnjt; 8t;n;j; (12)
Volume warehouse X
n
Qrn:IRmnjt V mrj; 8t;j; (13)
X
l
Qpl:Ipmljt V mpj; 8t;j: (14)
Product capacity X
j
Xnijt Capnit; 8n;i;j;t; (15)
Yljt Capljt; 8l;j;t: (16)
Delivery time
T drnijt (Xnijt/Bsmni) T rmaxnijt; 8n;i;j;t;
(17) where:
T drnijt:Xnijt/Bsmni= T Rnijt; 8t;l;j: (18)
Backlog demand
BLgljt= BLglj;t 1+ Dljt Qljt; 8t;l;j; (19)
BLgljt ljt:Dljt; 8t;l;j; (20)
Dljt Qljt BLgljt; 8t;l;j: (21)
Logical
Wnijt:M1 Xnij; M1;A very big number; (22)
Wnijt2 f1; 0g ; 8n;i;j; (23)
Xnijt; Yljt; IRmnjt; Ipmljt; T Rnijt; Wnijt;
BLglt; Qljt 0; 8n;l;i;j: (24)
Constraint sets (10) and (11) dene the inventory balancing equations for raw materials and nished
products at the warehouses of the manufacturer, re-spectively. Constraint (12) demonstrates the balance of raw material safety stock at the warehouse of the man-ufacturer. Constraints (13) and (14) specify the limited storage spaces of raw materials and nished products at the warehouses of the manufacturer, respectively. The row material capacity of each supplier for each material in each period is ensured through Constraint (15). The production capacity of each manufacturer for each product in each period is ensured through Constraint (16). Constraints (17) and (18) deal with on time delivery and guarantee the limited delivery time for the manufacturers. Constraint (17) shows that the delivery time of raw materials by suppliers is less than the maximum acceptable time determined by manufacturers. Constraint (18) demonstrates delivery time of raw materials from suppliers to manufacturers in each period. Constraints (19)-(21) are concerned with the amount of backordered demand. In this context, Eq. (19) shows the balance of backordered numbers of products in any two consecutive periods. Constraints (20) and (21) demonstrate the boundary of backordered amounts of each product with respect to its demand for the manufacturers. Constraint (22) ensures that the supplied raw material n will be delivered to manufacturer j from supplier i if and only if the corresponding supplier is established. Finally, Constraints (23) and (24) show the binary variables and non-negativity constraint, respectively.
6. Technique and tools
6.1. Non-dominated sorting genetic Algorithm II
Optimization of conicting objectives could be in-vestigated in terms of multi-objective optimization. Evolutionary Algorithms (EAs) are potent stochastic search methods which mimic the Darwinian principles of natural selection and are adequate to solve opti-mization problems with large search space (Anagnos-topoulos and Mamanis, 2010). Up to now, numerous Multi-Objective Evolutionary Algorithms (MOEAs) have been suggested in the literature. Non-dominated Sorting Genetic Algorithm II (Deb et al., 2002) [42] is one of the most commonly used multi-objective algorithms among researchers. In this research, an eort is made to apply NSGAII to the considered multi-echelon SC problem.
6.2. Solution representation
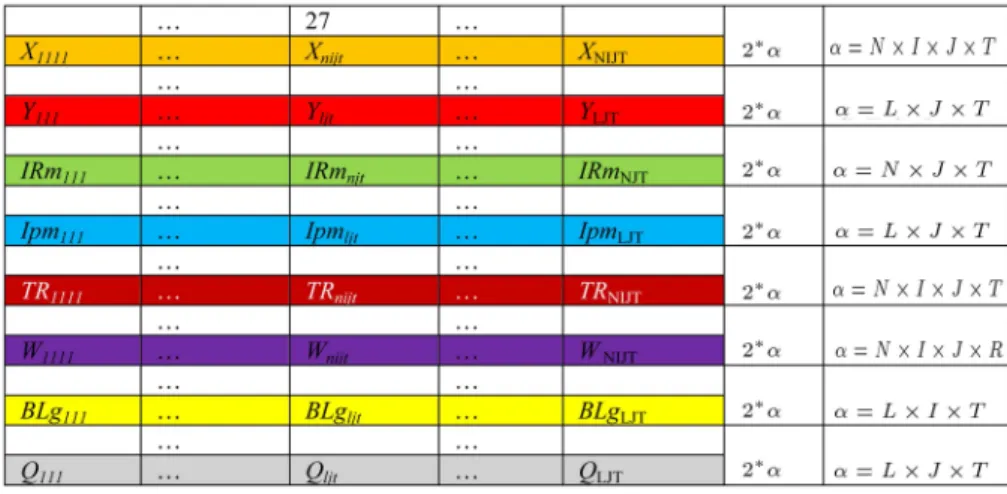
It is obvious that all demand values are integer and pos-itive. In order to represent dierent points of solution space, a general structure with capability of showing dierent variables is used. This matrix-based structure has a dimension of 2. Since decision variables of the considered problem are more than one, there are
dier-ent matrices with dierdier-ent values of . For example, Xnijtis four-dimensional variable and represents N
I J T . The contents of the rst and second columns indicate \the value of this variable in that point" and \variable index," respectively. As an instance, `27' denotes that the number of 27 units of material n are supplied by supplier i to manufacturer j in period t. A similar structure with dierent dimension is employed for the rest of variables, such as IRmnjt, so as to
represent the chromosome (variable). It is obvious that is dierent for the matrix that shows other variables. Figure 4 shows the structure of solution representation. By using the above-mentioned structure, a random initial population is generated. These generated solu-tions should be rstly sorted based on non-domination, which is explained in the next subsection.
6.3. Non-dominated sorting algorithm
To sort a population according to the level of non-domination, each solution should be compared with every other solution in the population to recognize whether it is dominated or not. In fact, the idea behind non-dominated sorting procedure is using a ranking selection method to highlight good points and a niche method should be employed so as to retain steady sub-populations of good solutions. Owing to determining solutions of the rst non-dominated front, in a naive approach, each solution could be compared with others in the population to realize whether it is dominated or not. Consequently, all individuals located in the rst non-dominated front are found in this step. In order
to determine the individuals in the second and higher non-dominated levels, the solutions of the rst front are discounted temporarily and the above procedure is repeated (Deb et al., 2002) [42].
6.4. Diversity mechanism
Accompanied by convergence on the Pareto-optimal set, nding good solutions spread in the obtained set of solutions by an EA is preferred. To acquire an approximation of solutions' density surrounding a specic individual in the population, the average distance of two points on either side of this point along each of the objectives should be computed. The quantity idistance, named \crowding distance," is an
estimate of the size of the largest cuboid comprising the point i without any other point in the population. In point of fact, the value of total crowding distance is computed as the sum of individual distance values corresponding to each objective. A solution positioned in a less dense cuboid is permitted to have a higher probability to survive in the next generation. The crowded-comparison operation (Figure 5) or ( n) must be employed, after allocating a crowding distance to all individuals with the intention of comparing two individuals for their extent of nearness to other ones, which directs the selection procedure at the various stages of the algorithm toward a uniformly spread-out Pareto-optimal front (Deb et al., 2002) [42].
6.5. Selection mechanism
Parent population, named P0, should be rstly
ran-Figure 4. Representation of the structure of chromosomes in the considered problem.
domly generated, which is sorted based on the non-domination. Each individual is then assigned a tness or rank equal to its non-domination level. Selection op-erator chooses a set P0 P0of the chromosomes
(bet-ter members of the population with bet(bet-ter tness val-ues), which will be given the chance of mating and mu-tating. The common binary tournament selection op-erator based on the crowded-comparison opop-erator n
is employed in this research so as to encode NSGAII. 6.5.1. Crossover and mutation operators
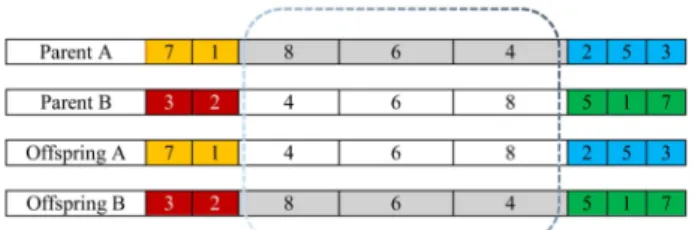
Generating ospring by taking two parent chromo-somes from the mating pool is called crossover. This process is carried out with the intention of nding better solutions. The crossover operator is applied according to a probability pc over the opted ospring
attained through roulette wheel method. Among several common crossover operators, a standard two-point crossover is applied in this study with the purpose of generating two ospring from two parent solutions. Having randomly selected two points in a string, the sub-strings between the crossover points are interchanged. Figure 6 depicts applying the crossover operator to the two selected parents.
Mutation operator is commonly utilized with the purpose of diversifying the population to avoid premature convergence on multiple copies of one in-dividual. Once the ospring is attained, a mutation operator with a probability pm could be employed.
Among various types of mutation operators, the swap mutation had the best performance in the problem at hand. This operator swaps two genes in the selected chromosomes; also, it keeps away from getting stuck in local suboptimal solutions and is very helpful to maintain the wealth of the population in dealing with large-scale problems. Figure 7 shows the mutation operator used in this paper.
6.6. Software specication
All mathematical models are coded in GAMS 24.1.2 and solved by the CPLEX in terms of three separate
Figure 6. Applied two-point crossover operator.
Figure 7. Applied mutation operator.
single-objective problems. Also, the generated test instances are implemented in MATLAB 7.11.0 and run on a PC with a 3.4 GHz Intel® CoreTM i7-2600
processor and 4 GB RAM memory.
7. Experimental design
Parameter tuning has an important eect on the eciency of the meta-heuristic algorithms. Among several ways of calibrating the algorithms, one can mention full factorial experiment [43]. This approach is not always eective, especially when the number of factors becomes considerably large. With the intention of reducing the number of required experi-ments, a Fractional Factorial Experiment (FFE) was developed [44]. FFE allows only a segment of the total possible combinations to approximate the main eect of the factors and some of their interactions. Taguchi (1986) developed a family of FFE matrices which nally diminished the number of experiments, but still provided satisfactory evidence [45]. Orthogonal arrays are employed in Taguchi method to study a large number of decision variables with a small number of tests.
Taguchi separates the factors into two main categories: controllable factors (S) and noise factors (N). Noise factors, as it is implied in the name, are those that one cannot directly control. Since it is impossible to completely eliminate the noise factors, the Taguchi method tries to minimize the eect of noise and, simultaneously, determine the optimal level of the important controllable factors based on the concept of robustness [46]. Besides determining the optimal levels, Taguchi established the relative importance of individual factors in terms of their main eects on the objective function [47].
Taguchi created a conversion of the repetition data to another value, which was the measure of variation. This conversion is called signal-to-noise (S=N) ratio, which describes why this type of param-eter design is named a robust design [48]. The term `signal' shows the desirable value (response variable) and `noise' indicates the undesirable value (standard deviation). Accordingly, the S/N ratio determines the amount of existing variation within the response variable (Eq. (25)). Here, maximization of the signal-to-noise ratio is addressed.
S/N ratio = 10 logMIDsp 2; (25) where sp signies spacing, which measures the stan-dard deviation of the distances among solutions of the Pareto front [49] and MID signies \mean ideal distance" and measures the convergence rate of Pareto fronts to a certain point [50]. These two measures are
Table 2. Factor levels for sample instances.
common measurement factors considered in calculating S=N ratio, since in Pareto-based multi-objective algo-rithms, two main goals comprising \good convergence" and \diversity" are sought [51].
7.1. Data generation and setting
An experiment is conducted to test the performance of the used algorithms. Three factors are considered as control factors in this research, namely, crossover rate (pc), mutation rate (pm), and population size (npop),
each of which has three levels. Table 2 shows the factor levels for the applied sample problems.
Since there are three three-level factors in this research, the total number of trials required for each group would be a full combination of 27 (33) trials,
rather than 9 trials, by the orthogonal array L9(33).
7.2. NSGAII parameters tuning based on Taguchi method
As already mentioned, parameter tuning can signif-icantly increase the solutions quality of the meta-heuristic algorithms. An eort has been put to tuning the parameters for the aforementioned factors, i.e., crossover rate (pc), mutation rate (pm), and population
size (npop). Table 3 shows the Taguchi orthogonal
Table 3. Taguchi orthogonal array design.
array design applied in this research, which has been extracted from Minitab software.
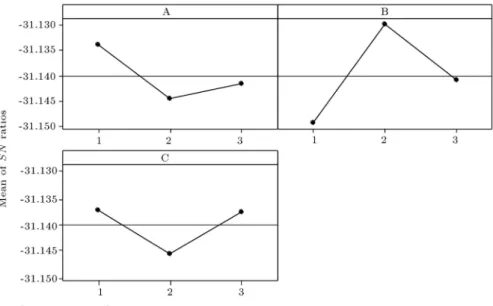
After obtaining the results of the Taguchi ex-periment for all the trials, all objective functions are individually transformed into S=N ratios. Figure 8 illustrates the eect plot for S=N ratio obtained at each level for the sample problems. In this research, each test instance is run 3 times and the average solution values are obtained and used for performance evaluations. As indicated in Figure 8, the optimal level of factor A is A(1), while the optimum level of factor B is B(2). Also, C(3) could be selected
as the optimum level of factor C; however, C(1) has comparable performance.
8. Computational results
The computation steps of the decision-making process in this research consist in the following three parts:
Step 1. Transforming the multi-objective mathe-matical model into several single-objective models and solving them separately to obtain the best/ideal solutions for each objective. The obtained values are then used to tune the boundaries of criteria, namely, \superior," \parity," and \advantage." Strategic decisions are applied to lower levels as scenarios to tune their parameters.
They are run only once and their results are used in all scenarios;
Step 2. Solving the multi-objective model using NSGAII so as to achieve the feasible solutions to the entire problem.
They are run only once and their results are used in all scenarios;
Step 3. Applying TOPSIS method in order to determine the best solutions/individuals based on the decision maker's idea with respect to minimum distance from the ideal solutions.
They should be run independently for each scenario to specify the results of any specic scenario. The computational results are obtained from the three sections.
The decision-making structure, how decisions are aligned based on a top-down approach, and numerical results are presented in Tables 4 and 5. Table 4 shows the consequences of running the rst step. Non-numerical rows show the multilevel integrated model structure. Columns A to L represent the concept of each number in rows. Each of the numbered rows shows a complete decision-making scenario including the strategy setting and the operational plan that are aligned with each other.
Columns A to C represent a strategic scenario. In the highest level of SCPM, human-intelligence deter-mines the objective priorities based on SCOR metrics. These priorities dene the strategies in the next period. All programs in low levels are implemented based on these priorities.
In columns D to F, the optimum objective func-tions for the strategic scenario are presented. Columns G to L show the values of objective functions in a discrete form for the supplier and manufacturer. Note that the manufacturer cannot produce without components and, as a result, the reliability of the supplier is constant for all scenarios and, therefore, is not considered in calculations. Each record in
operational level suggests an operational production and supply plan, which is not described here for the sake of brevity.
In Table 4, rows 1 to 3 present the scenarios in which each of the objectives has been optimized in a single-objective form. The second row is explained for more clarity. In the designed scenario, SC's strategy is to maximize the agility; therefore, W2 becomes 1 and other weights become 0. By setting these weights for the multi-objective model and solving the model, the maximum value of 176 is obtained for agility. In this scenario, cost is 479 and reliability is 17. Agility of the third scenario deviates by 56 units from the second scenario's agility, which optimizes reliability. Reliability in the third scenario with the best possible program for this metric is 30.
Once the best possible solution is given for each objective, they are used to determine the benchmark levels. As shown in Table 1, levels of metrics can be classied into three benchmark levels. There are four methods that can be used to set performance targets: theoretical targets, historical based, external benchmarks, and internal benchmarks (internal \best in class" practice) [52,53]. This example only tries to show the operation mechanism of the proposed framework. For determining parity and advantage values, the objective values of 1 to 3 are used for the scenario. We assume that this set provides good internal range for determining superior, advantage, and parity values (the end of Table 4).
The complete calculations of Step 2 are not pre-sented for the sake of brevity. However, the complete results of Step 3 are presented in Table 5.
Each record of Table 5 has two main parts. Columns A, B, and C determine simultaneous strategy so as to get the specied level of three main objectives. Columns D to L signify the best operational decision to reach the determined strategy. In this regard, the operational decision is output of Step 3.
This solution is determined by comparing all obtained Pareto solutions from Step 2 considering given strategic priorities (according to Figure 3). However, depending on strategists' priorities for the objectives, dierent scenarios will be generated. As an example, in the presented scenario in row 9, the most impor-tant objective (S = Superior) is minimizing cost, the second most important goal is maximizing agility (A = Advantage), and maximizing reliability is the least important one (P = Parity). According to this strategy and by implementing the third computational step, the best solution among Pareto solutions is determined. In this solution, the total cost is 364, agility is equal to 138, and reliability is 17; the values of 8 sets of model variables are specied as well. In Table 6, only the values of Xnijt of scenario #9 are presented for the
Table 4. Dened target values for strategic objectives.
Table 6. Xnijt (the amount of supplied material n by supplier i to plant j in period t).
8.1. Sensitivity analysis
As already mentioned, the rst and second compu-tational steps in all scenarios are implemented only once. The third step should be run again by any change in strategies. Model sensitivity with respect to these changes is investigated in this section. Such a sensitivity investigation clearly illustrates the relation between operational and strategic levels.
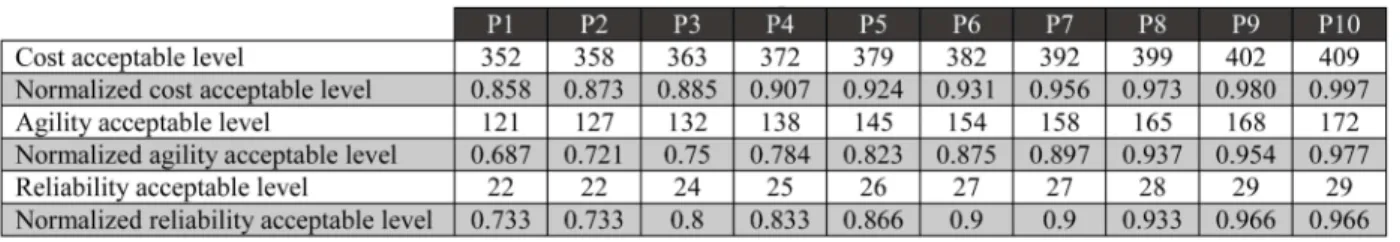
In Figure 9, the eects of bound variations of `superior,' `parity,' and `advantage' in strategic level are shown. Changing the selected numbers within acceptable range of strategic objectives in the third last record of Table 4, the behavior of the model in choosing the optimum point changes. In this condition, the changes have no impact on the generation of Pareto solutions. These changes aect weights of the ideal point in TOPSIS model and lead to creation of dierent nal alternatives among a xed Pareto set of solutions as the nal selected point by the comprehensive model. In Figure 9, the acceptable levels of objectives are divided into 10 parts and, consequently, 10 dierent points are specied so as to determine the strategy level (Table 7).
Applying these 10 points in weighting ideal
TOP-Figure 9. Pareto optimal non-dominated solutions obtained via NSGAII.
SIS, we illustrate how one can select dierent points in a Pareto set with 10 members/solutions through changing acceptable levels. The results are shown in a 3-dimensional space in Figure 9.
9. Conclusions and future studies
This study presented a comprehensive framework for SC performance improvement using a dynamic align-ment of strategic and low-level decisions. Generally, to the best of the authors' knowledge, there is no outstanding research in the literature in which the men-tioned criteria have simultaneously been investigated.
Two echelons consisting of suppliers and man-ufacturers were considered in the proposed SC. The presented operational model carefully considered im-portant SC features such as several suppliers, several plants, several materials, and several products during multiple periods. The operational model aimed at minimizing the supply cost and production cost as well as maximizing supply agility, production agility, and SC reliability.
The results of computational experiments demon-strated the operation of the proposed solution method. Then, a sensitivity analysis was conducted on the parameters, and scenarios of the proposed approach and the results were discussed. The main contributions of this framework could be classied as follows:
1. Improved performance indicators by aligning all SC decisions;
2. Using SCOR model for presenting an integrated, simultaneous, and connected framework for perfor-mance evaluation and improvement at the whole SCM levels;
3. Providing a human-intelligence based decision-making process for strategic plan setting;
4. Providing a machine-intelligence based decision-making process for quantitative modelling of the low levels.
Moreover, the main contributions of the opera-tional model can be listed as follows:
1. Considering cost, agility, and reliability as objec-tive functions in a two-echelon SC, simultaneously, according to SCOR model;
2. Analyzing the behavior of the proposed approach using a sensitivity analysis considering several sce-narios.
Due to using dierent methodologies and scientic concepts, the proposed Supply Chain Performance Management (SCPM) framework provides a reliable structure and has many practical applications in dif-ferent areas. However, based on the capabilities of this framework, the following future developments are proposed:
1. Expansion of the model under stochastic program-ming or fuzzy set theory by taking into account the parameters of demand, cost, and processing times;
2. Adding other SC features such as \distribution" to the proposed model.
References
1. Masoumi, M.K., Salwa Hanim, A., Ezutah, O., et al. \An integrated framework-for designing a strategic green supply chain with an application to the auto-motive industry", International Journal of Industrial Engineering, 22(1), pp. 46-61 (2015).
2. Bai, C. and Sarkis, J. \Supply-chain performance-measurement system management using neighbour-hood rough sets", International Journal of Production Research, 50(9), pp. 2484-2500 (2012).
3. Sellitto, M.A., Pereira, G.M., Borchardt., M., et al. \A SCOR-based model for supply chain performance measurement: application in the footwear industry", International Journal of Production Research, 53(16), pp. 4917-4926 (2015).
4. Alomar, M. and Pasek, Z.J. \Linking supply chain strategy and processes to performance improvement", Procedia CIRP, 17, pp. 628-634 (2014).
5. Badri, H., Ghomi, S.F., and Hejazi, T. \A two-stage stochastic programming model for value-based supply chain network design", Scientia Iranica. Transaction E, Industrial Engineering, 23(1), p. 348 (2016).
6. Skipworth, H., Godsell, J., Wong, C.Y., et al. \Supply chain alignment for improved business performance: an empirical study", Supply Chain Management: An International Journal, 20(5), pp. 511-533 (2015).
7. Estampe, D., Lamouri, S., Paris, J.L., et al., \A framework for analysing supply chain performance evaluation models", International Journal of Produc-tion Economics, 142(2), pp. 247-258 (2013).
8. Singh, R.K. and Acharya, P. \Performance evaluation of supply chain management systems: a critical review of literature", International Journal of Procurement Management, 7(2), pp. 201-218 (2014).
9. Stefan Schaltegger, P.R.B., Dr, Bai, C., and Sarkis, J. \Determining and applying sustainable supplier key performance indicators", Supply Chain Management: An International Journal, 19(3), pp. 275-291 (2014).
10. Ntabe, E.N., Lebel, l., Munson, A.D., et al. \A systematic literature review of the supply chain opera-tions reference (SCOR) model application with special attention to environmental issues", International Jour-nal of Production Economics, 169, pp. 310-332 (2015).
11. Agami, N., Saleh, M., and Rasmy, M. \A hybrid dynamic framework for supply chain performance im-provement", Systems Journal, IEEE, 6(3), pp. 469-478 (2012).
12. Kocaoglu, B., Gulsun, B., and Tanyas, M. \A SCOR based approach for measuring a benchmarkable supply chain performance", Journal of Intelligent Manufac-turing, 24(1), pp. 113-132 (2013).
13. Beamon, B.M. \Measuring supply chain performance", International Journal of Operations & Production Management, 19(3), pp. 275-292 (1999).
14. Gunasekaran, A., Patel, C., and Tirtiroglu, E. \Per-formance measures and metrics in a supply chain environment", International Journal of Operations & Production Management, 21(1/2), pp. 71-87 (2001).
15. Cai, J., Liu, X., Xiao, Z., et al. \Improving supply chain performance management: A systematic ap-proach to analyzing iterative KPI accomplishment", Decision Support Systems, 46(2), pp. 512-521 (2009).
16. Elgazzar, S.H., Tipi, N.S., Hubbard, N.J., et al. \Linking supply chain processes' performance to a company's nancial strategic objectives", European Journal of Operational Research, 223(1), pp. 276-289 (2012)
17. Rooeinfar, R., Azimi, P., and Pourvaziri, H. \Multi-echelon supply chain network modelling and optimiza-tion via simulaoptimiza-tion and metaheuristic algorithms", Scientia Iranica, 23(1), pp. 330-347 (2016).
18. Agami, N., Saleh, M., and Rasmy, M. \An innovative fuzzy logic based approach for supply chain perfor-mance management", Systems Journal, IEEE, 8(2), pp. 336-342 (2014).
19. Blanco, V. \A mathematical programming approach to the computation of the omega invariant of a nu-merical semigroup", European Journal of Operational Research, 215(3), pp. 539-550 (2011).
20. Liu, S. and Papageorgiou, L.G. \Multiobjective opti-misation of production, distribution and capacity plan-ning of global supply chains in the process industry", Omega, 41(2), pp. 369-382 (2013).
21. Hamta, N., Fatemi Ghomi, S.M.T., Jolai, F., et al. \A hybrid PSO algorithm for a multi-objective as-sembly line balancing problem with exible operation
times, sequence-dependent setup times and learning ef-fect", International Journal of Production Economics, 141(1), pp. 99-111 (2013).
22. Kolahan, F. and Kayvanfar, V. \A heuristic algorithm approach for scheduling of multi-criteria unrelated parallel machines", World, Academy of Science, En-gineering and Technology, 59, p. 102 (2009).
23. Celik, N., Nageshwaraniyer, S.S., and Son, Y.-J. \Im-pact of information sharing in hierarchical decision-making framework in manufacturing supply chains", Journal of Intelligent Manufacturing, 23(4), pp. 1083-1101 (2012).
24. Aalaei, A. and Davoudpour, H. \Revised multi-choice goal programming for incorporated dynamic virtual cellular manufacturing into supply chain management: a case study", Engineering Applications of Articial Intelligence, 47, pp. 3-15 (2016).
25. Tamiz, M., Jones, D., and Romero, C. \Goal program-ming for decision-making: An overview of the current state-of-the-art", European Journal of Operational Re-search, 111(3), pp. 569-581 (1998).
26. Slomp, J., Chowdary, B.V., and Suresh, N.C. \De-sign of virtual manufacturing cells: a mathemati-cal programming approach", Robotics and Computer-Integrated Manufacturing, 21(3), pp. 273-288 (2005).
27. Mahdavi, I., Aalaei, A., Paydar, M.M., et al. \Multi-objective cell formation and production planning in dynamic virtual cellular manufacturing systems", In-ternational Journal of Production Research, 49(21), pp. 6517-6537 (2011).
28. Wong, J.-T. \DSS for 3PL provider selection in global supply chain: combining the multi-objective opti-mization model with experts' opinions", Journal of Intelligent Manufacturing, 23(3), pp. 599-614 (2012).
29. Xu, J., Jiang, B., Tang, L., et al., A Multi-Objective Coordinated Operation Model for Supply Chain with Uncertain Demand Based on Fuzzy Interval (2013).
30. Cai, Z., Wang, Y., Xiao, R., et al. \A multi-agent-driven closed-loop quality chain model and coordi-nated optimization", Communications in Information Science and Management Engineering, 3(11), p. 524 (2013).
31. Zhang, W. and Reimann, M. \Towards a multi-objective performance assessment and optimization model of a two-echelon supply chain using SCOR metrics", Central European Journal of Operations Re-search, 22(4), pp. 591-622 (2014).
32. Ramaa, A., Rangaswamy, T., and Subramanya, K. \A review of literature on performance measurement of supply chain network", in Emerging Trends in Engi-neering and Technology (ICETET), 2nd International Conference on, IEEE (2009).
33. Damodaran, A., Applied Corporate Finance: A User's Manual, John Wiley & Sons (2008).
34. Teran, H., Hernandez, J., Vizan, A., et al. \Perfor-mance measurement integrated information framework in e-Manufacturing", Enterprise Information Systems, 8(6), pp. 607-629 (2014).
35. Hearnshaw, E.J. and Wilson, M.M. \A complex net-work approach to supply chain netnet-work theory", Inter-national Journal of Operations & Production Manage-ment, 33(4), pp. 442-469 (2013).
36. Trkman, P., Budler, M., and Groznik, A. \A business model approach to supply chain management", Supply Chain Management: An International Journal, 20(6), pp. 587-602 (2015).
37. Arzu Akyuz, G. and Erman Erkan, T. \Supply chain performance measurement: a literature review", Inter-national Journal of Production Research, 48(17), pp. 5137-5155 (2010).
38. Wang, W.Y., Chan, H.K., and Pauleen, D.J. \Aligning business process reengineering in implementing global supply chain systems by the SCOR model", Inter-national Journal of Production Research, 48(19), pp. 5647-5669 (2010).
39. Li, L., Su, Q., and Chen, X. \Ensuring supply chain quality performance through applying the SCOR model", International Journal of Production Research, 49(1), pp. 33-57 (2011).
40. Francis, J., Supply Chain Management & Business Financial Performance (2009).
41. Sabri, E.H. and Beamon, B.M. \A multi-objective approach to simultaneous strategic and operational planning in supply chain design", Omega, 28(5), pp. 581-598 (2000).
42. Deb, K., Pratap, A., Agarwal, S., et al. \A fast and elitist multi objective genetic algorithm: NSGA-II" IEEE transactions on evolutionary computation, 6(2), pp. 182-197 (2002).
43. Montgomery, D.C., Design and Analysis of Experi-ments, 5th Ed. New York: Wiley (2000).
44. Cochran, W.G. and Cox, G.M., Experimental Designs, 2nd Ed. New York: Wiley (1992).
45. Taguchi, G., Introduction to Quality Engineering, White Plains. Asian Productivity, pp. 21-22 (1986).
46. Tsai, J.-T., Ho, W., Liu, T., et al. \Improved immune algorithm for global numerical optimization and job-shop scheduling problems", Applied Mathematics and Computation, 194(2), pp. 406-424 (2007).
47. Kayvanfar, V. and Zandieh, M. \The economic lot scheduling problem with deteriorating items and short-age: an imperialist competitive algorithm", The Inter-national Journal of Advanced Manufacturing Technol-ogy, 62(5-8), pp. 759-773 (2012).
48. Al-Aomar, R. \Incorporating robustness into genetic algorithm search of stochastic simulation outputs", Simulation Modelling Practice and Theory, 14(3), pp. 201-223 (2006).
49. Scott, J. \Fault tolerant design using single and multi-criteria genetic algorithms", Master's Thesis, Depart-ment of Aeronautics and Astronautics, Massachusetts Institute of Technology (1995).
50. Zitzler, E. and Thiele, L. \Multiobjective optimization using evolutionary algorithms - a comparative case study", in International Conference on Parallel Prob-lem Solving from Nature, Springer (1998).
51. Kayvanfar, V., Zandieh, M., and Mahdavi, I. \Eco-nomic lot scheduling problem with allowable shortage: a multi-objective approach", in Industrial Engineering and Engineering Management (IE &EM), 2011 IEEE 18Th International Conference on, IEEE (2011).
52. Lapide, L. \What about measuring supply chain performance", Achieving Supply Chain Excellence Through Technology, 2, pp. 287-297 (2000).
53. Peng Wong, W. and Yew Wong, K. \A review on benchmarking of supply chain performance measures", Benchmarking: An International Journal, 15(1), pp. 25-51 (2008).
Biographies
Mahdi Rezaei is a PhD degree candidate in the Department of Industrial Engineering at Amirkabir University of Technology, Tehran, Iran. His research interests are supply chain performance management, multiple criteria decision-making, and IoT.
Mohsen Akbarpour Shirazi received his PhD de-gree in Industrial Engineering from Amirkabir Uni-versity of Technology, Tehran, Iran, where he is now Assistant Professor. His areas of research include supply chain planning, transportation, and modeling. He is author and co-author of many technical papers in these elds.
Behrooz Karimi received his PhD degree in Indus-trial Engineering, in 2002, from Amirkabir University of Technology, Tehran, Iran, where he is now Professor. His areas of research include supply chain planning, scheduling, and simulation.