Market Sidedness: Insights into Motives
for Trade Initiation
Asani Sarkar
Robert A. Schwartz
Staff Report no. 292
July 2007
Revised October 2007
This paper presents preliminary findings and is being distributed to economists and other interested readers solely to stimulate discussion and elicit comments. The views expressed in the paper are those of the authors and are not necessarily reflective of views at the Federal Reserve Bank of New York or the Federal Reserve System. Any errors or omissions are the responsibility of the authors.
Federal Reserve Bank of New York Staff Reports
July 2007; revised October 2007 JEL classification: G10, G14, G34
Abstract
In this paper, we infer motives for trade initiation from market sidedness. We define trading as more two-sided (one-sided) if the correlation between the numbers of buyer-and seller-initiated trades increases (decreases), buyer-and assess changes in sidedness (relative to a control sample) around events that identify trade initiators. Consistent with
asymmetric information, trading is more one-sided prior to merger news. Consistent with belief heterogeneity, trading is more two-sided (1) before earnings and macro announcements with greater dispersions of analyst forecasts and (2) after earnings and macro news events with larger announcement surprises. A simultaneous equation system is used to examine the co-determinacy of sidedness, the bid-ask spread, volatility, the number of trades, and the order imbalance.
Key words: sidedness, divergent beliefs, trade initiation, trading motives, earnings news, macro news
Sarkar: Federal Reserve Bank of New York (e-mail: asani.sarkar@ny.frb.org). Schwartz: Zicklin School of Business, Baruch College (e-mail: robert_schwartz@baruch.cuny.edu). The authors thank the editor (Rob Stambaugh) and an anonymous referee for comments. They also thank Markus Brunnermeier, Thierry Foucault, Michael Goldstein, Joel Hasbrouck, Milt Harris, Terry Hendershott, Murali Jagannathan, Charles Jones, Eugene Kandel, Kenneth Kavajecz, Bruce Lehmann, Albert Menkveld, Maureen O’Hara, Lasse Pederson, Ioanid Rosu, Krystin Ryqvist, Gideon Saar, Duane Seppi, George Sofianos, Shane Underwood, Jiang Wang, James Weston, Thomasz Wisniewski, and Avner Wolf. In addition, they thank seminar participants at the 2006 American Finance Association meetings, the October 2005 NBER Market Microstructure conference, the Norges Bank conference “The Microstructure of Equity and Currency Markets,” and the Tenth Symposium on Finance, Banking, and Insurance at the Universität Karlsruhe as well as Baruch College, the University of Delaware, Rice University, Rutgers University, SUNY Binghamton, and the Federal Reserve Bank of New York for helpful comments. The views expressed in this paper are those of the authors and do not necessarily reflect the position of the Federal Reserve Bank of New York or the Federal Reserve System.
A trade is initiated in a continuous limit order book or quote driven market whenever a relatively impatient participant submits a market order that meets or crosses a price that has previously been posted by a more patient participant (a limit order trader or dealer). The trade initiator is demanding immediacy and certainty of execution, and is forgoing the possibility of achieving a better price. The literature suggests that the impatience which underlies trade initiation is due to the short-lived nature of any information advantage. A trade initiator may also be experiencing a shock to his or her impatience (e.g., as the end of a trading day approaches), or be responding to a temporary decrease in the price of immediacy (as occurs, for instance, when the limit order book thickens). In this paper, we analyze buyer-initiated and seller-initiated trades in brief time intervals (five minutes) around different information events (e.g., earnings reports) and during the opening and closing minutes of days without news. In so doing, we are able to draw inferences on the motives for trade initiation, the objective of this paper.
Empirical market microstructure research has sought to identify trade initiators from the interaction between price formation and indicators of trading activity, including the number and sign of trades, trade size, and the duration between trades. A large literature focuses on
identifying trading driven by information asymmetries. Major efforts include Hasbrouck (1991) who shows that market makers, by observing trade attributes such as sign and size, can infer information from the trade sequence. Easley, Kiefer and O’Hara (1996, 1997a, 1997b), based on an asymmetric information model, estimate the arrival rates of informed and uninformed traders using data on the daily numbers of buyer-initiated and seller-initiated trades, and no-trade outcomes. Dufour and Engle (2000) find that trades cluster together in time as insiders trade quickly to preempt information leakage. More recently, attention has also turned to the demand for immediacy by liquidity traders. In particular, Tkatch and Kandel (2006) present evidence
that traders offer price concessions to obtain more immediate executions, and that such behavior has a significant effect on high frequency market dynamics.
We also focus on identifying trade initiators. Our objective is to disentangle evidence of trade initiation triggered by asymmetric information (i.e., some investors are better informed than others), and by differential information or beliefs (i.e., investors have different information or interpret the same information differently). To this end, we introduce a measure of market sidedness that we define as the correlation between the numbers of buyer-initiated trades and seller-initiated trades in brief time intervals. An increase (decrease) in the correlation indicates a more two-sided (one-sided) market condition. We analyze changes in sidedness by contrasting the correlation observed in a specific information environment (e.g., before earnings or macro announcements) with the correlation observed in non-news days.
Based on a discussion of models of trade initiation in Section I, we argue that trading motivated by asymmetric information generates more one-sided markets, whereas trading motivated by differential information and/or beliefs leads to more two-sided markets. Using a matched sample of 41 New York Stock Exchange (NYSE) and 41 Nasdaq stocks, our analysis of five-minute trading intervals indicates that trade initiation is attributable to each of the above noted factors. We present evidence of more one-sided trading prior to merger news; one might infer that at least some of these same-side trades are motivated by asymmetric information. Trading is more two-sided before earnings and macro news announcements when the dispersion of analyst forecasts is large, which is consistent with trade initiations attributable to differences in opinions. Finally, more two-sided markets are observed after news releases, especially when the news surprises are large, consistent with trades being driven by investors who acquire diverse information in order to better interpret the news (as in Kim and Verrecchia (1994)).
Research on earnings announcements show that trading is stimulated by differences in opinions (Kandel and Pearson (1995); Bamber, Barron and Stober (1999); Diether, Malloy and Scherbina (2002); Sadka and Scherbina (2007)) and differential information acquisition (Krinsky and Lee (1996); Barron, Byard and Kim (2002)). Our findings on sidedness underscore the importance of these motives for a variety of news events (earnings, macro and merger news).
To obtain further insights into trade initiators, we examine whether sidedness determines market dynamics, by sorting stocks into two groups based on their “excess” sidedness (relative to the average sidedness in the no-news sample). Before news, we find higher volatility and more trades, and lower order imbalance, for more two-sided stocks and also for news with greater analyst forecast dispersions. A similar pattern exists after news releases for more two-sided stocks and also for larger news surprises. These results show that greater differences in opinions or information are associated with increased volatility and trading, consistent with Grundy and McNichols (1990), Harris and Raviv (1993), Shalen (1993), Kandel and Pearson (1995), He and Wang (1995), Hong and Stein (2003), and Banerjee and Kremer (2005).
We employ a simultaneous equation system to study the endogeneity of sidedness (e.g., changes in sidedness may result from a temporary decrease in the cost of immediacy). We find that sidedness, effective spreads, order arrivals, and volatility are co-determined around news events for Nasdaq stocks as well as for the no-news sample. There is also robust evidence of a significant association between sidedness, forecast dispersions and news surprises.
In addition to news-related changes in sidedness, an exogenous increase in the proportion of impatient buyers and sellers may also trigger more two-sided trading. We observe high immediacy demand for Nasdaq stocks compared to NYSE stocks in the first 5 minutes on days without news. Since, in our sample period, NYSE had an opening call but Nasdaq did not, the
result is consistent with a reduction in impatience following the call auction (Bosetti, Kandel and Rindi (2006)). We further observe more two-sided trading for Nasdaq stocks in the last 5
minutes on days without news; the more two-sided Nasdaq stocks have greater volatility and trades, and lower spreads. These results are consistent with the theoretical predictions of Foucault, Kadan and Kandel (2005) and Rosu (2006), and complement evidence by Tkatch and Kandel (2006) that liquidity traders demand immediacy in the Tel Aviv Stock Exchange.
Sidedness is related to order imbalance: we find that more two-sided markets are
generally, but not always, associated with lower imbalance.1 However, forecast dispersions and news surprises are not significantly related to imbalance, suggesting that belief heterogeneity is reflected in sidedness rather than in imbalance. Since sidedness and order imbalance are informative of each other and of market dynamics, we conclude that sidedness and imbalance incorporate different (and complementary) information.
As robustness tests, we delete executions inside the quotes and at mid-quotes (where errors in the Lee and Ready (1991) algorithm for classifying buyer and seller initiated trades are most likely to occur). Our findings continue to hold and, in some cases, are even stronger. Next, we examine the absolute volume imbalance as a measure of sidedness in order to better capture the effect of large institutional trades. We find that institutions when trading in NYSE stocks appear to be more impatient in the closing minutes compared to retail traders.
We contribute to the literature by introducing a new liquidity measure (i.e. sidedness) that allows us to derive sharper predictions about market behavior. The sidedness measure enables us to better distinguish between alternative trading motives. For example, trading motivated either by asymmetric information or by heterogeneous beliefs gives rise to high volatility, but the former results in one-sided markets whereas the latter gives rise to two-sided markets. Indeed,
the results indicate that belief heterogeneity is mainly reflected in our sidedness measure, rather than in alternative measures such as the order or volume imbalance. Hence, sidedness may be a useful measure when analyst dispersion data is either unavailable or uninformative.
Accounting for sidedness is important for studying the impact of news since forecast dispersions and news surprises affect volatility and spreads directly as well as indirectly via their effects on sidedness. Moreover, sidedness may have predictive power for market dynamics (more two-sided trading appears to predict higher volatility and trades, and lower spreads).
The sidedness measure also sheds light on belief convergence. The literature on earnings announcements has examined how quickly the mispricing of stocks with high analyst
disagreements is corrected (e.g. Sadka and Scherbina (2007)). We show that, when the sidedness measure diverges, post-news differences in liquidity, volatility and trading activity between small and large pre-news forecast dispersions are generally significant. Conversely, when sidedness converges, post-news differences in liquidity, volatility and trading activity are not significant for small and large pre-news dispersions. This suggests that convergence or divergence in sidedness is indicative of convergence or divergence in beliefs.
The paper is organized as follows. In Section I, we discuss models of trade initiation, their predictions for sidedness and market dynamics, and events likely to identify trade initiators. In Section II, we describe our data. In Section III, we present descriptive statistics and in Section IV, we estimate sidedness around news events. In section V, we examine market dynamics for stocks sorted by sidedness. In Section VI, we present results from the simultaneous equation regressions. In Section VII, we study the opening and closing minutes of trading on days without news. In Section VIII, we conduct robustness checks. We conclude in Section IX. All results that are not reported in this paper are available from the authors on request.
I. Sidedness, Trade Initiation and Market Dynamics: Predictions and Identifying Events
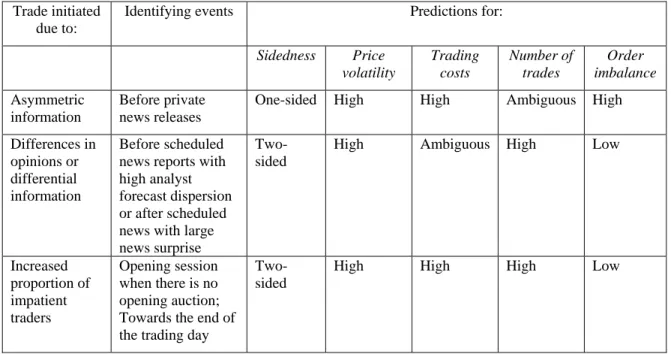
Agents who submit orders that trigger trades are demanding immediacy of execution at the expense of price improvement.2 The literature suggests that such behavior results from temporarily high impatience due to the short-lived nature of any information advantage, or from an aggregate shock to traders' impatience. When information is involved, the sidedness of markets depends on whether it is asymmetric (i.e., some information is superior to others), or differential (i.e., either the information is different or news is interpreted differently). We consider each of these effects separately in Table I. The first column of the table identifies the trading motive, the second column lists scenarios likely to be associated with these motives, and the remaining columns summarize the implications of the motives for sidedness and four market quality variables – price volatility, trading costs, number of trades, and order imbalance.
INSERT TABLE I HERE
A one-sided market is likely to occur when some investors have superior private information (Wang (1994); Llorente et al. (2002)).3,4 Volatility increases under one-sided conditions because less-informed investors demand a larger premium to trade against better-informed participants and, consequently, prices become more responsive to supply shocks (Wang (1993, 1994)). Greater volatility and adverse selection imply that trading costs are also higher with asymmetric information. A greater order imbalance is apt to ensue as trades occur predominantly on one side of the market while the effect on volume is ambiguous.5
Information-motivated trading can be triggered on both sides of the market when
investors observe different information signals (He and Wang (1995)) or interpret an ambiguous signal differently (Harris and Raviv (1993); Kandel and Pearson (1995)).6 Dispersed beliefs or
information are likely to be associated with higher volatility and a larger number of trades. For example, Grundy and McNichols (1990) and Shalen (1993) show that dispersed opinions
magnify the effect of noisy information on price changes. However, the effect on trading costs is unclear. On the one hand, greater uncertainty about a stock’s value decreases liquidity (He and Wang (1995)). On the other hand, two-sidedness imply that dealers and limit order traders are at lower risk of incurring unbalanced inventory or portfolio positions, which increases liquidity.
A shock to traders' impatience may also increase the demand for immediacy (Foucault, Kadan and Kandel (2005); and Rosu (2006)).7 Foucault, Kadan and Kandel (2005) consider an increase in the proportion, p, of impatient traders. Abstracting from informational effects, they show that the bid-ask spread and trading activity increases. There is more trading because the probability that a trader will submit a market order increases with p. Due to the high arrival rate of market orders, limit order traders post less aggressive limit orders, and spreads widen (as also considered in Cohen et al. (1981)). Volatility is also likely to be higher when traders demand more liquidity. We expect that impatient traders will commonly place orders on both sides of the market, and so two-sidedness is likely to increase in p.
The second column in Table I lists scenarios likely to identify trading motives. One-sided markets driven by asymmetric information are likely prior to private news events (e.g. merger news) if the information leaks out. Two-sided markets are likely before scheduled news releases (e. g. earnings reports) with high analyst forecast dispersions which may be viewed as proxies for differences of opinions among investors (Diether, Malloy and Scherbina (2002)). Two-sided markets due to differential information may occur after large news surprises as investors acquire diverse information to interpret the events (Kim and Verrecchia (1994)).
We further identify immediacy-based trading around liquidity events: the opening and closing minutes of days without news. In our sample period, Nasdaq did not have an opening auction whereas the NYSE did. Since the proportion of impatient traders is likely to be smaller after an auction (Bosetti, Kandel and Rindi (2006)), differences in sidedness during the opening sessions of the NYSE and Nasdaq markets may indicate differences in the demand for
immediacy in the two markets. Temporary increases in the demand for immediacy may also occur towards the end of the trading day (Cushing and Madhavan (2000); Tkatch and Kandel (2006)); two-sided markets will result if impatient participants arrive as both buyers and sellers.
Each of the scenarios mentioned above is likely to prevail in reality, depending on the source and nature of the shock to immediacy. We estimate patterns of sidedness, volatility, trading costs, the number of trades and order imbalance for each scenario. Our objective is to infer the existence of each of the underlying trading motives from these patterns.
II. Data
We use time-stamped trade and quote data from the Transactions and Quotes (TAQ) Database of the NYSE, which records the price and quantity of trades, and dealer quotes. The data are from January 2, 2003 to May 28, 2003, for a matched sample of 41 NYSE stocks and 41 Nasdaq stocks.8 On January 2, 2003, market capitalization and the closing price averaged $4.7 billion and $21.56 for NYSE stocks, respectively, and $4.4 billion and $21.35 for Nasdaq stocks, respectively (the two markets have similar values as the samples are matched according to these variables). To purge the data of potential errors, we delete trades or quotes with:
1. Zero or missing trade price.
2. Quotes that are missing, negative or unusually small relative to surrounding quotes.9 3. Bid (ask) quotes that change from the previous bid (ask) quote by more than $10.
4. The quoted bid-ask spread is negative.
5. The proportional quoted bid-ask spread or effective bid-ask spread is in the upper 0.5 percentile of its distribution by stock and time interval.
6. The quoted bid or ask size is negative.
7. Trade or quote prices that are outside regular trading hours.
These filters eliminated approximately 3% of all recorded prices and quotes. After elimination, the NYSE data include 4,877,678 trades and the Nasdaq data include 10,860,576 trades. The trading day is divided into 5-minute intervals. The number of 5-minute intervals in the final sample is 318,704 intervals for NYSE stocks and 318,468 intervals for Nasdaq stocks.
We use the Lee and Ready (1991) algorithm to identify transactions as either buy- triggered or sell-triggered. If the trade price is closer to the most recent ask (bid) price in the same stock, it is a buyer (seller) initiated trade. For prices equal to the quote mid-point, trades that take place on an up tick are buys, and trades that take place on a downtick are sells.10 We examine the effects of trade classification errors on our results in Section VIII.
To identify the source of a change in the demand for, or the cost of, immediacy, we examine trading around earnings reports, macroeconomic releases scheduled for 8:30 AM, and corporate restructuring (CR) news. (We study liquidity events in Section VII). Quarterly earnings report dates, actual earnings per share (EPS), and analysts’ most recent forecasts of quarterly EPS are taken from the I/B/E/S database. Data for announcements of Employees on Nonfarm Payroll, Core CPI and Producer Price Index are from the Haver database. Prior studies (e.g. Fleming and Remolona (1999)) show that these three macro releases (about a quarter of all 8:30 AM announcements) have the most significant market impact. CR news days are identified
by searching major publications for news related to M&A, share buybacks, divestitures, and joint ventures. Prior research shows significant stock price movements around these corporate events.
Trading motives are likely to be different before and after news releases. We create a
“Before” sample that consists of the two days before earnings, macro, or CR news. For earnings
and macro news, we further divide the “Before” sample by the standard deviation (SD) of analyst forecasts, a measure of disagreement. In order to compare the SD for different earnings (macro) reports, we divide the SD by the absolute value of the mean (median) forecast.11 The upper 50 percentile of standard deviations are taken to be large dispersions; the remaining forecasts are
small dispersions. Focusing on large versus small dispersions is in accord with Banerjee and
Kremer (2005), who show that observed volume patterns are best explained by the existence of infrequent major disagreements among agents.
We also create an “After” sample consisting of the day of the earnings, macro, or CR news, and the following day. For earnings and macro news, we further divide the “After” sample according to whether the news surprise is large or small. Foster and Viswanathan (1993) show that volatility and trading volume depend on the news surprise. To compare earnings surprises across stocks, we scale it by the SD of surprises for the stock. Similarly, to compare surprises across different macro announcement types, we follow Balduzzi, Elton, and Green (2001) and scale it by the SD of surprises for the announcement type. Thus, the surprise Sk,t for an
announcement type k or for an earnings report for stock k on day t is:
, , , k t k t k t k M R S σ − = (1)
where Rk,t is the actual EPS or the first-reported macro release, Mk,t is the median analyst
forecast, and σk is the SD of surprises for stock k or announcement type k. Large surprises are in
The three news events differ by how much they can be anticipated, and also whether they relate to private or public variables. Macro announcements are always scheduled for release on specific days and times and relate to public information such as inflation. Earnings report dates are generally, but not always, predictable whereas CR news is mostly unanticipated; moreover, earnings and CR news are about individual firms. We expect that trading based on asymmetric information is likely to be least before macro news and most before CR news. We further expect trading based on heterogeneous beliefs around earnings and macro news when analyst forecast dispersions or news surprises are high.
We study only the first 15 minutes of days around news events to capture the immediate impact of the news. The impact of macro releases lasts 30 minutes or less (Green (2004)). Since major news reports are often released during the overnight period, the first 15 minutes are likely to capture the immediate effects of earnings and CR news as well. The short term period also serves to filter out trading unrelated to news (e.g. follow-on trading by noise traders).
We compare sidedness around news events with a control sample (called no-news days) constructed to exclude the effect of news to the extent possible. Specifically, we remove the 2 days before and the 2 days after earnings, macro and CR news days. To further mitigate any news impacts, we also exclude high return days which we define as the 30% of days with the highest absolute value of a stock’s close-to-close excess returns.12 The S&P 500 (Russell 2000) returns are used to compute the excess returns for the NYSE (Nasdaq) stocks.
III. Descriptive Statistics around News Events
In this section we describe patterns of volatility, liquidity, and trading activity on days surrounding news events. Referring to Table I, if trades are based on asymmetric information, we expect high levels of trading costs, volatility and order imbalance. If trading is motivated by
differential information or beliefs, we continue to expect high volatility but not necessarily high trading costs; further, trading activity should be high and the order imbalance relatively low. We employ the following measures for the analysis. Volatility is HILO minus 1, where HILO is the ratio of the maximum to the minimum price in a period. Trading cost is PEBAS, the proportional effective half-spread, defined as Q(P-M)/M, where M is the quote mid-point, P is the trade price, and Q is +1(-1) for buyer (seller) initiated trades. The absolute order imbalance, AIMB, is the absolute value of (BUY–SELL)/NTR, where BUY (SELL) is the number of buyer (seller) initiated trades and NTR is the total number of trades.
INSERT TABLE II HERE
In Table II, we present descriptive statistics for the first 15 minutes of no-news days and around news events. Results of no-news days are repeated for each of the three news events for convenience. The reported values for HILO, PEBAS, and AIMB are each multiplied by 100. We compare the mean and median values (using the Wilcoxon z statistic) between days with and without news. The entries ** and * denote differences that are significant at, respectively, the 1% and 5% levels or less.
Before earnings reports, the various measures are not statistically different for news and no-news days in either market. Following earnings reports, volatility, NTR and the median bid-ask spread are all higher while, in both markets, the absolute imbalance is lower. Prior to macro announcements, volatility is higher for Nasdaq stocks and the bid-ask spread is higher for NYSE stocks compared to non-news days. Following macro announcements, volatility and the spread are higher in both markets, in line with previous research. Further, NTR increases for Nasdaq stocks. Before CR news, the median bid-ask spread is higher and NTR lower for NYSE stocks, while the spread is lower and NTR is higher for Nasdaq stocks (compared to non-news days).
We observe the same pattern after CR news: the median spread increases and NTR falls
compared to no-news days for the NYSE stocks, while the reverse is true for the Nasdaq stocks. In summary, volatility, the bid-ask spread and the number of trades are generally higher after news events compared to no-news days, whereas volatility, liquidity and trading activity are weakly affected or unaffected prior to news events except for CR news. Further, order
imbalance is lower after earnings news, suggesting more two-sided trading at this time. In the next section, we examine the patterns of sidedness around news events.
IV. The Sidedness of Markets around News Events
We expect trade initiations to be on one side of the market if they are motivated by asymmetric information. If trading is based on differential information or beliefs, we expect trade triggering orders to arrive on both sides of the market. Presumably each of the various motives drives trading to some extent, and we seek evidence of each in the transactions data. To identify news-related trading motives, we estimate sidedness for the first 15 minutes of days around news events. Prior to a scheduled news release, trading may be motivated by differences of opinions regarding the expected content of the news. Thus we compare sidedness before earnings and macro news for large versus small dispersions of analyst forecasts. We expect news associated with a large dispersion to result in markets that are more two-sided. Following a news release, sidedness is likely to be determined by the magnitude of any news surprise and so, after earnings and macro news, we compare reports with large versus small surprises.
We estimate sidedness by the correlation between ZBUY and ZSELL, as follows:
) ( ) ( BUY SD BUY Mean BUY ZBUY = − (2) ) ( ) ( SELL SD SELL Mean SELL ZSELL= − (3)
where BUY (SELL) is the number of buyer (seller) initiated trades in an interval, and Mean and SD are the sample mean and standard deviation. The trading frequency is standardized as it varies by stock. If the correlation between ZBUY and ZSELL is higher (lower) around news events, compared to the no-news days, then the market is said to be more two-sided (one-sided).
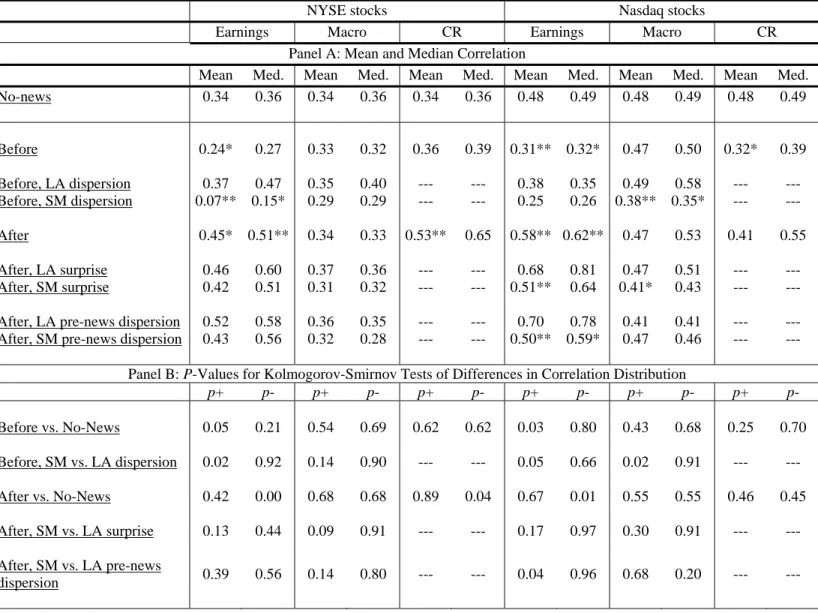
INSERT TABLE III HERE
The results are summarized in the two panels of Table III for the NYSE and Nasdaq stocks separately. In Panel A, we report the mean and median correlation for the no-news days, and for days before and after earnings reports, macro announcements and CR news. The entries ** (*) indicate that the mean and median correlation is significantly different at the 1% (5%) level or less for the before or after sample versus the no-news sample; or for small (SM) versus large (LA) dispersions or surprises. We compare the mean correlations using Fisher’s z-statistic, and the median correlations using the Wilcoxon z statistic.
Because trading in different stocks is likely to be based on a variety of motives (leading to varying degrees of sidedness across stocks), we compare the cross-sectional distributions of the correlation (Panel B of Table III). To do so, we report the p-values (p+ and p-) for the Kolmogorov-Smirnov (KS) one-sided test statistics D+ and D-, respectively:
(
( ) ( ))
max 1 j 2 j j F x F x D+= − , where j=1,2,...,n. (4)(
( ) ( ))
max 2 j 1 j j F x F x D−= − , where j=1,2,...,n. (5)xj is the correlation for the j-th stock, n is the number of stocks, and F1 (F2) is the control (test)
sample distribution. The variables D+ and D- show the maximum vertical distances between the distributions. Thus, a low value for p+ (p-) indicates that the correlation distribution in the test sample lies significantly below (above) the distribution in the control sample, which indicates relatively greater one-sidedness (two-sidedness) of the test sample compared to the control
sample.13 The control sample is the no-news or large (LA) dispersions or surprises; the test sample is the before or after sample, or the small (SM) dispersion or surprises.
Results from Table III are discussed in Section IVA for earnings reports, in Section IVB for macro news in and in Section IVC for CR news. We summarize the results in Section IVD.
A. Sidedness around Earnings Reports
INSERT FIGURE 1 HERE
Trading is more one-sided prior to earnings news releases. In both markets, the mean correlation is significantly lower for days before earnings reports compared to the no-news sample. Figure 1 plots the correlations for different stocks by percentiles before earnings news and the no-news samples. The top panel shows that the correlation distribution for days before earnings reports generally lies below that for the no-news days in both markets. Consistent with the figures, the KS statistics in Panel B reveal that p+ is 0.05 for the NYSE stocks and 0.03 for the Nasdaq stocks, whereas p- exceeds 0.20 in both markets, indicating that the correlation distribution before earnings news is significantly more one-sided but not significantly more two-sided than that before no-news days.
Next, we compare reports with large versus small forecast dispersions. For the NYSE stocks, the median correlation is 32% lower (0.15 versus 0.47) and the mean correlation is 30% lower when the dispersion is small than when it is large, and these differences are statistically significant. The median and mean correlations are also higher for larger analyst dispersions for the Nasdaq stocks, but not with statistical significance. In the bottom panel of Figure 1, we observe that the distribution for large dispersions generally lies above that for small dispersions; and the KS statistics in Panel B show that the difference is significant for both markets. For example, p+ is 0.05for the Nasdaq stocks, indicating that the correlation distribution is
significantly more one-sided when the dispersion is smaller. These results show that trading is relatively more two-sided before earnings reports with larger differences of opinions.
INSERT FIGURE 2 HERE
Trading for both NYSE and Nasdaq stocks is more two-sided following earnings reports. This is indicated for the “After” sample by the significantly higher median and mean
correlations. The top panel of Figure 2 illustrates the relative two-sidedness of the correlation distribution for the “After” sample compared to the no-news sample, and the KS statistics show that the difference is significant. Sidedness is not significantly different for NYSE stocks after conditioning on the size of the earnings surprise. But, for the Nasdaq stocks, the mean
correlation is 17% smaller for small compared to large surprises, indicating more two-sided trading following large surprises. These results are consistent with Kim and Verrecchia (1994) who show that more diverse information is acquired when the forecast is less precise (i.e. the surprise is larger). The greater diversity of information leads to more two-sided trading.14
We examine whether investors’ divergent beliefs before earnings news (as indicated by the sidedness measure) converge after the news is released. Brown and Han (1992) find evidence of belief convergence after earnings reports, but Morse, Stephan and Stice (1991) do not. Belief convergence occurs if sidedness after the releases is similar for large and small pre-news dispersions. Thus, we estimate sidedness in the “After” sample after conditioning on the pre-news dispersion. The results, shown in the bottom row of Panel A, indicate that beliefs do not converge for the Nasdaq stocks. Specifically, the median correlation is 19% lower (0.59 versus 0.78), the mean correlation is 20% lower, and the correlation distribution is more one-sided, when the pre-news dispersion is small than when it is large. This result is consistent with Diether, Malloy and Scherbina (2002) who show that stocks with high analyst disagreements
continue to under-perform for six months on average. For NYSE stocks, differences in sidedness for large and small pre-news dispersions are not statistically significant after news releases.15
B. Sidedness around Macroeconomic Announcements
INSERT FIGURE 3 HERE
Turning to macro news, we find that sidedness is not significantly different before macro reports relative to the no-news sample. As with earnings reports, two-sided trading prior to macro news appears to be driven by divergent opinions. As seen in the bottom panel of Figure 3, the correlation distributions for large dispersions of opinions generally lie above those for small dispersions in both markets, and the difference is significant for Nasdaq stocks (as shown by the KS test statistics). Further, the median and mean correlations are significantly higher after large dispersions for the Nasdaq stocks. For the NYSE stocks, the mean correlation is lower by 6% for smaller dispersions although the difference is not significant. Our results complement that of Beber and Brandt (2006) who use prices of economic derivatives to measure macro uncertainty and find that it is a significant determinant of trader behavior in the financial markets.
INSERT FIGURE 4 HERE
After macro announcements, sidedness is not significantly different from the no-news days. There is weak evidence that trading is more two-sided after large surprises. The mean correlation is significantly lower for small compared to large surprises for Nasdaq stocks. The correlation distribution (as illustrated in the middle panel of Figure 4) appears more two-sided after large surprises, although the difference is not statistically significant. Finally, the bottom row of Panel A shows that belief convergence occurs in both markets, as post-announcement sidedness is statistically similar for small and large dispersions.
C. Sidedness around CR News
INSERT FIGURE 5 HERE
CR news days, unlike earnings and macro reports, are not predictable. Thus, insiders may have private information regarding both the time and the content of the news. Indeed, we find that trading is more one-sided prior to CR news for Nasdaq stocks; the mean correlation is 18% lower before CR news than in no-news days, and the difference is significant at the 5% level. After CR news, trading is more two-sided for the NYSE stocks. The mean correlation is greater than in the no-news sample, and the difference is statistically significant; moreover, the KS statistics indicate significantly more two-sidedness but not significantly more one-sidedness after CR news compared to the no-news sample (also see Figure 5).
D. Overview and Summary
More one-sided trading is observed before earnings or CR news compared to the no-news sample, consistent with pre-news trading motivated by asymmetric information. In contrast, sidedness is unaffected before public macro news. Comparing earnings and macro news with small and large analyst forecast dispersions, we find relatively more two-sided markets prior to news with larger dispersions, which is consistent with trading being driven by differences in opinions. Trading is also generally two-sided following news reports (in particular after large news surprises), consistent with traders expending resources to understand the import of publicly disclosed financial news (Fishman and Hagerty (1989)). The divergent pre-news beliefs of investors are more likely to converge after macro news than after earnings news.
V. Sidedness as a Determinant of Liquidity, Volatility, and Trading Activity The particular association that volatility, liquidity and trading activity has with sidedness can provide further insights into the underlying motives for trading. For example, high volatility and trading costs may be evidence either of asymmetric information or of dispersed opinions. However, the former results in one-sided markets which accentuate trading costs, while the latter leads to two-sided markets that can mitigate trading costs. Therefore, asymmetric information should lead to increased trading costs for stocks with more one-sided trading. In contrast, dispersed opinions should lead to higher volatility, but lower or similar trading costs, for stocks with more two-sided trading. Accordingly, we sort stocks by the degree of “excess” sidedness, and then consider the relationship with volatility, liquidity, and trading activity. The
methodology for estimating “excess” sidedness is described in Section VA. Results for earnings reports are given in Section VB, for macro announcements in Section VC, and for CR news in Section VD. A discussion and overview of the results is provided in Section VE.
A. Methodology
We determine whether a stock exhibits “excess” CORR, relative to a benchmark level. Let CORRiS be the correlation for stock i in sample S, where S=T (the test sample) or S=N (the
control sample). Let the benchmark correlation be CORRN, the median over all stocks of
CORRiN. Then, a stock i in sample S is moretwo-sided if:
CORRiS≥CORRN (6)
Alternatively, a stock in sample S is less two-sided if:
CORRiS < CORRN (7)
After sorting stocks into two groups L (less two-sided) and M (more two-sided), we estimate the mean and median differences in HILO, PEBAS, NTR and AIMB between them. These statistics, reported in Table IV, are indicated by the label “L-M” (less minus more two-sided). Let Ni be the number of 5-minute intervals in group i=L, M. The table reports
DIFN=100(NL- NH)/(NL+NH), which indicates the preponderance of trading intervals that are less
two-sided, relative to the no-news days. The table also shows differences in the various statistics between reports with small versus large forecast dispersions (labeled “SM-LA dis”) or with small versus large news surprises (labeled “SM-LA sur”). In these cases, DIFN is the relative
incidence of trading intervals with smaller dispersions or surprises. A positive number indicates a higher value for less two-sided trading intervals (or for smaller dispersions/surprises).
B. Results for Days around Earnings Reports
Table IV, Panel A presents the results for earnings reports. In the columns labeled “No news: L-M,” we show results for the control (i.e. no-news) sample. In both markets, NTR is higher and AIMB is lower for more two-sided stocks; PEBAS is higher for more one-sided stocks, which may reflect the impact of inventory imbalance on liquidity suppliers. The result for HILO is inconsistent: it is greater (lower) for the more two-sided Nasdaq (NYSE) stocks.16
For days before earnings reports (“Before: L-M”), we see that DIFN is positive (11% for NYSE and 36% for Nasdaq), showing a higher incidence of more one-sided intervals before earnings news compared to no-news days, as in our earlier results. Also, NTR is significantly greater for the more two-sided stocks. These stocks also have higher volatility, but statistically similar or lower spreads, as well as lower imbalance. These results hold for both markets.
We now compare market dynamics for earnings reports with small versus large
HILO and NTR, and lower AIMB, but similar PEBAS, vis-à-vis reports with small dispersions. These results hold in both markets. Thus, market dynamics are similar for more two-sided stocks and for larger forecast dispersions, supporting the view that differences of opinion drive two-sided trading prior to earnings reports.
For both NYSE and Nasdaq stocks, DIFN is substantially negative for days after earnings reports (“After: L-M”), consistent with our earlier findings that predominantly two-sided trading follows earnings news. In the Nasdaq sample, the more two-sided stocks have greater NTR and volatility along with lower spreads and imbalance. For the NYSE stocks, market dynamics for the more two-sided stocks are statistically similar to those for the less two-sided stocks.
Conditioning on the size of the surprises (“Aft: SM- LA sur”), we find that NTR is higher, while PEBAS and AIMB are lower for Nasdaq stocks when the surprise is larger. The similarity of market dynamics for more two-sided Nasdaq stocks and for larger surprises supports the idea that two-sided trading after earnings news with large surprises is driven by differentially
informed traders. While more informative trading leads to higher bid-ask spreads after earnings news for all stocks, spreads increase relatively less for more two-sided stocks. For the NYSE stocks, differences in market quality between small and large surprises are not significant, just as differences in sidedness between small and large surprises are also not significant. These results, therefore, suggest that the sidedness measure may predict market quality following news events.
We have seen evidence of continued belief divergence after earnings news, as indicated by the sidedness measure. Does belief divergence also result in divergence in market dynamics? We examine market dynamics after news for small and large pre-news dispersions. The results, shown in the columns labeled “Aft: SM-LA dis,” indicate that, following earnings news releases, HILO and NTR remain significantly higher in both markets, and that the median PEBAS is
significantly greater in the NYSE market for reports with larger pre-news dispersions. Thus, differences in sidedness and market dynamics between reports with large and small pre-news dispersions persist following earnings news releases, consistent with belief divergence.
C. Results for Days around Macro Announcements
In both markets, for days before macro announcements (Table IV, Panel B), the more two-sided stocks are characterized by greater volatility and number of trades, and lower spreads and imbalances, as shown in the columns labeled “Before: L-M.” After sorting the macro reports by analyst forecast dispersions (“Bef: SM- LA dis”), we find for Nasdaq stocks that volatility is higher when dispersions are small but the other statistics do not differ significantly between the small and large dispersions. Thus, while sidedness is related to market dynamics before macro news, forecast dispersions are (mostly) not. This may be because the sidedness measure is stock-specific whereas, by construction, the macro dispersion measure pertains to all stocks having either one-sided or two-sided markets on a particular macro news day.17 If stocks have different sensitivities to macro risk, then the stock-specific sidedness measure is expected to be more informative than the market wide dispersion measure.
Following macro announcements (“After: L-M”), volatility and NTR are higher, and spreads and imbalance are lower for more two-sided stocks in both markets. In the columns labeled “Aft: SM- LA sur” we observe few statistically significant differences in volatility, liquidity or trades for large and small surprises. As with the macro dispersion measure, the macro surprise measure may not be highly informative of stock-level dynamics because it pertains to all stocks on days with large surprises.
Our evidence, as based on sidedness, has thus far pointed to belief convergence after macro news. In the columns labeled “Aft: SM-LA dis,” we see that the market dynamics for
NYSE and Nasdaq stocks are (with one exception) statistically similar after macro news for reports that are sorted based on the size of pre-news forecast dispersions. Thus, both sidedness and market dynamics converge following macro news, consistent with convergence in beliefs.
D. Results for Days around CR News
Trading prior to CR news is strongly one-sided for the NYSE stocks, as shown by the large and positive value of DIFN (51%) in the column labeled “Before: L-M.” For the Nasdaq sample, the more one-sided stocks have higher spreads and imbalance, but are less active and have lower volatility. There is a greater incidence of two-sided intervals following CR news, as is shown by the large, negative values of DIFN (-81% for NYSE and -40% for Nasdaq). The more two-sided stocks have greater volatility and more trades in both markets.
E. Overview and Discussion
Combining sidedness and market dynamics sheds further light on trade initiations. We find higher volatility and number of trades, lower order imbalance, and mostly similar (in a statistical sense) effective spreads, before earnings news when trading is more two-sided and when analyst forecast dispersions are large.18 These results are consistent with differences of opinions driving trading before news releases. We also find that two-sided trading after news with a large surprise element appears to be driven by differentially informed traders. As
corroborating evidence, greater volatility and trading, along with lower order imbalance, prevail after earnings news when trading is more two-sided and when the surprises are large. These results suggest (but do not directly show) that dispersions and surprises may impact the market via sidedness; the simultaneous equations analysis in the next section will address this issue.
When pre-news beliefs converge (diverge) after news releases, as indicated by
convergence (divergence) in sidedness, differences in market dynamics between small and large pre-news dispersions are insignificant (significant) after these events. Thus, sidedness is another measure of belief divergence, complimenting measures of analyst forecast dispersions.
We find higher bid-ask spreads and imbalance prior to CR news when trading is
relatively more one-sided, consistent with news-driven trades. However, more one-sided stocks are also less volatile, which is inconsistent with the asymmetric information motive. The result may be explained by heterogeneous beliefs generating stronger volatility for the more two-sided stocks, with this latter effect dominating the news-driven volatility for the more one-sided stocks. Allowing for the co-determination of sidedness and volatility may lead to more consistent
results. We turn to this issue in the next section.
VI. Simultaneous Determination of Sidedness, Liquidity, Volatility, Number of Trades and the Order Imbalance
While we have shown that sidedness determines market dynamics, causality may also go in the opposite direction. For instance, two-sidedness may be explained by a temporary decrease in the bid-ask spread. We examine in Section VIA a scenario where the bid-ask spread or order arrivals are exogenous, and then consider the impact on sidedness. In section VIB, we estimate sidedness, liquidity, volatility and trading activity in a simultaneous equations framework to assess the extent to which these variables are co-determined. We have shown that more two-sided stocks generally (but not always) have lower imbalance, suggesting that they may reflect complementary types of information.19 In Section VIC, we examine how sidedness and order imbalance are related by including imbalance in the simultaneous equations system.
A. Sorting Stocks by the Bid-Ask Spread and the Number of Trades
A temporary decrease in the bid-ask spread may occur, perhaps due to an exogenous increase in limit order arrivals, thus reducing the cost of immediacy. Then, more traders are apt to submit market orders, as further price improvements are less likely (Parlour (1998); Foucault (1999); Foucault, Kadan and Kandel (2005)). Trading will be two-sided if the market orders are submitted on both sides of the market. Liquidity is higher (lower trading costs are the original impetus for trades), but the effect on volatility is ambiguous: while a smaller bid-ask bounce leads to lower volatility, the increased demand for liquidity could increase higher volatility.
To examine this scenario, we sort stocks by the “excess” bid-ask spread using the methodology described in Section VA (these results are not reported here). Let PEBASiT be the
mean effective spread for stock i in the test sample T and PEBASN be the median spread over all
stocks in the control sample N. A stock in sample T is in the “high spread” group if PEBASiT≥
PEBASN; otherwise the stock is in the “low spread” group. We then calculate differences in
CORR, HILO, NTR, and AIMB between the “high spread” and “low spread” groups. Since our interest is in scenarios where the bid-ask spread has decreased, we identify events with an unusually high number of stock-intervals in the “low spread” group. We find that these events mostly occur in the Nasdaq market following earnings and CR news, and before and after macro news. For these events, stocks in the “low spread” group are more two-sided (i.e. with higher CORR and lower AIMB), and have substantially greater trading and lower volatility, compared to stocks in the “high spread” group. These results are consistent with lower spreads leading to more two-sided markets. Sidedness and NTR are not statistically different for NYSE stocks with unusually low and unusually high spreads.
Since an exogenous increase in order arrivals may cause the spread reduction, we further consider the effect on market dynamics after sorting stocks into “high NTR” and “low NTR”
groups.20 We focus on events with an unusually high incidence of stock-intervals in the “high NTR” group. The identified events for Nasdaq stocks are after earnings reports, before macro news, and before and after CR news; and after earnings news for NYSE stocks. For these events, the more heavily traded stocks are more two-sided, and have lower spreads and higher volatility.
We conclude that a temporary decrease in the bid-ask spread is a likely source of trade initiation. Reduced spreads and increased order arrivals result in more two-sided markets, suggesting that sidedness, spreads and order arrivals are simultaneously determined.
B. Simultaneous Equation Results
In the previous section, we saw that sidedness is an outcome of changes in spreads and order arrivals. The arrival of market orders is also likely to be endogenous, depending on expected volatility and spreads; in turn, volatility and the spread may depend on the expected order arrivals. Moreover, we have shown that volatility, spreads and order arrivals are determined by the expected sidedness of the market. To account for the co-determination of these variables, we estimate a simultaneous equation system with sidedness, liquidity, volatility and the number of trades as endogenous variables. We use the two-stage least squares (2SLS) method to obtain consistent estimates.21 In the first-stage, we regress CORR, PEBAS, HILO and NTR on these instrumental variables (IV): L1CORR, L1PEBAS, L1HILO, L1NTR, where L1X is the first lag of X. For earnings and macro news, we also include the dummy variable DIS/SUR which equals one for the largest 50% of values of analyst forecast dispersions (news surprises) in the before (after) sample, and is zero otherwise. An observation is a 5-minute interval i for stock j on day t. CORR is estimated over all days of stock j for an interval i. As before, only the first 15 minutes of each day is used in the analysis.
Let E(CORR), E(PEBAS), E(HILO) and E(NTR) denote the fitted values from the first-stage regression. The second first-stage regressions for interval i, stock j and day t are:
ijt ijt ijt
ijt ijt
ijt a L CORR aE PEBAS a E HILO a E NTR e
CORR = 0 1 + 1 ( ) + 2 ( ) + 3 ( ) + 1 (8) ijt ijt ijt ijt ijt
ijt bL PEBAS bE CORR b E HILO bE NTR e
PEBAS = 0 1 + 1 ( ) + 2 ( ) + 3 ( ) + 2 (9) ijt ijt ijt ijt ijt
ijt c L HILO cE CORR c E PEBAS c E NTR e
HILO = 0 1 + 1 ( ) + 2 ( ) + 3 ( ) + 3 (10) ijt ijt ijt ijt ijt
ijt d L NTR d E CORR d E PEBAS d E HILO e
NTR = 0 1 + 1 ( ) + 2 ( ) + 3 ( ) + 4 (11)
where e1 to e4 are the error terms. In each equation, we include the first lag of the left-hand side variable and exclude the three remaining pre-determined variables; thus the system of equations (8)-(11) is exactly identified. For earnings and macro news, we also include DIS/SUR as a pre-determined variable in the second stage regressions.
A practical issue in estimating the regressions is the availability of enough observations to obtain reliable statistical results, in particular for the CR and earnings news samples. For this reason, we pool the NYSE and Nasdaq stocks for CR news. For the earnings news, there are important differences in results between markets, and so we pool the earnings and macro news for each market.22 For the no-news sample, results are similar for the two markets and we pool the NYSE and Nasdaq stocks in order to avoid repetition.
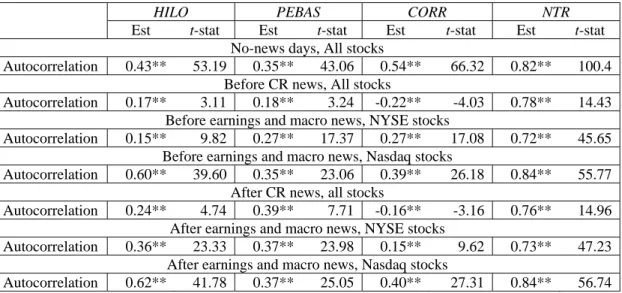
INSERT TABLE V HERE
Theory suggests that CORR and NTR should each be autocorrelated. For example, Parlour (1998) and Foucault (1999) imply a clustering of two-sided liquidity trades: periods of two-sided markets with high liquidity are apt to trigger further market orders on both sides of the market. In Table V, we present first order autocorrelation statistics for HILO, PEBAS, CORR and NTR on no-news days and around news events. All autocorrelations are significantly different from zero at the 1% level or less. Consistent with theory, NTR has a high degree of
positive autocorrelation (exceeding 0.70 in all samples); CORR is also highly autocorrelated, especially for Nasdaq stocks, comparable in magnitude to the autocorrelation of HILO and PEBAS. HILO and PEBAS are positively autocorrelated, as in prior research.
We further observe in Table V that the autocorrelation in CORR switches from 0.54 in the no-news sample to -0.22 in the days before CR news. The result is consistent with the possibility that, in advance of a private information event, insiders with long-lived information submit limit orders (Kaniel and Liu (2006)) while they submit market orders closer to the event, implying a switch from two-sidedness to one-sidedness.23
INSERT TABLE VI HERE
Results from the simultaneous regressions are presented in Table VI (pre- and post-event results are given in Panels A and B, respectively). For the first-stage regressions, we only present results involving LICORR for the sake of brevity. From Panel A, we find in the first-stage regressions that a higher L1CORR is a positive and significant determinant of HILO and NTR in seven of eight samples---i.e. more two-sided markets appears to predict higher volatility and more trading. In addition, LICORR is a negative and significant determinant of PEBAS in one sample (and significant at a 10% level in another sample), suggesting that more two-sidedness may predict lower effective spreads.
In the second stage regressions, there is evidence of co-determination of sidedness, volatility, trades and spreads for no-news days. Higher E(HILO) and E(NTR), and lower
E(PEBAS) are associated with more two-sided markets. In turn, when markets are expected to
be more two-sided (i.e. E(CORR) is higher), NTR and HILO are greater; also, PEBAS is lower, although this result only holds at the 10% level of significance. Next, consider results for before CR news. Evidence of co-determination is weaker, likely due to the small number of
observations. Unlike the other samples, we observe that E(CORR) and HILO are negatively related, consistent with trades that are motivated by asymmetric information resulting in more one-sided markets and boosting volatility prior to CR news.24
In the second-stage results for days before earnings and macro news, greater forecast dispersion increases CORR in both markets, reaffirming the close association between belief heterogeneity and two-sidedness. Increased dispersion leads to lower volatility and NTR in the Nasdaq markets; this is in addition to the indirect effect of dispersion on these variables via its impact on sidedness. There is also evidence of co-determination of all variables for the Nasdaq stocks. E(HILO) and E(NTR) are positive determinants, while E(PEBAS) is a negative
determinant, of CORR; in turn, E(CORR) is positively associated with HILO and NTR, and negatively associated with PEBAS. For the NYSE stocks, sidedness and NTR are co-determined; also E(CORR) is a significant determinant of HILO, but the reverse is not true.
For post-news events (Panel B), the first stage regressions reaffirm that LICORR may predict HILO, NTR and PEBAS. In the second stage regressions, an important result is that in the CR sample, E(CORR) is positively associated with HILO, whereas the association is negative in the pre-news sample. In other words, more two-sided stock-intervals are more volatile,
consistent with investors acquiring diverse information to interpret CR news. As in the pre-news sample, all variables are co-determined for Nasdaq stocks (except that E(CORR) is not
significantly related to NTR). Also, trading is more two-sided on days with large news surprises in both markets, suggesting that the incentive to acquire diverse information is greater when the surprise is larger. Controlling for sidedness, volatility and NTR are generally lower and spreads are generally higher on days with large surprises. Thus, news surprises impact the market both directly and indirectly via the sidedness measure.
The simultaneous equation results show that sidedness, spreads, order arrivals and volatility are co-determined in various scenarios: no-news days, and around earnings and macro news for Nasdaq stocks. The results reaffirm the link between sidedness, forecast dispersions and news surprises; and, more generally, between sidedness and sources of trade initiation. Finally, sidedness appears to have predictive power for order arrivals, volatility and spreads.
C. Sidedness and the Order Imbalance
Similar to sidedness, order imbalance may also be used for identifying trading motives.25 To clarify the relation between imbalance and sidedness, we include order imbalance (AIMB) and its lagged value (L1AIMB) in the simultaneous equations. (These results are not reported here). We find that increased dispersion or surprise predicts more two-sided markets in all cases, but is not significantly related to imbalance. This shows that, unlike sidedness, imbalance is not an indicator of belief heterogeneity or differential information. In all samples, L1CORR is a significant, negative indicator of AIMB: increased two-sidedness predicts lower imbalance. Reciprocally, L1AIMB is also a significant predictor of CORR in three of five samples. Thus, sidedness and imbalance are informative of each other. Moreover, both LICORR and L1AIMB are generally significant predictors of volatility and NTR, demonstrating that each is informative of market dynamics in the presence of the other. We conclude that sidedness and imbalance are jointly informative of each other and of market dynamics. However, belief heterogeneity is reflected in sidedness and not in imbalance.
VII. Results for Opening and Closing Minutes of Days without News
Trades may be initiated because of an aggregate shock to traders' impatience, resulting in increased two-sidedness if impatient participants arrive as both buyers and sellers. Traders are
likely to be less impatient after a call auction (Bosetti, Kandel and Rindi (2006)). Since the NYSE had an opening call during our sample period but Nasdaq did not, we examine the first 5 minutes of trading in both markets. We also examine the last 5 minutes of trading when traders are likely to become more impatient (Tkatch and Kandel (2006)). As discussed in Foucault, Kadan and Kandel (2005), comparing market dynamics in the closing period of the day with an earlier intra-day interval is similar to analyzing the proportion of impatient traders in their model. Since news arrivals complicate the identification of effects attributable to impatience shocks, we compare sidedness and market dynamics for the first and last 5 minutes to the middle periods (i.e. from 12PM to 3PM) of no-news days, referred to as “Mid-day.” We also examine the last 5 minutes of days when the bid-ask spread has increased between 12PM and 3PM since traders may be more likely to wait till the end of the day to execute orders in this situation.26
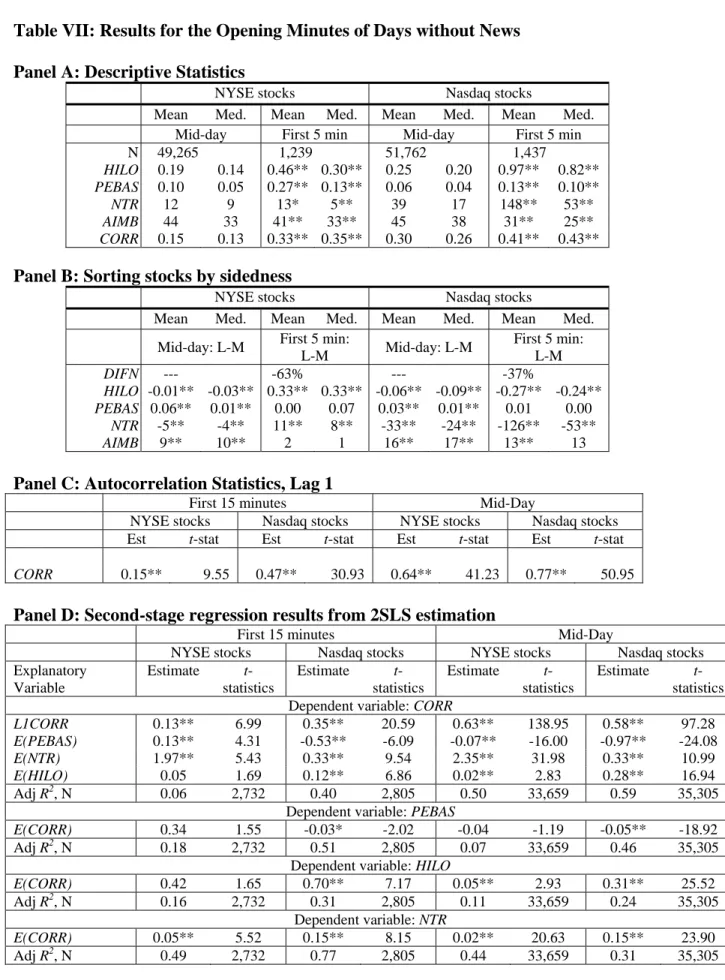
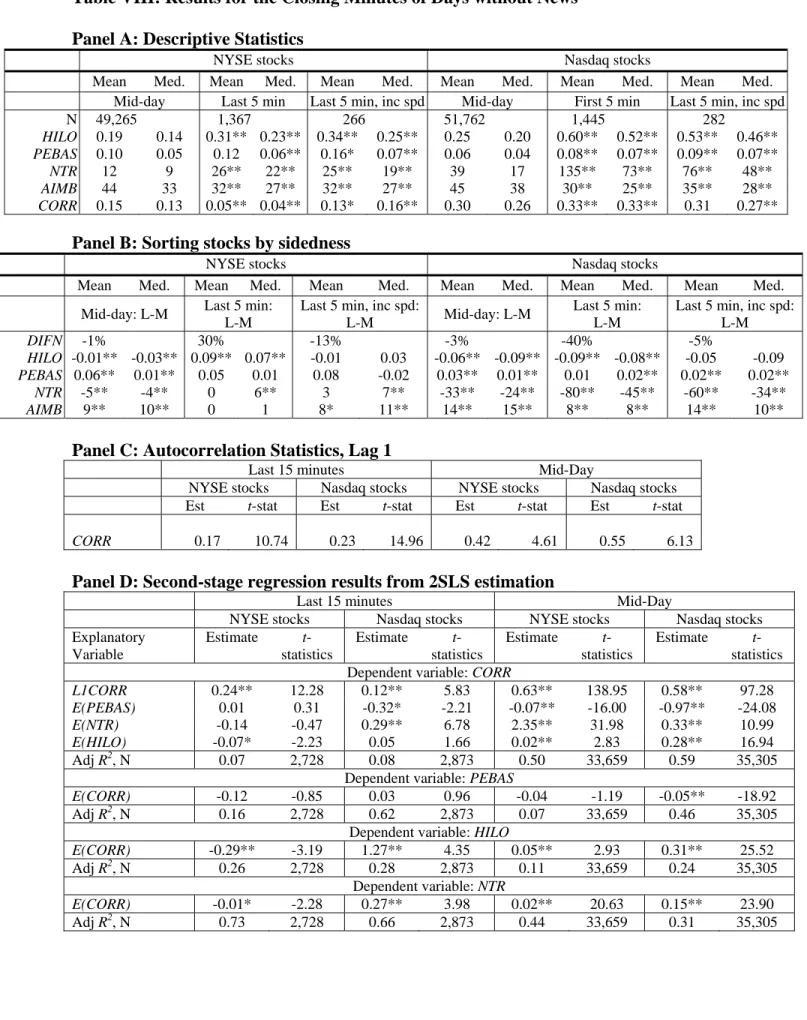
INSERT TABLE VII HERE
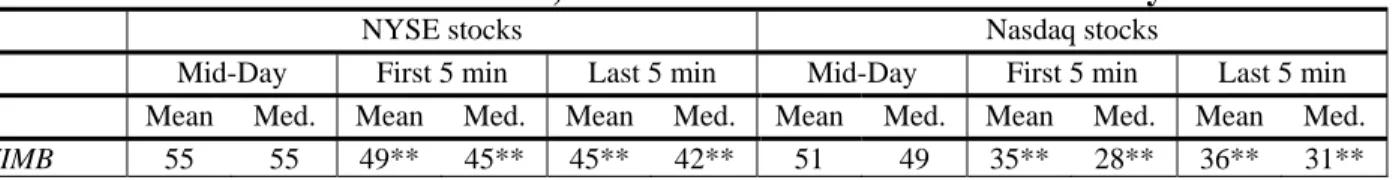
Results for the first 5 minutes of no-news days are in Table VII. Panel A gives
descriptive statistics for the first 5 minutes and for the average of the middle periods. Volatility
and PEBAS are higher, and AIMB is lower, compared to the mid-day intervals. Consistent with
increased two-sidedness, CORR increases in both markets. For Nasdaq stocks NTR is
substantially higher, indicating a high demand for immediacy. In contrast, for NYSE stocks, the median NTR is lower and the mean NTR is little-changed, compared to the mid-day period.
To examine whether sidedness is a determinant of market dynamics in the first 5 minutes, we sort stocks by their “excess” sidedness relative to the mid-day period, as in Section VA. The results are reported in Panel B. We find that DIFN is large and negative, indicating more two-sided intervals in the first 5 minutes relative to the mid-day. For the Nasdaq stocks, the more two-sided stocks have higher NTR and volatility. In contrast, for the NYSE sample, the more
one-sided stocks have higher NTR and volatility. These results are consistent with increased impatience of Nasdaq traders, relative to NYSE traders, in the first 5 minutes: impatient buyers and sellers on Nasdaq place orders on both sides of the market and drive up volatility.
To obtain lag values, we expand the opening period to 15 minutes and divide it into three 5-minute intervals. We divide the “Mid-day” sample (12PM to 3PM) into three hourly intervals. The autocorrelation of sidedness (Panel C) indicates that it is highly persistent, especially for Nasdaq stocks. Select second-stage regression results from the simultaneous equations are shown in Panel D. We find, for both markets, that E(CORR) is a positive determinant of NTR and, conversely, that E(NTR) is positively associated with CORR. In addition, for the Nasdaq stocks, E(CORR) is a positive determinant of HILO and a negative determinant of PEBAS. Conversely, higher E(HILO) and lower E(PEBAS) are significantly associated with higher values of CORR. In contrast, for the NYSE stocks, E(CORR) is unrelated to NTR and PEBAS. The persistence of two-sidedness and its significant association with market dynamics are further evidence of the high immediacy demand for Nasdaq stocks in the opening minutes.
INSERT TABLE VIII HERE
Results for the last 5 minutes of days without news are presented in Table VIII. Panel A shows descriptive statistics for the last 5 minutes and for the average of the middle periods. Volatility, PEBAS and NTR are all higher, and the absolute imbalance is lower, compared to the mid-day intervals. Trading in the last 5 minutes, compared to the mid-day intervals, is less two-sided for the NYSE stocks but more two-two-sided for the Nasdaq stocks, as shown by the median and mean correlations. When the bid-ask is increasing (“Last5 min, inc spd”) for the NYSE stocks, there is greater two-sided trading and higher HILO compared to the entire last 5-minute sample, which is consistent with a bigger shock to impatience on these days.
We sort stocks by their “excess” sidedness relative to the mid-day period (Panel B). For Nasdaq stocks, DIFN is -40% indicating more two-sided intervals in the last 5 minutes relative to the mid-day period; also, NTR and volatility are higher, and the spread lower, for these more two-sided stocks. The results are consistent with impatient buyers and sellers placing orders on both sides of the market in the last 5 minutes. Recall that, for stocks in aggregate, the bid-ask spread is higher in the last 5-minutes compared to the mid-day period; these spread increases are tempered for stocks with more two-sided trading. Trading is more one-sided for NYSE stocks (DIFN is 30%). Further, the more one-sided stocks are more active and have greater volatility. However, on days with increasing spreads, there are relatively more two-sided trading intervals (DIFN is -13%), and the more two-sided stocks have volatilities that are statistically similar to their mid-day values. This suggests relatively more impatience-driven trades in the closing minutes when the spread is trending up in the NYSE.
Next, we expand the sample to the last 15 minutes of the day to obtain lag values. The autocorrelation statistics (Panel C) reveal moderate persistence in sidedness. Second-stage regression results (Panel D) show that for the Nasdaq stocks, E(CORR) is a positive and significant determinant of HILO and NTR; conversely, higher E(HILO) and E(NTR), and lower
E(PEBAS), are generally associated with greater CORR, consistent with a greater demand for
immediacy resulting in more two-sided markets. For the NYSE stocks, higher E(CORR) is related to lower HILO and NTR; and higher E(HILO) indicates lower CORR. These results imply that greater volatility in the closing minutes is associated with more one-sided trading on the NYSE but more two-sided trading on the Nasdaq, as we have found.
Overall, the results are consistent with impatience being a driving motive for trading in the opening and closing minutes of days without news, especially in the Nasdaq market.