External
Annual Reports 2005
11
NÁRODNÁ BANKA SLOVENSKA
1
1.1 Global trends in output
and prices
The world economy in 2005 slowed only slightly in comparison with its strong growth in 2004. Despite a slowdown in the fourth quarter, the main drivers of the growth were the economies of the United States and of East Asia, particularly China, which has maintained an exceptionally high level of growth. The euro area, with its business cycle lagging slightly behind that of the United States, is looking forward to an expected upswing. Above-average growth, albeit slightly decli-ning, was sustained by the economies of the new EU Member States as well as Russia. The recovery of the Japanese economy also continued in 2005. As in 2004, world economic growth was characterized by persisting regional differences that maintained the situation of long-term global imbalances. The main indicator of these imbalances, the US current acco-unt deficit, became even more prominent in 2005. These growing imbalances were once again caused by domestic demand in the United States which, as in the previous year, increased under the conditions of an expansive fiscal policy. On the other hand, East Asian countries and oil-exporting countries continued to report large surpluses and to build up their foreign exchange reserves.
1 External Economic Environment
The solid world economic growth continued to be supported by favourable financing conditions, relati-vely strong corporate profits, and a rising volume of investment in developed economies. The financial markets in 2005 were characterized by unusually low risk premiums and low volatility. Short-term interest rates generally increased, and the interest rate diffe-rential between the US dollar and the euro also rose. Long-term interest rates remained, however, below average and therefore the yield curve flattened con-siderably. Amid ample liquidity and search for yields a rising volume of capital flowed into newly industriali-zed economies. The generally favourable environment supported an increase in equity prices outside the United States, especially in emerging markets. At the same time, real estate prices were rising, however, at a significantly slower rate than in 2004.
Commodity prices kept an upward course in response to rising global demand. The price of Brent crude oil was relatively volatile in 2005, reaching a highest level of USD 67.5 per barrel in the third quarter and avera-ging over USD 54 per barrel for the year, an increase of more than 45% in comparison with 2004. The oil price was affected both by rising demand (especially in the United States and China), and by supply-side un-certainty caused by natural disasters, the disruption of production in Nigeria, geopolitical insecurity in Iraq
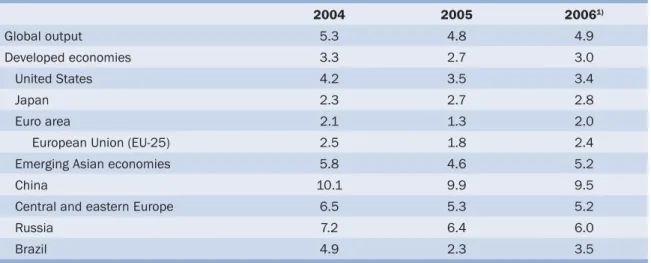
Table 1 Global output (year-on-year growth in %)
2004 2005 20061) Global output 5.3 4.8 4.9 Developed economies 3.3 2.7 3.0 United States 4.2 3.5 3.4 Japan 2.3 2.7 2.8 Euro area 2.1 1.3 2.0
European Union (EU-25) 2.5 1.8 2.4
Emerging Asian economies 5.8 4.6 5.2
China 10.1 9.9 9.5
Central and eastern Europe 6.5 5.3 5.2
Russia 7.2 6.4 6.0
Brazil 4.9 2.3 3.5
Source: IMF World Economic Outlook, April 2006. 1) Forecast.
and Iran, and the low oil supply growth in non-OPEC countries. These factors, as well as the increasing oil price itself, had a direct effect on the prices of other energy commodities, which increased most sharply at the beginning and end of 2005. Prices of other (non--energy) commodities also increased over the course of the year, by almost 10% on average.
Despite pressure from rising prices of energy and other commodities, both inflation and inflation expec-tations were relatively low. Lower sensitivity of infla-tion and wage costs to price shocks is a result of not only positive globalization effects (the growing trade in cheaper traded goods from emerging economies in exchange for capital from developed economies), but also of the increased credibility of central banks. The strengthening of the euro and general weakening of the US dollar that had been a feature of previous years came to an end in 2005. In fact, the dollar appreciated by more than 10% overall against both the euro and the yen, largely because of the growing interest rate differential and the improved outlook for economic growth in the United States. The value of the dollar also rose in response to current conditions in commodities trading and the resulting rise in the real prices of commodities. Over the course of the year this market trend changed only for a short period of time, at the beginning of March, when the dollar came under speculative pressure concerning the possibility that certain central banks would diversify their foreign exchange reserves away from dollars. The market, however, swung back to support the dol-lar, especially after France and the Netherlands voted in early June to reject the European Constitutional
Treaty. Moreover, reports of rising foreign demand for US assets further helped to ease concerns about the financing of the US current account deficit. In July, China formally abandoned its currency’s peg to the dollar and revalued the renminbi by 2.1%. However, the new exchange rate regime, a basket peg, did not bring a notable change in the quantitative value of the exchange rate, despite the pressure of the international community to a gradual liberalization of the renminbi exchange rate towards its equi-librium value. The bilateral trade balances therefore
0 4
Euro area USA Japan
3 -2 2 1 -1 1999 1998 2000 2001 2002 2003 2004 2005 China
Chart 2 Consumer prices in the euro area, the United States, Japan and China (%)
Source: IMF World Economic Outlook, April 2006. Chart 1 GDP growth in the euro area, the
United States, Japan and China (%)
Source: IMF World Economic Outlook, April 2006.
2 8 12
Euro area USA Japan
10 0 -4 6 4 -2 1999 1998 2000 2001 2002 2003 2004 2005 China 6
I. 2004 II. 2004 III. 2004 IV. 2004 V. 2004 VI. 2004 VII. 2004 VIII. 2004 IX. 2004 X. 2004 XI. 2004 XII. 2004 II. 2005 III. 2005 IV. 2005 V. 2005 VI. 2005 VII. 2005 VIII. 2005 IX. 2005 X. 2005 XI. 2005 XII. 2005
Euro area UK USA
5 4 3 2 1 0 Japan I. 2005
Chart 3 Short-term interest rates on the interbank market (3M) (%)
Annual Reports 2005
13
NÁRODNÁ BANKA SLOVENSKA
1
continued to increase with a surplus in China and a deficit in the US.
The euro was worth USD 1.20 at the end of 2005. During the year it depreciated by more than 10% against the US dollar and by almost 4% against sterling; it also lost ground to the Canadian dollar, Australian dollar and to most of the currencies of the new EU Member States (Hungary being an exception). Against the Japanese yen as well as the Swiss franc, the euro exchange rate remained year-on-year at the same level.
1.2 Developments in the main
currency areas: the euro area,
United States, Japan and China
Economic development in the euro area
Economic growth in the euro area stood at 1.3% for 2005, representing a slight slowdown in comparison with 2004. The expected economic recovery was relatively weak, which may be attributed to two main factors. On the one hand, there were rising oil prices and low growth in real disposable income. Household saving stayed largely unchanged, which curbed private consumption and therefore domestic demand. On the other hand, foreign demand was dampened by the delayed effects of the euro appreciation in 2004. Furthermore, labour productivity recorded growth of less than 1%. The subdued productivity growth was partially linked to the rise in employment, as well as to structural aspects of utilizing technological and hu-man capacities. HICP inflation increased only slightly, to an average level of 2.2% (compared with 2.1% in 2004). Inflation in 2005 was also dampened by the strong euro exchange rate against certain currencies and by the effect of ever increasing global competition on prices of tradable goods.
The modest fall in GDP growth in the first quarter of 2005 was caused mainly by a decline in output in agriculture, industry and construction. The lower growth in industry for all quarters of the year, as well as the persisting decline in value-added creation in agriculture (owing to a base effect), were the main factors behind the subdued growth dynamics in the euro area economy (Chart 4).
GDP growth in 2005 decreased year-on-year in all euro area countries except for Spain and Ireland (whose GDP grew by 3.4% and 4.7%, respectively). They along with Greece (3.7%) and Luxembourg (4.2 %) recorded the strongest growth among the euro area countries. Growth of less than 1% was recorded in Germany (0.9 %) and Portugal (0.3%), while Italy stagnated. The difference between the economies with solid
growth and those in stagnation (or with slow growth) therefore widened slightly in 2005 in comparison with the difference in the previous year.
The energy component affected the structure of infla-tion to a greater extent in 2005 than in the previous year, as energy prices increased at an average annual rate of more than 10%. Despite much larger contribu-tion of the energy component to overall inflacontribu-tion in the euro area (0.8% compared with 0.2% in 2004), overall HICP inflation increased only marginally (by 0.1 of a percentage point to 2.2%). The profile of energy prices over the course of the year also corresponded with the development of the HICP index: both the value of the energy component of inflation and overall inflation
peaked in September (at 15.0% and 2.6%,1
respecti-vely). Other components of inflation were less volatile during the year, and secondary pressures from price growth in the energy component were minimal. The annual increase in consumer prices in the euro area countries measured by HICP inflation ranged
from 0.8% in Finland to 3.8% in Luxembourg.2 Inflation
of more than 3% was reported in Greece (3.5%) and Spain (3.4 %). Inflation in most other countries was close to the overall average for the euro area (between 1.9% and 2.5%). 5 3 2 1 0 -2 -3 10 6 4 2 0 -2 -6 Construction (6%)
The economy (100%) Industry (21%) Public administration (23%)
Trade and transport (21%)
Agriculture (2%) Financial services (27%) (right-hand scale) 2004 2005 4 -1 -4 8 Q1 Q2 Q3 Q4 Q1 Q2 Q3 Q4
Chart 4 Structure of value-added creation in the euro area (annual growth rate, in %)
Source: Eurostat.
Note: The percentages shown in brackets represent the share of the total creation of value added in the euro area economy.
1 Year-on-year percentage change in the HICP.
2 The energy component of inflation had the greatest effect in Luxembourg, representing as much as 1.4 percentage points, while in other euro area countries it was between 0.5 and 1.0 percentage point.
Costs of oil imports were rising in reaction to oil price increases, which caused a decline in the trade surplus of the euro area. With its other components remai-ning largely unchanged, the current account balance declined by 1% of GDP and moved into a deficit for the first time in four years.
Regarding public finances in the euro area as whole, there was a moderately restrictive fiscal policy in 2005. The negative output gap widened slightly, which had a mildly adverse effect on the budgets. Government balances differed substantially among euro area countries, as they had in previous years. Portugal, Greece, Italy and Germany exceeded the 3% reference value in 2005 (Germany did so for the fourth consecutive year, while the French deficit was slightly below the limit). The pace of consolidation in 2005 was not sufficient, largely because of lower GDP growth and the overshooting of projected expen-diture. The most substantial shortfalls in budgetary consolidation persisted mainly in countries that have a large government deficit. Although the euro area’s overall deficit for 2005 narrowed slightly (from 2.8% to 2.4%), it was not enough to reduce the debt-to-GDP ratio, which increased moderately (to 70.8% of GDP) in 2005 after rising also in previous years.
Employment slowly began to increase in 2005, by a very modest 0.2%. While the growth was faster in services and construction, it declined in industry. Part of this development was attributable to labour market policy measures aimed at promoting part-time work. Since the labour supply did not change during the year, the rate of unemployment declined, and by the end of the year stood at 8.3%. Despite some progress in labour market flexibility, further reforms in employ-ment are required in order to address the growing economic competition, the pace of technological advances, and above all the population ageing. Improving but subdued private consumption in 2005 was held down by the weak growth in disposable income (less than 1%). The low rise in disposable income reflected mainly the modest growth in wages, which declined to 1.5%. Wage development did, howe-ver, differ on both sectoral and geographical basis. Wages in industry were the main factor for subdued wage growth, while wages in market-oriented services (trade, transport, and financial and business servi-ces) actually recorded higher growth. The secondary effects of rising commodity and energy prices were not felt before the end of the year. Wage indexation posed a risk in those countries where it is more de-eply entrenched, though it did not directly exacerbate these effects.
Real estate prices in the euro area continued to increase in 2005 (to June, by 7.7% year-on-year), but the structure of the growth differed substantially from
region to region. Prices recorded the highest rises mainly in Spain, Italy and France, while in Germany they even fell slightly.
The financial account recorded a turnaround in 2005 when, in contrast to 2004, net outflows of direct and portfolio investments were registered. The balance of investment inflows and outflows declined year-on-year by EUR 37 billion, or 0.5% of GDP. The main cause was an unequal reallocation of a part of the capital from direct investments to portfolio investments and shares. The behaviour change of enterprises in the euro area was probably based on expectations of stronger economic growth in countries outside the euro area and on efforts to increase competitiveness through investments in foreign activities. A countering effect may have been the interest of foreign investors in euro-area equity securities, which the market con-sidered to be relatively more attractive.
Economic development in the United States
Economic activity in the United States continued to grow at a relatively fast pace (especially in the first three quarters), and growth for 2005 came to 3.5%. Both the goods and services sectors expanded, although at a weaker pace than in 2004. The con-ditions for real GDP growth were largely created by consumer spending which, as in 2004, was supported by favourable financing conditions, continuing rise in real estate prices, and growing employment. Another element of real GDP growth was the increase in corpo-rate investments, which were further boosted by rising corporate profits. Profit growth was also supported by the modest increase in wages and the continuing, albeit slight, growth in labour productivity. Despite rising energy prices and the adverse effects of hurri-canes, inflation pressures in 2005 were dampened by the appreciation of the dollar, subdued growth in unit labour costs (2.9%), and continuing rise in labour productivity (2.7%). Annual CPI inflation stood at 3.4% (2.2% excluding energy). Nevertheless, modest wage growth and the increase in energy prices put a down-ward pressure on already insufficient rate of personal saving. Consequently, the ratio of household debt to disposable income increased even further over the course of the year. Household demand continued to be satisfied mainly from net imports of goods, which increased sharply in comparison with the previous year and pushed the current account deficit up to 6.4% of GDP (compared with 5.7% in 2004).
Economic development in Japan
The Japanese economy kept on a recovery course and grew by 2.7%. As in 2004, growth accelerated mainly in the first half of the year (when the economy
Annual Reports 2005
15
NÁRODNÁ BANKA SLOVENSKA
1
grew by 5% year-on-year). The economic recovery was initiated by growth in exports, corporate investments, and investments by non-residents related to rising demand in Asian countries. Investments by residents and increased private consumption, which reflec-ted improving figures for employment and income, followed this development. Capital expenditure by non-residents also rose under the effect of favou-rable financing conditions, the falling share of non--performing loans, and solid corporate profits. Aided by depreciation of the yen against the US dollar (and therefore against most East Asian currencies), exports to countries with rising demand, especially China and the United States, picked up towards the end of the year. Weakening of the exchange rate and rising com-modity prices supported a gradual move away from deflation (though it still amounted to 0.3%), and the prospects are for an increase in the CPI. The price of labour, which recorded a slight increase in 2005 as a result of growing employment, should be conducive to an upturn in the CPI. The banking sector benefited from improving macroeconomic conditions over the course of the year, while the credit risk related to the volume of non-performing loans continued to decline. The Nikkei Stock Average increased by 40% in the second half of the year, reflecting the positive outlook for Japan’s economic activity.
Economic development in China
and East Asia
China’s economic growth, as well as that of other East Asian countries, remained very strong in 2005 and reached 9.9% (compared with 10.1% in 2004). Moreover, the latest revisions of data indicate that growth in recent years was even stronger than pre-viously published. The main element of the growth is the large volume of foreign direct investment (which in 2005 represented some 3% of GDP). The continuing expansion of Chinese net exports is supported by the managed exchange rate of renminbi – still lower than the equilibrium rate – in conjunction with investments. China recorded a record surplus on its current account in 2005, which, along with the surplus on the capital and financial accounts, accounted for the further increase in reserves. By the end of the year, China held dollar reserves amounting to USD 819 billion and had surpassed Japan as the largest holder of dollar reserves in the world. The contribution of net exports to economic growth slightly and temporarily weakened, towards the end of the year. This was largely due to the renminbi effective exchange rate appreciating by approximately 10% over the course of 2005. Consumption, however, continued to increase, supported by income growth both in urban agglome-rations and in rural areas. Private sector output, the traditional driver of growth, accounted for almost 60% of GDP. It was private sector companies that created
most of new jobs and generated the growth in corpo-rate sector productivity and profitability. This process, moreover, has still far to go. Inflationary pressures from 2004 ceased, even though they stemmed from growth in energy prices and these continued to rise. Inflation in 2005 eased to 1.8%, partly on account of tightened monetary policy. Other East Asian countries also recorded dynamic growth and achieved the same level as in 2004, i.e. 7.9%.
Monetary policy and public finances
The European Central Bank (ECB) made only one change to key interest rate in 2005, when it raised them by 25 basis points to 2.25% (the minimum bid rate on main refinancing operations) in December. This increase resulted from a gradual revision of in-flation projections in regard to the growing conviction about long-term growth in energy prices and its effect on price stability. On the fiscal side, there was general-ly ongeneral-ly a small progress towards sounder public finan-ces in 2005. The rate of consolidation did, however, differ substantially between the euro area countries. The total government deficit in the euro area declined only slightly. Moreover, a higher number of countries reported a deficit exceeding the reference value laid down by the Stability and Growth Pact. Government debt in 2005 also averaged in excess of the Pact’s 60% limit and increased slightly.
In 2005, the Federal Open Market Committee (FOMC) of the Federal Reserve System (Fed) was progressively raising the target federal funds rate. Eight increases by 25 basis points brought the Fed’s key rate to 4.25% by the end of the year. This series of steps, announced in advance and anticipated, continued in the trend of tightening monetary policy that the Fed had embarked on in 2004. In the fiscal sphere, the government deficit narrowed to only 2.6% of GDP (down from 4.4% in 2004) largely because of higher income tax revenues from both natural persons and legal persons.
The Bank of Japan continued to purse an extremely loose monetary policy in 2005, with the key interest rates fixed at 0%, while flooding the banking sector with liquidity. The emergence of economy from long--term recession strengthened prospects for an end to such central bank policy within the near future. The weak discipline of government authorities, both in 2005 and over many previous years accounted for the large government deficit (6.1% of GDP). This further increased the ratio of gross government debt to GDP, up to almost 170%.
1.3 Developments in non-euro
area Member States
Economic and monetary development
Real GDP growth in non-euro area Member States slowed down in 2005 in comparison with 2004. It re-mained, nevertheless, substantially stronger than the growth in the euro area (Chart 5). The growth rate in 2005 was as usual above average in the Baltic states (over 7%) and in the Czech Republic and in Slovakia (close to 6%). Growth in the vast majority of countries was driven by domestic demand, mainly by private consumption supported by increases in real dispos-able incomes, especially in the new Member States (except for Poland and Malta). In some countries this trend was encouraged by an expansive fiscal policy and growth in real estate prices. In most of the EU-10 countries domestic demand was supported by the continuing strength of investment growth, based on low interest rates and growing corporate confidence. Investment growth in 2005 was substantially aided by financing from EU funds. Foreign demand fuelled real GDP growth in the Czech Republic, Baltic countries and to a lesser extent also in Hungary.
Strong economic growth along with increasing in-vestment activity created an environment conducive to the creation of new jobs and the improvement of labour market conditions. Employment growth rose on average, especially in those countries with a higher rate of unemployment and high investment activity. The growth in the labour force implies, however, that unemployment is at present falling only gradually.
HICP inflation in the new EU Member States in 2005 was again very close to the average inflation in the euro area. The slowdown of inflation in the first half of the year may be attributed both to a base effect – price growth related to expectations when the ten new Member States acceded to the EU – and to inten-sifying competition in tradables, especially foodstuffs. A further downward pressure on inflation in 2005 was the gradual appreciation of the effective exchange ra-tes of the Czech, Polish and Slovak currencies. On the other hand, rising prices of oil and energy put upward pressure on inflation (though only partially, since the secondary effects were modest and since energy pri-ces are regulated in most of the new Member States). Thus, these prices along with weakening of the above base effect were a factor behind a moderate increase in inflation in the new Member States towards the end of the year. Moreover, a rise in domestic demand stemming from increased lending to households was to a certain extent a source of inflationary pressures in some countries.
Although inflation in the EU-3 countries came in lower than the average inflation in the euro area, it did in-crease year-on-year owing to low figures in 2004. Fiscal policy in the non-euro area countries in 2005 varied in character from one country to another, ranging from a budget surplus in Sweden (2.9% of GDP) and Denmark (4.9% of GDP) to a large deficit in Hungary (6.1% of GDP). The results for fiscal sector are basically in line with the aims of the convergence programmes of 2005. Despite a favourable economic environment, the government balances of non-euro
Chart 5 GDP growth
(%)
Source: Eurostat.
Chart 6 HICP inflation
(%)
Source: Eurostat.
2 6
Euro area EU-10 UK
5 1 0 4 3 2001 2002 2003 2004 2005 2 6
Euro area EU-10 EU-3
5 1 0 4 3 2001 2002 2003 2004 2005
Annual Reports 2005
17
NÁRODNÁ BANKA SLOVENSKA
1
area countries deteriorated, reflecting various ad-ditional and one-off budget expenditures. In most non-euro area countries (except Malta and Cyprus), the debt-to-GDP ratio was safely below the reference value of 60%.
Current account balances had a very mixed develop-ment in 2005, ranging from a surplus in Denmark and Sweden to large deficits in the Baltic countries (Table 2). In catching-up economies, however, the significant deficits on current accounts merely reflect a natural development, in which previous inflows of capital allow for the financing of investments with high value added, investments that could not have been financed from domestic funds alone. The net inflow of foreign direct investment in 2005 grew slightly in compari-son with 2004, and in all of the new Member States
apart from Slovenia there was recorded a positive net inflow of foreign direct investment. Even though this is an important source of financing, it is not always sufficient to cover current account deficits.
In 2005 new members joined Estonia, Lithuania, Slo-venia and Denmark in the exchange rate mechanism ERM II. Cyprus, Malta and Latvia entered the mecha-nism in May 2005 and Slovakia joined at the end of November, with all the countries officially observing a standard fluctuation band of ±15% around a central
parity against the euro.3 ERM II participation in 2005
passed with no serious tensions in any of the foreign exchange markets of the eight member countries. Since joining ERM II the Danish krone, Estonian kroon, Lithuanian litas, Maltese lira and Slovenian tolar traded at or close to their central parities. The
Table 2 Basic macroeconomic indicators of the non-euro area Member States (%)
GDP HICP inflation Unemployment rate1) Current account (in % of GDP) 2004 2005 20062) 2004 2005 20062) 2004 2005 20062) 2004 20053) 20062) EU-3 Denmark 1.9 3.1 3.2 0.9 1.7 2.1 5.5 4.8 4.0 2.3 2.9 3.4 Sweden 3.7 2.7 3.4 1.0 0.8 1.1 6.3 7.8 7.0 6.6 5.9 5.8 United Kingdom 3.1 1.8 2.4 1.3 2.1 2.0 4.7 4.7 5.0 -2.0 -2.6 -3.3 Baltic states Lithuania 7.0 7.5 6.5 1.2 2.7 3.5 11.4 8.2 7.1 -7.9 -7.0 -7.3 Latvia 8.5 10.2 8.5 6.2 6.9 6.7 10.4 9.0 8.4 -12.9 -12.4 -13.1 Estonia 7.8 9.8 8.9 3.0 4.1 3.6 9.7 7.9 7.0 -12.7 -10.6 -9.8
Central European states
Czech Republic 4.7 6.0 5.3 2.6 1.6 2.5 8.3 7.9 7.7 -6.0 -2.3 -2.6 Hungary 4.6 4.1 4.6 6.8 3.5 2.3 6.1 7.2 7.7 -8.4 -7.4 -8.3 Poland 5.3 3.2 4.5 3.6 2.2 1.0 19.0 17.7 16.2 -4.2 -1.5 -2.0 Slovakia 5.5 6.1 6.1 7.5 2.8 4.4 18.2 16.4 15.5 -3.4 -8.5 -5.7 Slovenia 4.2 3.9 4.3 3.7 2.5 2.4 6.3 6.3 6.3 -2.0 -1.1 -1.6 Mediterranean states Cyprus 3.9 3.8 3.8 1.9 2.0 2.4 4.7 5.3 5.4 -5.3 -5.7 -6.1 Malta -1.5 2.5 1.7 2.7 2.5 2.9 7.3 7.3 7.4 -9.6 -12.9 -12.6 For information EU-25 2.4 1.6 2.3 2.1 2.2 2.1 9.1 8.7 8.5 0.0 -0.3 -0.9 Euro area 2.0 1.3 2.1 2.1 2.2 2.2 8.9 8.6 8.4 0.5 0.1 -0.5
Source: European Commission Economic Forecast Spring 2006. 1) In % of labour force.
2) Forecast. 3) Estimate.
3 Both the Cypriot pound and Latvian lats were unilaterally pegged to the euro prior to joining ERM II. Whereas Cyprus has pegged its currency to the euro since 1999, when the common currency was introduced, Latvia switched its currency’s peg at the beginning of 2005, from the SDR (Special Drawing Right – the unit of account used by the IMF, the value of which is based on a currency basket) to the euro and kept within a fluctuation band of ±1%. After joining ERM II, the Latvian authorities announced that they would maintain the lats exchange rate within a fluctuation band of ±1% around the central parity against the euro. When the Maltese lira entered ERM II, it abandoned a currency basket that included the euro, the British pound and the US dollar, and became pegged to the euro. The Maltese authorities also declared that they would hold the lira’s exchange at the central parity against the euro. As regards the Slovak koruna and Cypriot pound, no formal unilateral obligations for narrower bands have been adopted.
Cypriot pound, Latvian lats and Slovak koruna were somewhat more volatile, though mostly fluctuated on the appreciation side of the fluctuation band, within 2 to 3% of the parity.
The main objective of monetary policy in all non-euro area Member States is price stability. In 2005, mo-netary policy regimes and exchange rates remained basically unchanged from one country to another. Six countries applied exchange rate targeting (Den-mark, Estonia, Cyprus, Latvia, Lithuania, Malta), five countries inflation targeting (the Czech Republic, Poland, Slovakia, Sweden, the United Kingdom), and two countries applied combined regimes – inflation targeting that takes account of the exchange rate (Hungary) and a two-pillar regime tracking monetary, real, external and financial indicators of macroecono-mic conditions (Slovenia).
Developments in V4 countries
Strong economic growth of the V4 countries continued in 2005, despite rising oil prices (and higher energy intensity of these economies) and the weak recovery in the euro area.
The Czech Republic recorded its fastest ever growth (6.0%), which was largely accounted for by an incre-ase in net exports. This resulted from the strength of foreign direct investment made in the automotive industry over previous years. The country’s external position also improved substantially, in particular the trade balance, which recorded a surplus of 2% of GDP. Growth in private consumption slowed slightly, paral-leled with the slow increase in disposable income, mainly owing to lower growth in real wages. Although interest rates were at a record low, the increase in gross fixed capital formation also declined. On the supply side, economic activity was driven by industry, trade and financial services.
Real GDP growth in Hungary fell again in 2005, to 4.1%. As in the Czech Republic, the main engine of growth was net exports. Output growth was
par-ticularly strong in the manufacturing of electrical and optical equipment and in the manufacturing of transport equipment. On the other hand, the largest contribution to gross fixed capital formation came from public investment in infrastructure. Private con-sumption increased only slightly in comparison with previous years, which reflected low growth in dispos-able income. The lower than predicted trade deficit and growth in foreign direct investment accounted for more than 1 percentage point of the decline in the current account deficit. The rate of inflation declined sharply over the course of the year, while the Hunga-rian central bank reduced the central base rate by 3.5 percentage points.
In Poland real GDP growth in 2005 slowed conside-rably to 3.2% (by more than 2 percentage points). After pre-election instability in the first half of the year, when investment growth declined to 2.5%, investor confidence was only gradually restored and there was no substantial upswing until the fourth quarter, when the economy grew by 4.2% year-on-year. Domestic demand increased by only 1.9%, dragged down by low consumption and a relatively sharp decline in inventories that was related to excessive demand ex-pectations in 2004. Nevertheless, domestic demand adjusted for the change in inventories was the leading factor behind the economic growth (a contribution of 3 percentage points). The contribution of net exports was relatively weak (1.3 percentage points) amid a substantial decline in the growth of both exports and imports.
Economic growth in Slovakia accelerated to 6.1% in 2005. The main driver of growth was domestic demand, especially private consumption and in-vestment. Private consumption benefited mainly from the increase in employment (by 2,1%) and the real wage growth (6.3%); and investment mainly from large investment projects in the corporate sector (es-pecially the automotive industry) and a rising volume of public investment in infrastructure. In contrast to previous years, the contribution of net export was temporarily negative as exports and imports increased only slightly.