of the
NATIONAL INSURANCE FUND
as of 31 December 2011
17th June, 2013
Hon. D. Shane Gibson, M.P. Minister
Ministry of Labour & National Insurance Government of The Bahamas
Dear Minister Gibson,
RE: 9th Actuarial Review of The National Insurance Fund
I have the honour to submit to you the report of the 9th Actuarial Review of the National Insurance Fund as of December 31, 2011, prepared in accordance with Section 48 of the National Insurance Act. The Review has been performed by the Board’s Consultant Actuary, Mr. Derek Osborne.
The Board has reviewed the report and has discussed and accepted the findings and recommendations made therein. It is hoped that the Government initiate the steps necessary to amend the relevant sections of the National Insurance Act and Regulations aimed at enhancing both the relevance and sustainability of the Fund.
Sincerely,
Rev. Dr. James Moultrie Chairman
April 5th, 2013 Rev. James Moultrie Chairman
The National Insurance Board Dear Chairman Moultrie:
RE: Actuarial Review of The National Insurance Fund
It is my pleasure to present to you the report of the 9th Actuarial Review of the National Insurance Fund prepared as at December 31, 2011.
The report provides:
a) a review of experience between 2007 and 2011,
b) an assessment of existing contribution and benefit rules and parameters, and the Fund’s investments,
c) 60-year projections of the Fund’s income, expenditure and reserves, and
d) recommendations for design and administrative changes that could improve long-term
financial sustainability while maintaining benefit adequacy.
I am grateful to the many persons involved in the preparation of this report, especially Ms. Amanda Darville, Actuarial Analyst.
Sincerely,
Derek M. Osborne, FSA Consultant Actuary
Table of Contents
Table of Contents ... i Abbreviations and Acronyms ... ii Introduction ... iii Executive Summary ... ivChapter 1 Activities & Experience Since The 8th Actuarial Review ... 1
1.1 Amendments To Act & Regulations ... 1 1.2 Economic Experience ... 2 1.3 National Insurance Experience ... 3 1.4 Benefit Branch Experience & Reserves... 4 1.5 Experience Compared With Projections Of 8th Actuarial Review ... 5 1.6 Investments ... 6 1.7 Subsequent Events ... 8 Chapter 2 Assessment Of Performance & System Design ... 9 2.1 Historical Performance, 1975 – 2011 ... 9 2.2 Meeting Policy Objectives ... 11 Chapter 3 Best‐Estimate Projections ... 16 3.1 Population Projections ... 16 3.2 National Insurance Projections ... 19 3.3 Comparison With Results Of 8th Actuarial Review ... 25 3.4 Effect of Retirement Benefit Reforms ... 26 3.5 Sensitivity Analysis ... 27 Chapter 4 Alternative Scenarios ... 28 Chapter 5 Balancing Adequacy & Sustainability ... 30 5.1. Coverage ... 30 5.2. Benefit Adequacy ... 31 5.3. Financial Sustainability ... 34 5.4. Administrative Efficiency ... 38 5.5. Diversification Security ... 40 Chapter 6 Good Governance ... 41 6.1. ISSA Good Governance Guidelines ... 41 6.2. ISSA Investment Guidelines... 43 Statement of Actuarial Opinion ... 44 References ... 45 Appendix A Summary of Contribution & Benefit Provisions ... 46 Appendix B Methodology, Data & Assumptions ... 55
Appendix C Projection Results – Alternate Scenarios ... 64
Appendix D Income, Expenditure & Reserves, 2007–2011 ... 71
Appendix E Benefit Branch Experience & Analysis ... 72
Appendix F Unemployment Benefit ... 78
Abbreviations and Acronyms
BISX Bahamas International Securities Exchange BoB Bank Of The Bahamas CSP Pensionable Civil Servant GDP Gross Domestic Product IAS Insurance Administrative System IBB Industrial Benefits Branch ILO International Labour Office IPS Investment Policy Statement ISSA International Social Security Association IT Information Technology MBB Medical Benefits Branch NI National Insurance NIB National Insurance Board NIF National Insurance Fund NPDP National Prescription Drug Plan OECD Organisation for Economic Co‐operation & Development PAYG Pay‐as‐you‐go STB Short‐term Benefits TFR Total Fertility Rate UN United Nations
Introduction
The National Insurance Board (NIB) began operations in October 1974. Employed and self‐ employed persons are covered for three main types of social security benefits – short‐term, long‐term and industrial (employment injury) benefits. The system is financed by contributions that are levied on employment earnings up to a wage ceiling and are paid by employers, employees and self‐employed persons. Surplus funds are invested in various types of securities and properties.
This is the report of the 9th Actuarial Review of the National Insurance Fund (NIF), and in accordance with Section 48 of The National Insurance Act, 1972, is being prepared five years after the 8th Actuarial Review.
The main purpose of periodic actuarial reviews is to determine if the Fund operates on sound financial and actuarial bases and if it provides adequate and affordable levels of income protection. Where considered necessary, recommendations aimed at ensuring that these objectives can be achieved for current and future generations are made.
For this actuarial review, 60‐year demographic and financial projections have been performed. It should be noted that these projections are dependent on the underlying data, methodology and assumptions concerning uncertain future events and that the outcomes and eventual experience will most likely differ, possibly materially, from that indicated in the projections. Therefore, in accordance with the National Insurance Act, periodic actuarial reviews should be conducted. The next actuarial review of the National Insurance Fund is due no later than December 31, 2016.
This 9th Actuarial Review has been prepared by Mr. Derek Osborne, Consultant Actuary. Assisting with the data gathering and projections was Ms. Amanda Darville, Actuarial Analyst.
Executive Summary
National social security systems make promises to former and current workers that extend beyond 60 years. It is therefore important that these systems are well designed, well governed and properly administered. Periodic actuarial reviews of the National Insurance Fund (NIF) provide a comprehensive assessment of the current and projected state of the Bahamas’ primary social security system. They also provide policy recommendations for changes designed to ensure that a suitable balance between benefit adequacy and financial sustainability is achieved for both current and future periods.
Failure to regularly and consistently follow good governance practices, especially in the areas of human resources, awarding of contracts and investments, continues to affect the efficient and effective operation of the National Insurance Board. Further, the lack of political will to implement stronger penalties for businesses and self‐employed persons who fail to make timely contribution payments serve to diminish the Fund’s ability to maximise its income and reduce operating costs, ultimately jeopardizing long‐term sustainability. Following the laying in Parliament of the report of the 8th Actuarial Review in 2009, extensive reforms to both contribution and benefit provisions were made: Unemployment benefit was introduced in 2009 resulting in NIB providing income protection to workers for all contingencies that could lead to involuntary loss of wages.
In 2010, the National Prescription Drug Plan, which provides prescription drugs free of charge for 14 chronic diseases to select groups, was added.
In 2010, and again in 2012, changes were made to eligibility rules and benefit calculations for pensions that positively affected long‐term sustainability.
The wage ceiling was increased by 50% and automatic biennial adjustments to both pensions in payment and the wage ceiling were introduced. As a result of these, NIB now provides more predictable benefits that will maintain their value over time.
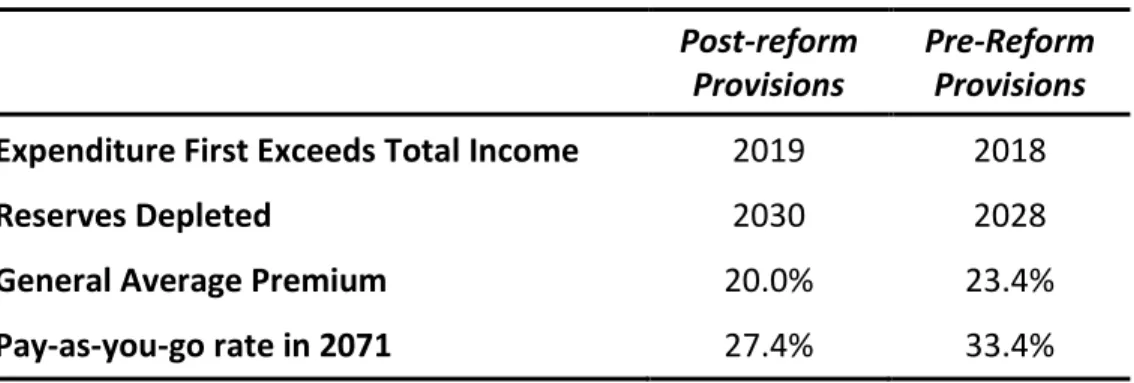
When considered in totality, these reforms led to both enhanced benefit adequacy for most insured persons and an overall improvement in long‐term sustainability.
Due mainly to the effects of the global economic crisis and a recession locally, NIF finances underperformed the projections of the 8th Actuarial Review. As unemployment increased and many full‐time employees worked reduced hours, contribution income was negatively affected while benefits and administrative costs continued to increase. During the 5‐year review period the number of contributors declined while the number of pensions in payment increased. Although benefits exceeded contributions in some years, the Fund experienced net surpluses in each year resulting in benefit reserves increasing from $1.42 billion at the end of 2006 to $1.65 billion at the end of 2011.
Main Findings
This report’s assessment of National Insurance policy and design indicators suggests that current contribution and benefit provisions provide a very good level of benefit adequacy and income protection to most workers and pensioners. Recent reforms have resulted in enhanced income protection for higher paid earners and greater predictability of future benefits for pensioners of all income levels. However, the heavy concentration of investments in Bahamas Government and other public sector securities, the failure of around 25% of the workforce to make regular NIB contributions, and very high administrative costs, are ongoing challenges faced by the Fund.
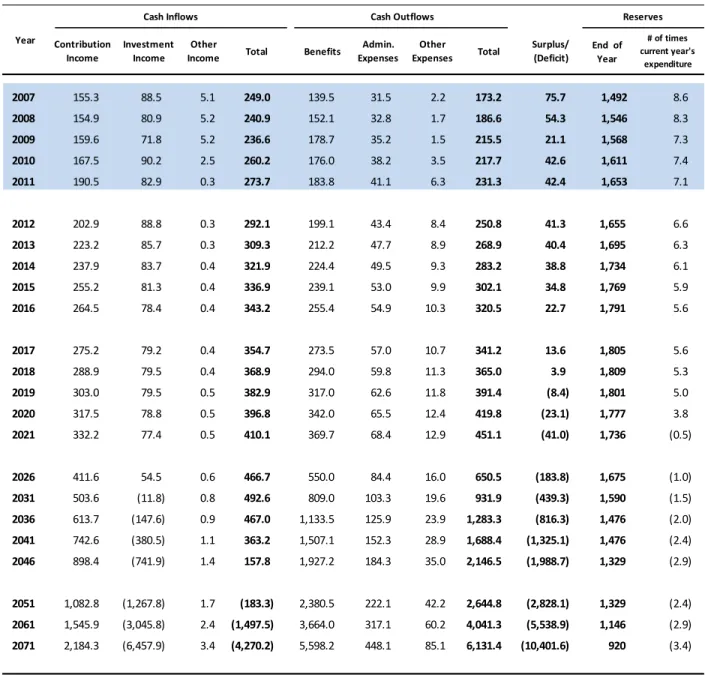
For this Review three sets of 60‐year projections of the Bahamas’ population and National Insurance Fund finances have been performed so that a range of reasonable prospects for the Fund may be assessed. These projections are based on there being no changes to the current contribution rate and benefit rules. Given the uncertainty in projecting such an extended period, the timing of certain events and the rates that will apply are presented as ranges. 1. Contribution income will never again be sufficient to meet total expenditure. 2. Total expenditure will first exceed total income between 2017 and 2022. 3. The Fund will be depleted between 2028 and 2033. 4. The pay‐as‐you‐go rate, or the rate required to produce just enough contribution income to meet total expenditure when the Fund is depleted, will be between 17.5% and 18.2%. 5. The pay‐as‐you‐go rate in 2071 will be between 23.2% and 32.2%. 6. The average long‐term cost of benefits over the next 60 years, often referred to as the general average premium, is between 17.5% and 23.1%.
These results indicate that the National Insurance Fund is not financially sustainable over the long‐term with the current benefit provisions and contribution rate.
Recommendations
Recommendations in this report are made with the objective of arriving at a suitable balance between benefit adequacy and long‐term sustainability. Unlike for private sector funds, financial sustainability for a national pension system may be described as being able to meet future obligations without placing undue burden on the incomes of future workers. Secondly, major reforms to a national pension system should not be a regular process. Thus, given the extent of reforms made in recent years, only a few benefit reforms are recommended with the overriding goal of further enhancing coverage and benefit adequacy, while boosting long‐term sustainability. These recommendations are:
1. To enhance coverage:
a. Require contributions from all employers for workers with two or more jobs so that future benefits can be based on their regular combined insurable wages.
b. Devise a more simple and attractive means by which self‐employed persons can contribute.
2. To enhance benefit adequacy:
a. For Unemployment benefit, remove the condition that defers its payment by the number of weeks of redundancy payments received.
b. For Survivors benefit, clarify and possibly revise the rules regarding eligibility of widow(er)s over age 40 who have no eligible children.
c. For pensionable civil servants, revise the method used to calculate average insurable wages for pensions so that it will take less than 40 years to obtain the maximum benefit once they start contributing on full insurable wages in July 2013.
3. To enhance sustainability:
a. For Retirement benefit, consider increasing the normal pension age from 65 to 67. b. For Retirement benefit, consider revising pension calculations so that they are based on
average career insurable wages instead of only average insurable wages in the best 5 years.
c. Seek further ways to reduce Medical Care costs by directing patients to facilities that adequately provide the level of care needed.
d. Introduce a meaningful penalty for late payment of contributions.
e. Insist that any new or expanded benefits to be financed by the National Insurance Fund be fully funded with new contributions or transfers from the Bahamas Government. f. Increase investment diversification by setting two key 10‐year asset mix goals –
overseas investments to account for at least 20% of the Fund and Bahamas public sector securities to account for no more than 50% of the Fund.
4. To enhance administrative efficiency:
a. Further develop mutually beneficial links with various government departments that will enhance the level of NIB contribution compliance.
b. Significantly reduce administrative expenses with a goal of 10% of contributions by 2021.
5. To ensure Good Governance:
a. Implement at all levels the International Social Security Association’s Good Governance Guidelines.
In 2011, the International Social Security Association (ISSA) published the “ISSA Good Governance Guidelines for Social Security Institutions.” These Guidelines present a governance framework that spans a range of governance issues. It recognizes accountability, transparency, predictability, participation and dynamism as core good governance principles. It recommends qualified persons be appointed to serve on Boards and in leadership positions and that there be clear roles for the Minister, the Board and management. These ISSA Good Governance Guidelines, prepared specifically for social security schemes, can help guide NIB’s transformation into a well governed, efficient and sustainable system.
Contribution rate increases are inevitable. By design, the system was intended to have the rate increase gradually over time. Even though expenditure now exceeds contribution income an immediate contribution rate increase is not among this report’s recommendations. Instead, the recommended financing strategy for the next 10 to 15 years is to increase the contribution rate in steps of ½% to 1% per annum if the following year’s budget suggests that total expenditure will exceed total income. Under such a strategy, annual adjustments will likely be required starting in 2018.
With assets of over $1.6 billion, NIB may appear to be an institution that can afford to hire more people than it needs, pay more for contracts than another organisation would, and invest in securities where the risk‐reward tradeoff suggests that it is not prudent to do so. This is not the case. For NIB to consistently deliver on its future obligations without having to levy exorbitant contribution rates in the future, a firm commitment to implementing and following a good governance framework at all levels is required.
Chapter 1 Activities & Experience Since The 8
thActuarial Review
1.1
Amendments To Act & Regulations
In April 2009, the Government of The Bahamas added unemployment benefit to NIB’s suite of benefits making The Bahamas only the second country in the Caribbean to offer this benefit. Initially, the qualifying conditions were very liberal and the benefit was financed by $20 million transferred from the Fund’s Medical Benefits Branch (MBB). In June 2010, the contribution rate for all employed persons was increased by 1% and more stringent eligibility criteria were introduced.
Details of the rules and early experience of the unemployment benefit may be found in Appendix F.
In 2010, and again in early 2012, significant reforms were made to contribution and benefit provisions. Most of these changes were in line with recommendations made in the 8th Actuarial Review. The 2010 amendments that materially impacted NIF finances are listed below. Unless otherwise stated, the effective date was January 2011. 1. Pensions in payment in July 2010 were increased by up to 6.6%. 2. Automatic biennial pension increases, based on the change in the Retail Price Index over the prior two years, were introduced with the first adjustment taking place in July 2012. 3. The ceiling on insurable wages was increased from $400 to $500 per week in January 2011 and to $600 per week in July 2012.
4. Automatic biennial increases to the wage ceiling will occur every two years starting July 2014 by the change in the Retail Price Index over the prior two calendar years, plus 2%. 5. The contribution rate and wage ceiling for pensionable civil servants, which since 1984 has been different from those for private sector workers, will be changed so that all employed persons will contribute on the same basis starting July 2013. 6. For workers in the hospitality sector, gratuities will be included in insurable wages starting July 2013.
7. The number of weekly contributions required for Retirement benefit was increased from 150 to 500 and a Retirement Grant (lump sum payment) at age 65 for those who do not qualify for a pension was introduced.
8. The adjustment to average insurable wages for pension calculations of those earning more than $250 per week was eliminated.
9. The reduction factors applied to Retirement benefits awarded prior to age 65 were changed from 4% per year to 7/12% per month.
10.Maternity grant was increased from $400 to $430 and Funeral benefit from $1,500 to $1,600. (July 2010) These rates will be increased every 2 years. 11.Widows and widowers may receive their Retirement or Invalidity benefit with 50% of their Survivors benefit. Previously, only the higher of the two benefits was payable. 12.A Survivors grant, equivalent to 1 year’s pension, payable to widowed spouses who do not qualify for a Survivors pension was introduced. 13.Coverage for all benefits, except Unemployment Benefit, was extended to all self‐employed persons and the contribution rate for all self‐employed persons was set at 8.8%.
14.A stricter means test for Assistance pensions which considers cash, investments and real estate, was introduced.
In 2010, the National Prescription Drug Plan (NPDP) was established through amendments to the NI Act and the passage of the National Insurance (Chronic Diseases Prescription Drug Fund) Act, 2009 and supporting Regulations. The NPDP provides defined groups with free access to prescription drugs for specific chronic illnesses. To date, the NPDP has been financed by the Medical Benefits Branch. Details of the NPDP and its early experience may be found in Appendix G.
1.2
Economic Experience
NIB’s two sources of income, contributions and earnings on investments, are closely linked to economic performance and labour market changes. Some benefits are also affected by economic changes. For example, more people are likely to claim Retirement and Invalidity benefits if they lose their job and cannot find a new one. As shown in the charts in Figure 1.1, The Bahamas economy contracted in two of the five years in the review period, with average growth over the period of ‐0.4% per annum. Inflation remained relatively low averaging 2.3% per annum. As a consequence of the economic downturn, employment contracted and the unemployment rate increased. Figure 1.1. Key Economic Indicators, 2007 to 2011 ‐6% ‐4% ‐2% 0% 2% 4% 2007 2008 2009 2010 2011 Real GDP Growth 0.0% 1.0% 2.0% 3.0% 4.0% 2007 2008 2009 2010 2011 Inflation 6% 9% 12% 15% 2007 2008 2009 2010 2011 Unemployment Rate1.3
National Insurance Experience
In line with recent economic patterns, the number of insured persons making contributions declined while the numbers of pensions in payment increased during the review period. This resulted in the number of contributors per pension in payment decreasing from 5.5 to 4.8. Figure 1.2. Contributors & Pensioners, 2006 to 2011 Both the average insurable wage and the average pension in payment increased between 2006 and 2011. (Figure 1.3 below) The increase in average insurable wage was due to both regular wage increases and the ceiling adjustment to $500 per week in January 2011, while pension increases were mainly due to cost of living adjustments in 2007 and 2010. Since pensions account for 80% of total benefit expenditure, changes to the number of pensions and the average pension amount have greatest influence on year‐over‐year changes in benefit expenditure. Figure 1.3. Average Insurance Wages & Pensions in Payment, 2006 to 2011
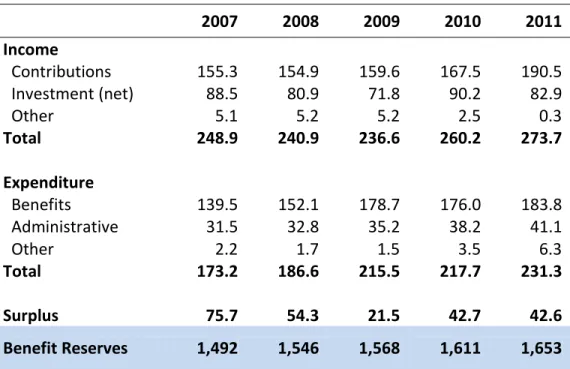
The following table provides summary income and expenditure amounts for years 2007 to 2011. A more detailed version of the National Insurance finances for these years may be found in Appendix D. 142,000 144,000 146,000 148,000 150,000 2006 2007 2008 2009 2010 2011 # Contributors 22,000 24,000 26,000 28,000 30,000 32,000 2006 2007 2008 2009 2010 2011 # Pensions In Payment 4.0 4.5 5.0 5.5 6.0 2006 2007 2008 2009 2010 2011 # of Contributors Per Pension $260 $280 $300 $320 $340 $360 2006 2007 2008 2009 2010 2011 Avg. Weekly Insurable Wage $50 $65 $80 $95 $110 2006 2007 2008 2009 2010 2011 Avg. Weekly Pension 20% 22% 24% 26% 28% 30% 2006 2007 2008 2009 2010 2011 Avg. Pension As % of Avg. Ins Wage
Table 1.1. Summary of NIF Finances, 2007 – 2011 (millions of $’s) 2007 2008 2009 2010 2011 Income Contributions 155.3 154.9 159.6 167.5 190.5 Investment (net) 88.5 80.9 71.8 90.2 82.9 Other 5.1 5.2 5.2 2.5 0.3 Total 248.9 240.9 236.6 260.2 273.7 Expenditure Benefits 139.5 152.1 178.7 176.0 183.8 Administrative 31.5 32.8 35.2 38.2 41.1 Other 2.2 1.7 1.5 3.5 6.3 Total 173.2 186.6 215.5 217.7 231.3 Surplus 75.7 54.3 21.5 42.7 42.6 Benefit Reserves 1,492 1,546 1,568 1,611 1,653 Notes: Immaterial differences in totals may result due to rounding. Investment income shown above is net of all provisions and adjustments. Key highlights of income and expenditure are:
(i) The increase in contributions in 2010 was due primarily to the 1% increase in the contribution rate and the significant increase in contributions in 2011 was due to the increase in the wage ceiling.
(ii) Fluctuations in investment income were due to fluctuations in prices of some BISX listed equities.
(iii) In 2010, The Bahamas Government ceased the annual transfer of $4.9 million to the NIF. This transfer partly subsidized non‐contributory pensions. It is not expected that such transfers will be reinstated.
(iv) The significant increase in benefit expenditure in 2009 was due to the introduction of unemployment benefit.
(v) National Prescription Drug Plan expenditure accounts for the increase in Other Expenditure in 2010 and 2011.
1.4
Benefit Branch Experience & Reserves
NIB administers three major types of social security benefits – long‐term or pensions, short‐ term benefits and industrial (employment injury) benefits. While the summary of National Insurance finances presented in the previous section shows total income and expenditure, internal accounting procedures separate finances into four branches – one each for the three groups of benefits and a fourth known as the Medical Benefits Branch. Funds in this branch
come from a special allocation of contributions and are used for the development of health infrastructure throughout The Bahamas.
While the three benefit types have different characteristics and implicit financing mechanisms, the existence of branches does not affect the overall financing or sustainability of the Fund. Detailed analysis of individual branch experience may be found in Appendix E.
1.5
Experience Compared With Projections Of 8
thActuarial Review
In the 8th Actuarial Review, projections were prepared under three scenarios – Best Estimate, Low Dependency (optimistic) and High Dependency (pessimistic). Shown below is a comparison of actual cumulative experience over the 5‐year period with the projections of the Best Estimate Scenario. Table 1.2. Projections from 8th Actuarial Review Compared With Actual Experience 2007 ‐ 2011 Projected – Best Estimate (millions of $’s) 2007 ‐ 2011 Actual (millions of $’s) Variance Contribution Income 999 828 17.2% below projected Investment Income (net) 393 414 5.3% above projected Benefit Expenditure 809 830 2.6% above projected Administrative Expenditure 160 179 11.9% above projected 2011 Year‐end Reserves 1,854 1,653 10.8% below projected The large negative variance in contribution income is due primarily to two main factors:
(i) The projections of the 8th Actuarial Review were performed prior to the onset of the global economic crisis which negatively affected foreign direct investments and the labour market. (ii) It was assumed that the wage ceiling would have been increased from $400 to $600 per
week in 2009. Instead, the ceiling was increased to only $500 in 2011.
Investment returns were slightly better than projected with an average annual yield on reserves of 5.6% compared with the assumed rate of 5.0%.
Although the projections of the 8th Actuarial Review did not include Unemployment benefit which was added in 2009, total benefit expenditure was only slightly higher than projected as expenditure for other benefits was lower than projected, partly due to reduced economic activity.
In the 8th Review it was assumed that administrative expenses, expressed as a percentage of insurable wages, would gradually decline following staff reductions in 2006 from a Voluntary Early Retirement Package and the expected increase in the wage ceiling. However, operating costs continued to increase.
1.6
Investments
At the end of 2011, National Insurance investments stood at $1.63 billion, up from $1.35 billion at the end of 2006. The relationship between investments and reserves, which measures how efficiently available funds are invested, is very good, averaging 98% over the 5‐year review period. At the end of 2011, NIF investments stood at 21% of GDP. During the review period, the average yield on investments was 5.7% and the average yield on reserves was 5.6%. With inflation averaging 2.3% per annum, the average real rate of return on reserves over the 5‐year period was 3.3%. The following table provides a summary of the investment mix of the National Insurance Fund at year‐end 2006 and 2011. Table 1.3. Summary of Investments, Year‐end 2011 & 2006 (millions) Investment Category 2011 2006 $’s % $’s % Certificates of Deposit 289.8 17.7% 226.8 16.8% Treasury Bills ‐ ‐ 94.5 7.0% Bahamas Government Bonds 690.1 42.2% 597.6 44.3% Bonds Issued by Gov’t Corporations 236.6 14.5% 238.2 17.6% Other Bonds & Notes – Bahamas 91.5 5.6% 8.8 0.7% Other Bonds & Notes – Overseas 16.0 1.0% ‐ ‐ Loans to Gov’t Corporations 3.2 0.2% 15.6 1.2% Direct Finance Leases (Bahamas Gov’t) 160.7 9.8% 59.3 4.4% Investment Properties 5.1 0.3% 20.9 1.5% Equities & Preferred Shares – Bahamas 72.8 4.5% 57.4 4.3% Equities – Overseas 6.7 0.4% ‐ ‐ Investment in Associate (Bank of Bahamas & Cable Bahamas) 61.0 3.7% 31.2 2.3% Total 1,633.6 100% 1,350.4 100% Notes: Direct Finance Leases include construction in progress. Totals may be off due to rounding.Notable changes in asset mix between 2006 and 2011 are:
(i) Slight reduction in the overall percentage of the Fund held in Bahamas Government securities.
(ii) Significant increase in the amount held in Direct Finance Leases with the Bahamas Government.
(iii)Significant increase in Other Bahamian Bonds & Notes, the majority of which are held in Nassau Airport Development Company debt securities.
(iv)Almost doubling (in dollar terms) of holdings in Investment in Associates ‐ Bank of The Bahamas and Cable Bahamas. A summary of the asset mix, with specific emphasis on diversity, shows that: 66.9% of assets are held in public sector (Government and Quasi‐Government) securities, 20.3% of assets are held in short‐term deposits, and 98.8% of assets are held locally, a small portion of which is denominated in US dollars. National Insurance Fund investments are guided by an Investment Policy Statement which was last revised in 2010. The following table shows the asset mix in December 2011 compared with the acceptable ranges found in the Investment Policy Guidelines. Table 1.4. December 2011 Asset Mix Compared With Investment Policy Guidelines
Investment Classification Actual Acceptable
Range Variance Fixed Income (Bahamas Gov’t & Corporations) 66.6% 40‐60% Over
Fixed Income (Bahamas Non‐Gov’t) 15.8% 4‐10% Over
Loans (Bahamas Gov’t & Corporations) 0.2% 4‐10% Under
Loans (Bahamas Non‐Gov’t) ‐ 4‐10% Under Bahamian Equities 4.5% 10‐20% Under Bahamian Real Estate 0.3% 5‐10% Under Cash and Cash Equivalents 17.7% 10‐15% Over International Fixed Income 0.9% 3%‐7% Under International Equities 0.4% 0.50‐1.50% Under Alternative Investments ‐ 0.50‐1.50% Under
As shown above all of the individual asset allocations in December 2011 were outside of the target ranges as per the most recently revised Investment Policy.
In June 2011, the Bahamas Prime Rate was reduced by ¾% from 5½% to 4¾%. With most of its investments having returns linked to the Prime Rate, the Fund’s returns were immediately affected and will continue to experience lower returns. However, given that a stronger economy with increasing employment and wage levels is more important in the long run than higher returns on investments, it is hoped that lower interest rates will spur economic growth and development.
Although there has been slight improvement in asset diversification since 2006, NIF assets remain too heavily invested within The Bahamas and too heavily invested in Bahamas Government and public corporation instruments.
1.7
Subsequent Events
In January 2012, an additional set of amendments were made to Contributions Regulations and Benefits & Assistance Regulations. Although these changes took effect in July 2012, after the date of this Review, many of them have significant effects for eligibility and amounts payable and thus are presented below.
1. The age at which persons will be able to receive their Retirement benefit and earn more than 50% of the wage ceiling was reduced from 70 to 65.
2. Pensions awarded after age 65 will receive a positive actuarial adjustment of 7/12% for each month over age 65 up to a maximum of 35%. 3. Orphans will continue to receive Survivors benefit even if they are in school part time. The requirement previously was that after age 16 and up to age 21, they had to be in school full time. 4. Widows/Widowers can now receive Survivors benefit if they are married for less than 1 year – the requirement before was at least 1 year.
5. Basic wages now include productivity pay for certain classes of workers. For example, drivers of water trucks, gas tanks etc. who are paid a flat fee and paid for every bottle of water or tank of gas sold. This means better coverage of their regular earnings.
6. Persons can now receive Old Age Non‐Contributory Pension after getting a Retirement grant once they have exhausted the effective number months of assistance that the grant represented.
Chapter 2 Assessment Of Performance & System Design
National social security systems must balance benefit adequacy with affordability and long‐ term sustainability. There is an obvious trade‐off between these concepts:‐ higher benefits provide larger incomes to the elderly, invalid and widowed, but cost more. On the other hand, inadequate pensions result in pressures to increase benefits or add new ones. And when reforms designed to enhance long‐term sustainability are continuously deferred, the adjustments required when reforms are eventually made will need to be drastic to both contributors and beneficiaries in order to materially impact sustainability.
While past trends for key financial ratios associated with sustainability and an analysis of rules and parameters associated with benefit adequacy are useful, the benefit rules that are likely to govern pension amounts 20 to 40 years from now also need to be assessed. This Chapter contains a review of past trends for key financial indicators, current design parameters and examines how well key policy objectives are being met.
2.1
Historical Performance, 1975
–
2011
Experience for key financial factors from 1975 to 2011 is presented in the following charts: Figure 2.1. National Insurance Experience 0% 2% 4% 6% 8% 10% 12% 1975 1980 1985 1990 1995 2000 2005 2010 Contribution & Expenditure Rates 0 2 4 6 8 10 12 14 16 1975 1980 1985 1990 1995 2000 2005 2010 Reserve‐Expenditure Ratio 0% 1% 2% 3% 4% 5% 6% 7% 8% 1975 1980 1985 1990 1995 2000 2005 2010 Yield On Reserves 0% 5% 10% 15% 20% 25% 30% 1975 1980 1985 1990 1995 2000 2005 2010 Admin. Expenses As % of Contribution Income Contribution Rate Expenditure RateAs a social security system matures the patterns shown in the two upper charts are typical – total expenditure as a percentage of insurable wages gradually increases while the size of the reserve relative to annual expenditure decreases if the contribution rate is not increased. Both of these trends can be attributed to the number of pensioners increasing more quickly than the number of contributors and the average pension increasing at a faster rate than average insurable wages. While the yield on reserves has been quite volatile in recent years, lower returns are expected following the ¾% reduction in the Bahamas Prime Rate in mid‐2011, and the global low‐interest rate environment. Most of the Fund’s investments are in some way tied to the Prime Rate. The ratio that remains contrary to expected trends relates to administrative costs. As NIB has grown and invested in technology, it has not been able to reduce operating costs, which during the past five years averaged 22% of contributions collected.
Following are values for several key indicators as of the dates of the 7th, 8th and 9th Actuarial Reviews along with a brief analysis of the changes that have occurred. Table 2.1. National Insurance Performance Indicators 2001 2006 2011 Comments 1. Avg. Contribution Rate 8.2% 8.2% 9.2% Rates adjusted for first time in 2010. 2. Expenditure Rate 8.8% 9.3% 11.1% Gradual increase expected. Gap between expenditure and contributions widening. 3. Benefits as % of GDP 1.8% 1.9% 2.4% Gradual increase expected. 4. Reserve‐Expenditure Ratio (total reserves) 8.9 8.7 7.1 Gradual decrease expected. 5. 5‐year average nominal yield on reserves 6.6% 5.5% 5.6% Little change in last 10 years. 6. 5‐year average real yield on reserves (net of inflation) 5.1% 2.7% 3.3% Inflation lower in most recent 5‐ year period. 7. Administrative Expenses (5‐yr average) as: % of Contributions % of Insurable Wages 21% 1.8% 21% 1.8% 22% 1.8% Still very high ‐ no change in past 15 years. 8. # of Contributors Per Pension 5.3 5.4 4.7 Gradual decline expected. 9. Avg. Pension as % of Avg. Insurable Wage 22% 24% 27% Gradual increase expected with larger increase in last 5 years due to pension adjustments.
Other than for administrative costs, all other experience is generally in line with design features and/or economic realities.
2.2
Meeting Policy Objectives
The National Insurance system is mandatory for all employed and self‐employed persons. It has a defined benefit structure where the rules governing eligibility and the amounts payable are defined. Together, the rules and the amounts at which key parameters are set determine benefit adequacy. How well certain rules are enforced and how well the system is managed also impacts how well policy objectives are met.
The OECD in their report “OECD Pensions Outlook 2012” classified a national pension system’s primary objectives into six main categories as follows:
Coverage looks at how well workers of all sectors are covered for income security in old age;
Adequacy relates to the ability of pensions to provide a decent standard of living;
Financial sustainability ultimately relates to the affordability of the system to future contributors and tax payers;
Work incentives relate to pension systems having rules that do not encourage people to cease working but instead encourage them to remain employed longer;
Administrative efficiency relates to keeping operating and management costs as low as possible; and
Diversification relates to income security in old age coming from various sources with different financing mechanisms.
To determine how well these objectives are now being met, and how likely they are to be met in the future, an analysis of current contribution and benefit provisions, key rates and parameters as well as actual performance indicators have been reviewed. While some mention is made of Short‐term and Industrial benefits, this analysis focuses primarily on pensions which account for 80% of NIB benefit expenditure. 2.2.1 Coverage
With NIB participation mandatory for all employed and self‐employed persons, coverage concerns relate to actual participation rates by formal and informal sector workers and the proportion of elderly residents receiving an NIB pension. The following three rates provide a fairly good analysis of current coverage levels:
a) % of workers contributing regularly to (covered by) the NIB 75% b) % of the elderly resident population who receive an NIB pension 80% c) % of workers that have their wages fully covered by NIB 85%
There have been significant enhancements to income coverage in 2010 and 2012 given the two ceiling adjustments and future adjustments every 2 years. While there remains room for improvement regarding the number of employed persons contributing, the percentage of self‐ employed making contributions still remains very low at just under 30%, a significant improvement, however, since the last Review when the rate was 19%. As shown on the previous page, NIB pensions (contributory or non‐contributory) are currently being received by around 80% of the Bahamian population that is 65 and over. After almost 40 years of existence this level of pension coverage is good. The current ceiling of $600 per week, $2,600 per month or $31,200 per annum, is slightly above the estimated average national wage. By international social security standards this ceiling now provides adequate income coverage to almost all workers.
For the elderly poor, the Assistance pension which is now fully financed by the NIF provides income support to those who do not qualify for a contributory pension. There are over 4,000 elderly persons who receive this pension.
In addition, some workers, especially those in the public service and financial sector, may also be covered by employer pension plans. It is estimated that just under 30% of workers in The Bahamas are enrolled in private plans. In total, NIB provides a reasonably good level of coverage to the working and elderly population but compliance challenges with small businesses and self‐employed persons remain. 2.2.2 Adequacy Benefit Adequacy can be broken down into two components: Current adequacy: Are pensions adequate today? Future adequacy: Given current provisions, will the pension be adequate in the future? Current Adequacy
The minimum contributory pension in 2012/13 is $301 per month, approximately 20% of the average insurable wage. This is an acceptable minimum pension replacement rate. Although the actual dollar amount may be considered small by some, this level of income replacement provides an adequate level of protection to the elderly. This minimum pension is also applicable to Survivor spouse pensions even though the regular spouse pension is only 50% of the amount to which the deceased person would have been entitled. The biennial adjustments to the minimum rate and all pensions in payment, provides further support to maintaining benefit adequacy.
For pensioners receiving more than the minimum, their pension replacement rates are initially between 30% and 60% of their final average insurable wage, lower for highly paid persons. Given that they now receive regular pension adjustments, their benefits can also be considered adequate.
Although the recent increase in the number of contributions required for a retirement pension from 3 years to 10 years may be seen as negatively affecting adequacy, residents of The Bahamas who fail to qualify for the contributory Retirement benefit may qualify for a means‐ tested pension. And while there are some weaknesses in the means test, there remains adequate protection for lower income seniors.
Future Adequacy
A worker who has steady earnings below the wage ceiling and contributes to the NIB for a full career sustaining himself/herself predominantly from his employment earnings, can expect a pension of close to 60% of pre‐retirement earnings from NIB. By ILO and other international standards this is quite high and thus meets reasonable tests of benefit adequacy. The challenge quite often, especially for the self‐employed, is that many workers do not have steady wages and do not consistently work and contribute for 35 or 40 years.
Biennial ceiling adjustments and pension adjustments will ensure benefit adequacy both at the time of award and throughout the pension payout period as the pension maintains its initial purchasing power. The uncertainty of future benefit adequacy, therefore, relates only to those who have employment earnings well in excess of the wage ceiling and those who fail to contribute for at least 10 years.
When compared with targeted replacement rates for mandatory social security pensions in OECD countries, NIB Bahamas provides relatively high replacement rates. The significant difference between pensions in old age in the Bahamas compared with OECD countries is the additional pensions that most in OECD countries can look forward to – state means‐tested pensions to those at the lower end of the income scale and private pensions (employment linked or personal) for others. Given the low level of private pension participation and personal long‐term savings by workers in the Bahamas, the NIB pension will not be sufficient to meet all of the income needs to the majority of retired persons. The NIB pension is not intended to provide all of the income required to support oneself in old‐ age. Based on the above, current NIB contribution and benefit provisions provide pensions in old‐age that meet reasonable tests of future benefit adequacy. When non‐pension benefits are considered, the recent addition of Unemployment benefit has resulted in full income protection for all contingencies that lead to involuntary loss of employment income.
Financial Sustainability
Assessing the sustainability of a national pension system is complicated. Given the perpetual nature of these systems, the rules that apply to private pensions systems are not appropriate. Therefore, whether current reserves plus future contributions at the current contribution rate are sufficient to meet future expenditure should not be used to determine long‐term sustainability. Instead, assessing sustainability involves looking at the cost of the system now and in the future, and considering whether or not employers and workers in the future will be able to afford the cost. A definition of financial sustainability that has become widely used in social security discussions is whether the pension system is able to meet the needs of current generations without compromising the needs to future generations. By design, the NIF is partially funded and the current contribution rate is inadequate to meet future benefits. However, with higher contribution rates in the future, it is expected that expenditure will be met from a combination of current contributions and reserves.
It is not possible to determine today the highest contribution rate that workers and employers will be able to afford, or willing to pay, twenty to thirty years from now. With reserves not growing as fast as they have in previous years, and reduced rates of return on investments in this new low interest rate environment, contributions will have to account for the greater portion of future NIF income.
Based on regional and international comparisons, the NIB provides a relatively generous benefits package for a low contribution rate and thus its financial sustainability often comes into question. The key challenge for NIB regarding financial sustainability is determining when will be the right time to increase the contribution rate. Key risks associated with growing the Fund that could affect long‐term sustainability are continued high operating costs, low investment returns, imprudent use of reserves for non‐NIB purposes and the lack of political will to implement meaningful reforms in the future.
Work Incentives
Implicit incentives and disincentives to either remain working or claim Retirement benefit are found in both its eligibility conditions and the manner in which the benefit amount is calculated. The specific factors that could influence work decisions are: Reduced benefits if awarded between the ages of 60 and 65; No pension payable under age 65 if employment income exceeds 50% of the wage ceiling; and Increased benefits if awarded after age 65.
The recent reduction in the age at which workers can earn high wages and still receive NIB Retirement benefit from 70 to 65 is contrary to pension reforms being made around the world. However, the recent change in reduction factors from 4% to 7% for each year that the benefit
starts before age 65 offsets some of the extra payments now being made to persons who remain employed and claim the benefit after age 65. Administrative Efficiency The NIB continues to be a very inefficiently run organisation with 22% of contributions, or 2% of total insurable wages, going towards operating expenses. (See Section 5.4.2 for costs in several other countries.) Approximately 70% of operating costs are staff related. While the staff compliment has actually increased over the 5‐year review period, with further increases occurring in 2012, the Board is in the process of implementing a new Information Technology system designed to operate with a smaller staff complement. While this new system offers immense opportunities to improve service delivery, it will not be a financially feasible investment unless there is a significant reduction in staff.
In recent years several new initiatives were put in place to improve administrative efficiency. These include:
The Med‐4 form which requires an employer to certify the period an employee is off from work, resulted in a significant reduction in Sickness benefit claims after being introduced in 2009.
Strict adherence to the rules for payment of Medical Care and Disablement pensions resulted in a reduction in Medical Care costs and Disablement pension payments. Closer relationship with the Ministry of Finance, specifically re Business Licenses, where an NIB Letter of Good Standing is now required for the renewal of annual licenses, has boosted compliance. Diversification Security
Having more than one source of income enhances one’s confidence for being able to live comfortably in old age. With less than 30% of the workforce participating in private pension plans, and a much smaller percentage having other forms of retirement savings, a pension from the NIB is the only source of regular income for the majority of the elderly population. Ideally, there should be at least one other source of income in old age that is financed differently and possibly administered differently. Examples of other sources of income in old age found around the world include: State pensions for the elderly – tax financed Registered – individual plans with preferential tax treatments Mandatory savings plans – individual or employment linked and privately administered. Recommendations relating to each of these national pension policy objectives are presented in Chapter 5.
Chapter 3 Best‐Estimate Projections
Many demographic and economic factors, such as changes in the size and age structure of the population, economic growth, employment and wage levels and inflation, influence National Insurance finances. Therefore, to best assess the Fund’s long‐term costs and sustainability, projections of The Bahamas’ total population and the economy are required. For this review 60‐ year projections have been performed.
In developing all of the assumptions used for the projections, historical trends and reasonable future expectations, as well as the interrelationships between the various assumptions, have been taken into account. Core projections have been performed using assumptions that reflect best estimates. As a result, the set of demographic and financial projection results based on this assumption set is referred to throughout this report as “Best Estimate.”
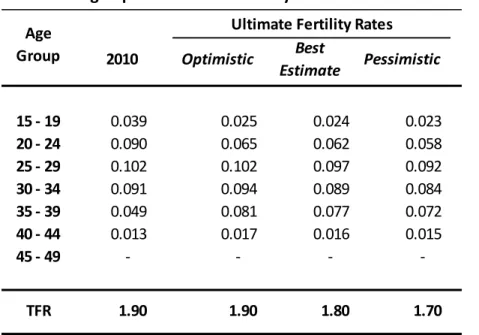
Given the significant uncertainty inherent in forecasting such a long period, projections have also been performed using two additional sets of assumptions. These alternative projection sets, which encompass assumptions that are generally more optimistic and more pessimistic than best‐estimate assumptions, are labelled “Optimistic” and “Pessimistic”, given the implications for future NIF finances. Results of these projections are presented in Chapter 4.
3.1
Population Projections
3.1.1 Assumptions Projections of The Bahamas’ population begin with the results of the 2010 census and in each projection year thereafter, fertility, mortality and migration assumptions are applied. Fertility rates are used to estimate the number of births each year while mortality rates determine how many, and at what ages, people are expected to die. Net migration represents the difference between the number of persons who permanently enter and leave The Bahamas and is the most volatile of the three factors. The 2010 population census placed The Bahamas’ population at 351,461.
The total fertility rate (TFR) represents the average number of live births per female of childbearing age in a particular year. If there is no migration, a TFR of 2.1 is required for each generation to replace itself. The Bahamas TFR was estimated at 1.94 in 2010 having averaged 1.98 between 2000 and 2010. For these projections it is assumed that TFR’s in The Bahamas will remain below replacement level, falling to an ultimate rate of 1.8 in 2020.
Using mortality rates from The Bahamas Abridged Life Tables, 1999‐2001, current population estimates and the number of deaths in the past few years suggest life expectancy at birth in 2011 of around 71 for males and 77 for females. Improvements in life expectancy are assumed to occur in accordance with UN estimates.
The third factor that affects population size is migration. This is the most volatile and most difficult to measure. Using the 2000 and 2010 census counts, and reported births and deaths between censuses, implied net in‐migration between 2000 and 2010 is estimated at around 1,200 per annum.
The economic assumptions used for this report assume stable and positive economic growth and labour productivity in all years. Although simplistic, they approximate usual economic cycles and volatility that encompass periods of expansion and recession. They also account for projected changes in the population and labour force that will provide the capacity for additional output through more workers and increased productivity (real wages).
The following table indicates the principal demographic and economic best‐estimate
assumptions for this and the previous Review. Further details may be found in Appendix B. Table 3.1. Principal Demographic & Economic Assumptions 9th Actuarial Review 8th Actuarial Review Total Fertility Rate 1.94 in 2010 decreasing to 1.80 in 2020 2.0 in 2000 decreasing to 1.75 in 2020
Mortality Improvements^ Slow Slow
Net In‐Migration Per Annum 500 decreasing to 450 in 2030, to 400 in 2040, constant thereafter 500 in all years Real GDP Growth Rates Short‐term Med.‐term Long‐term 2.50% 2.00% 1.25% 3.10% 2.50% 1.25% Real Increase in Wages 0.75% 1.0% Inflation 2.50% 2.75% ^ UN mortality improvement rates 3.1.2 Projection Results From the 2010 Census population of 351,461 and with the above assumptions, The Bahamas’ population is projected to increase to over 470,000 in the mid‐2060’s,
Figure 3.1. Projected Bahamas Population (BestEstimate scenario)
For NIB, while projected future population size is important, the age distribution is more critical, as pensions to the elderly represent the bulk of expenditure and contributions will be paid by those in the working‐age groups. For the projections under these best‐estimate assumptions, the anticipated ageing pattern is highlighted in Table 3.2 which shows the age distribution of the population and ratio of the number of working‐age people for each person of pension age. This ratio is projected to decrease from 10.6 in 2010 to 2.6 in 2075. Table 3.2. Projected Population, 2010 to 2071 2010 351,461 100,735 229,038 21,688 10.6 2015 369,944 97,939 246,288 25,717 9.6 2020 387,020 94,273 261,236 31,511 8.3 2025 403,230 90,912 271,992 40,326 6.7 2030 418,703 91,072 275,734 51,897 5.3 2035 432,626 92,707 277,606 62,313 4.5 2040 443,885 93,502 277,460 72,923 3.8 2045 452,095 92,532 279,593 79,969 3.5 2055 460,821 88,501 285,405 86,915 3.3 2065 464,203 87,546 280,771 95,886 2.9 2075 464,716 87,103 273,444 104,168 2.6 Ratio of Persons 16‐64 To 65 & Over Age 65 & over Year Total Age
0 ‐ 15
Age 16 ‐ 64
3.2
National Insurance Projections
Best Estimate National Insurance Fund demographic and financial projections have been modelled using the best‐estimate population results, best estimate NI‐specific assumptions and the contribution and benefit provisions that were in place on January 1, 2012, with provisions made for the amendments that took effect in July 2012. Automatic biennial adjustments to the wage ceiling and pensions have been assumed. 3.2.1 Assumptions Key National Insurance assumptions are shown below.
Table 3.3. National Insurance Best Estimate Assumptions
9th Review 8th Review Avg. Contribution Rate* 9.2% up to June 2013, 9.75% thereafter 8.43% in all years Insurable Wage Ceiling increases 7% every 2 years From $400 p.w. to $600 in 2009 then annually by inflation +1% Short‐term Benefits Increases from 1.45% to 1.5% of insurable wages over 20 years Increases from 1.1% to 1.25% of insurable wages over 60 years Employment Injury Benefits Increases from 0.4% to 0.5% of insurable wages over 20 years Increases from 0.45% to 0.55% of insurable wages over 60 years
Pension Increases 5.0% every 2 years Annually by price inflation Long‐term Yield on Reserves 4.5% 5.0% Admin. Expenses as a % of Insurable Wages 2.0% of Insurable wages Decrease from 1.25% to 1.0% of Insurable wages over 20 years
Other Expenses 0.4% of insurable earnings 0.08% of insurable earnings
New Assistance Pensions Decreasing from 270 to 130 per annum over 10 years 75 females and 50 males per annum *Pensionable civil servants contribute at a lower rate on wages above $110 per week until June 2013
With the recently introduced automatic wage ceiling and pension adjustments, it is being assumed that the prevailing level of coverage and income security made possible by the wage ceiling and the minimum pension will be generally maintained throughout the projection period.
3.2.2 Projection Results
For accounting purposes, NIF finances are separated into the Short‐term, Industrial, Pensions and Medical Benefits Branches. However, provisions exist for transferring reserves between branches and changing income allocations. Therefore, shortfalls in one branch may be met from surplus reserves of another. For this report, the projections of the four branches have been consolidated so that the complete financial picture may be shown.
It should be noted that reserves of the Medical Benefits Branch (MBB) are not expected to be available for the payment of benefits. However, in 2009 when Unemployment benefit was added to the benefits package, $20 million was transferred from the MBB to the Short‐term Benefits Branch and since 2011, expenses of the National Prescription Drug Plan have been met by the MBB. For the sake of easy comparison with financial statements and actual experience, these projections encompass the full NIF, including the MBB. The December 2011 (starting‐ point) reserves used for these projections is $1.65 billion. Due to a change in accounting standards and the staff pension plan being in a deficit position, reserves at the end of 2012 have been adjusted downwards by $40 million.
The charts in Figure 3.2 highlight key projection results of the Best Estimate scenario assuming that the contribution rate is not increased and that there are no changes to benefit rules.
Figure 3.2. Projection Results – Best Estimate Scenario
‐0.5 0.0 0.5 1.0 1.5 2.0 2011 2016 2021 2026 2031 Projected Reserves (billions of $'s) 0% 5% 10% 15% 20% 25% 30% 2011 2021 2031 2041 2051 2061 2071 Projected Pay‐As‐You‐Go Rates ‐2 0 2 4 6 8 2011 2016 2021 2026 2031 Projected Reserve‐Expenditure Ratio 0 50,000 100,000 150,000 200,000 250,000 2011 2021 2031 2041 2051 2061 2071 Projected Contributors & Pensioners Pensioners