Sweden’s national allocation plan for emission allowances 2008-2012
1. Introduction
The EU’s greenhouse gas emission allowance trading scheme (EU ETS) has been in operation since 1 January 2005 and is based on the initial allocation of transferable allowances to installations covered by the scheme. At present, the scheme covers emissions of carbon dioxide from combustion installations and certain energy-intensive industry. Article 9 of Directive (2003/87/EC) of the European Parliament and of the Council of 13 October 2003 establishing a system for greenhouse gas emission allowance trading within the Community and amending Council Directive 96/61/EC stipulates that all EU Member States shall develop a national allocation plan in advance of each new trading period, which is consistent with the criteria listed in Annex III of the aforesaid Directive. After issuance, the allowances can be used to meet the obligation of the companies concerned to surrender annually an amount of allowances equal to the verified emissions from the respective installation. According to the principles of this plan, unlike the allowances issued during the period 2005-2007, companies will be able to save unused allowances issued during the period 2008-2012 in order to meet their obligations in subsequent trading periods.
Other differences in the present allocation plan compared with the allocation plan published in spring 2004 for the initial trading period (2005-2007) are that the allocation this time is for a five-year period (2008-2012) instead of three years and that the EU Member States have commitments according to the Kyoto Protocol to limit the country’s total emissions of greenhouse gases to an agreed level during the same period. Accordingly, the quantity of allowances allocated must be wholly consistent with the country’s planned fulfilment of its commitments according to the EU burden sharing agreement and the common commitment. Allowance trading enables the actual emissions to be redistributed between installations in the trading scheme in order to
Memorandum
31 August 2006
Ministry of Sustainable Development Courtesy translation 15 September 2006
carry out the necessary emission reductions in a cost-effective way without jeopardising neither the particular country’s ability to meet its quantitative commitment nor the policy instrument’s impact on climate. Allocation of allowances to operators in Sweden takes place after application. The installations concerned will be able to apply to the Swedish Environmental Protection Agency for allocation of allowances. A council consisting of representatives from the Swedish Environmental Protection Agency, the Swedish Energy Agency and the Swedish Agency for Economic and Regional Growth (Nutek) will then process the companies’ applications and submit a proposal for allocation to the Swedish Environmental Protection Agency. This processing takes place on the basis of the provisions of the Emissions Trading Ordinance (2004:1205). After the Swedish allocation plan has been scrutinised by the Commission, and the Government has stipulated the total number of allowances to be allocated, the Environmental Protection Agency will make a final decision on allocation of allowances to each particular installation that has submitted an application.
1. Assessment of the total quantity of allowances to allocate to Swedish installations during the period
1.1. Sweden’s commitment to limit emissions of greenhouse gases in accordance with the Kyoto Protocol and EU burden sharing
By ratification of the Kyoto Protocol, the EU and its Member States have undertaken, on average during the first commitment period of the Protocol (2008 to 2012), to reduce their greenhouse gas emissions by eight per cent compared to the level in 1990. This common commitment for the whole of the EU has been divided between Member States after negotiations, in an internal burden sharing (Council Decision 2002/358/EC). For Sweden, the agreement means that the emissions of the greenhouse gases regulated in the Kyoto protocol are to be limited to at most 104 per cent compared to the 1990 level.
Under the guidelines of the Kyoto Protocol, the parties shall send a report, at the latest by 31 December 2006, to the UN Framework Convention on Climate Change to establish the assigned amount based on the emissions during the base year. In January 2006, Sweden presented material to the European Commisison, including calculations of the quantity assigned to Sweden, which will be compiled with data from the other Member States and reported in aggregate form to the Convention. According to this emission inventory, Swedish emissions of greenhouse gases amounted to 71,809,610 tonnes of carbon dioxide equivalents in 1990 excluding the fluorinated gases. In order to establish the assigned amount, 1995 was used as a base year for emissions of fluorinated gases, which amounted to 642,438 tonnes of carbon dioxide
equivalents in that year. Sweden’s share of the EU’s common undertaking in accordance with the burden sharing agreement permits, taking into consideration the updated base year statistics, that greenhouse gas emissions in Sweden may amount to at most 75,350,130 tonnes of carbon dioxide equivalents per year on average during the first commitment period of the Protocol (2008-2012).1
Sweden annually submits a report on its emissions of greenhouse gases to the European Commission in accordance with the Decision 280/2004/EC. According to the most recent summary of reports by Member States made by the Commission, emissions of greenhouse gases in Sweden totalled 70.6 million tonnes of carbon dioxide equivalents in 2003, which is to be compared with emissions of 72.5 million tonnes of carbon dioxide equivalents in 19902. Emissions have accordingly decreased by 2.6 per cent since the base year.
The Kyoto Protocol and the Marrakech Accords enable the parties to include absorption of carbon dioxide in carbon sinks. Every party is obliged to include absorption and emissions of carbon dioxide pursuant to Article 3.3 of the Protocol due to land use changes. Furthermore, the Parties may include absorption of carbon dioxide from ongoing land use. The Government has decided that Sweden is to apply Article 3.4 in the case of absorption of greenhouse gases in carbon sinks in forest and forested land but not in arable and pasture land and new vegetation. Under Article 3.4 of the Kyoto Protocol and the Marrakech Accords, Sweden can be credited with an additional 2.12 million tonnes of carbon dioxide absorption from growing forest and in forested land. The Swedish commitment thus means that greenhouse gas emissions may amount to at most 77.5 million tonnes of carbon dioxide equivalents annually during the period 2008 to 2012.
If the estimated amount of credits from government investments in the project-based mechanisms (Joint Implementation, JI and Clean Development Mechanism, CDM) are added, the total amount of emissions available to Sweden would increase by around an additional 1.1 million tonnes of carbon dioxide equivalents per year during the period 2008-2012. In general, this means that if emissions in the non-trading sector develop in accordance with the projection presented in the following section, approximately 33-34 million tonnes of carbon dioxide will be available for allocation to the trading sector in Sweden without
1 Swedish Environmental Protection Agency, Sweden’s Initial Report under the Kyoto
Protocol, Calculation of Assigned Amount, January 2006 2 KOM(2005)655 Final
jeopardising the ability to meet the quantitative commitment according to the Kyoto Protocol and the EU burden sharing (criterion 1)3.
1.2. Method to determine the total quantity of allowances allocated
The total quantity of allowances to allocate to Swedish installations through the principles presented in this plan has been decided upon by the Government taking into consideration a strict application of the criteria in Annex III of the Emissions Trading Directive. According to the Parliament’s decision of 2 June 2006 (Government Bill 2005/06:184, bet. 2005/06:MJU15, rskr. 2005/06:134), the allocation for 2008-2012 should not exceed the estimated emissions according to the BAU projection for the ETS sector during the same period. It was furthermore stated that an aim should be for the annual allocation not to exceed the annual allocation in the initial period 2005-2007, although taking into account the expanded application of the Directive in Sweden to cover more sources of emissions not previously included.
The projection for the Swedish emissions of greenhouse gases in 2010 (corresponding to an average for the period 2008-2012) is based on the material provided by the Swedish Energy Agency and the Swedish Environmental Protection Agency in connection with the domestic climate policy Checkpoint 20044. This material has been further processed by both agencies in 2005 in order to take into consideration changed prerequisites and to reflect the most probable development up to 20105. It is mainly the macroeconomic development, the high rate of growth in energy-intensive industry and the assumptions on crude oil price movements that have changed the prerequisites in relation to the assessments made for the previous forecast. Furthermore, certain sensitivity calculations have been included due to the possibility of the oil price being higher than originally assumed. The prerequisites have also been revised to take into consideration the policy instruments and measures introduced after the projection in Checkpoint 2004 had been calculated. All in all, this means that the Swedish emissions are estimated to total around 71.7 million tonnes of carbon dioxide equivalents in 2010 (see Table 1).
If the proposals announced by the Government in various bills in the area of energy, transport and climate policies during 2006 are also included, the annual emissions are expected, according to the Swedish
3 Annex III of Directive (2003/87/EC) establishing a scheme for greenhouse gas emission allowance trading within the Community (http://eur-lex.europa.eu/LexUri Serv/LexUriServ.do?uri=CELEX:32003L0087:EN:HTML)
4 The Swedish Energy Agency’s and the Swedish Environmental Protection Agency’s material for Checkpoint 2004, Projections on emissions of greenhouse gases, in Swedish 5 Swedish Environmental Protection Agency and Swedish Energy Agency, Updating of
Energy Agency’s estimate, to amount to 70.4-70.8 million tonnes of carbon dioxide equivalents in 2010, i.e. a further reduction of 0.9-1.3 million tonnes of carbon dioxide equivalents. These additional measures include an increased proportion of diesel which is mixed with rape methyl ester, investment support for conversion of heating systems, instruments to promote vehicles with renewable fuels and a continued introduction of speed cameras on the roads.
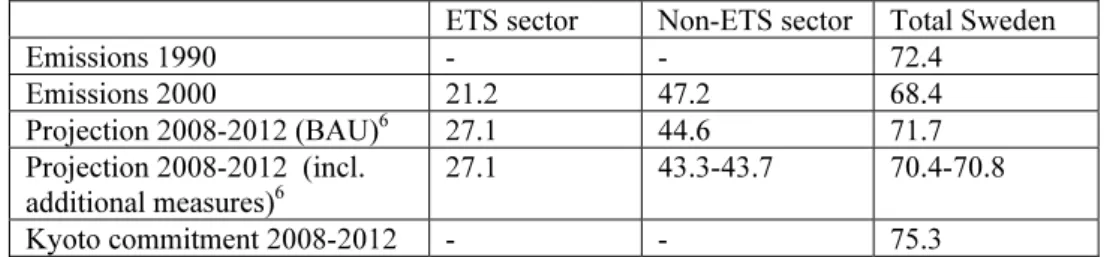
Table 1. Emissions of greenhouse gases in 1990 and 2000 and projected emissions for 2010 broken down by the trading and non-trading sector respectively in Sweden (million tonnes of carbon dioxide equivalents per year)
As shown by this presentation, the volume of the Swedish emissions of greenhouse gases during the period 2008-2012 will be less than the commitment to restrict emissions made by Sweden in accordance with the EU burden sharing agreement. It is therefore other criteria in Annex III of the Directive than criterion 1 on consistency with the international climate commitment that limits the total number of allowances that can be allocated to Swedish installations. According to criterion 2, the allocation is to be consistent with actual and projected progress towards fulfilling the commitment and it may therefore not exceed the estimated emissions during the period. The projection produced by the Swedish Energy Agency and the Swedish Environmental Protection Agency includes an assessment of the technical and economic potential for reducing the emissions of greenhouse gases from the various sectors of society. This contributes to fulfilment of criterion 3. All in all, this means that the projection on carbon dioxide emissions in the ETS sector stated in Table 1 corresponding to 27.1 million tonnes of carbon dioxide per year represents an upper limit for the average allocation to the trading sector in Sweden during the period 2008-2012 taking into account the criteria in Annex 3 of the Directive. According to the presentation made in section 1.3 of this plan, the intended annual allocation to Swedish installations in the period 2008-2012 totals 25.2 million tonnes of carbon dioxide per year, which is less than the projected level by a broad margin (7 per cent). In the light of the domestic climate target, Sweden has decided to go further as regards limitation of the number of allowances that will be issued than would be required by the criteria in the Directive.
6 The projection for 2010 represents an assumed average for emissions 2008-2012. ETS sector Non-ETS sector Total Sweden
Emissions 1990 - - 72.4 Emissions 2000 21.2 47.2 68.4 Projection 2008-2012 (BAU)6 27.1 44.6 71.7 Projection 2008-2012 (incl. additional measures)6 27.1 43.3-43.7 70.4-70.8 Kyoto commitment 2008-2012 - - 75.3
The European Commission notes in its further guidance on the Member States’ allocation plans for the second trading period that a considerable number of the EU Member States have significant gaps to close to fulfil their commitments for the period 2008-2012 and that a number of these countries must reduce their allocation to meet their Kyoto targets7. It is underlined in the same guidance that other countries may need to retain the same cap as during the first period to align the plan with the potential to reduce emissions (criterion 3). The total allocation of allowances approved by the European Commission to be issued to Swedish installations included in the trading scheme during the period 2005-2007 amounts to an average equivalent of 23.2 million tonnes of carbon dioxide per year.
A number of new emission sources are included in the scheme for the period 2008-2012 due to amendments in the Emissions Trading Ordinance (2004:1205)8. This affects certain installations with combustion processes that are not directly categorised under the industrial activities listed in Annex 1 of the Directive. This expansion is taking place in line with the guidance notified by the Commission in December 20057, the primary intention being to achieve a harmonisation of the scope of the emissions trading scheme in the internal market by aiming for a uniform and consistent application of the Directive by different Member States. The additional emissions in the trading sector from installations covered by this expanded application of the concept of combustion installation total around 2 million tonnes of carbon dioxide per year during the period 2008-2012. A more detailed description of the activities concerned is contained in section 1.2.7.
According to the guidelines specified in Government Bill (2005/06:184) for establishment of a Swedish allocation plan for the period 2008-2012, any supplements that take place in the allocation, over and above the aforesaid redistribution of emissions between the ETS and the non-ETS sector as a result of the expanded definition of the concept of combustion installation, are to be balanced by new measures to reduce emissions in the non-trading sector by the corresponding volume even if this is not required taking into account the country’s international commitment. The scope expected to arise as a result of the further measures in the non-ETS sector described above has, however, not led to any increased allocation to the ETS sector when establishing the total allocation level for 2008-2012.
The data collected in autumn 2006 in connection with companies applying for allocation of emission allowances will serve as the basis for
7 COM (2005)703, p.14
8 Ordinance (2006:645) amending the Emissions Trading Ordinance (2004:1205) came into force on 1 July 2006 and the new emission sources are included in the scheme from 1 January 2008
establishment of the allocation to each particular installation although it will not affect the total quantity of allowances as specified in this plan. A rule is being introduced for scaling down the allocation for certain activities in those cases where the total quantity allocated after application adds up to an amount in excess of the amount allotted for incumbents in the plan.
1.2.1. Sweden’s climate policy
Sweden has applied programmes and measures intended to limit emissions of greenhouse gases since 1988. Sweden’s present climate strategy was adopted by the Parliament in March 2002 (Government Bill 2001/02:55, bet. 2001/02:MJU10, rskr. 2001/02:163) and constitutes an updating of goals and a further development of measures already applied. According to the Parliament’s decisions in 2002 and 2006, the Swedish emissions of greenhouse gases for the period 2008-2012 are to be at least four per cent lower than the emissions in 1990, i.e. to amount to at most 69.6 million tonnes of carbon dioxide equivalents per year. This national target is to be achieved without compensation for carbon sinks or by flexible mechanisms.
In Government Bill (2005/06:172), the Government suggests that Sweden shall continue to play a leading role in international climate policy by decreasing national emissions and lay the basis in global collaboration for a long-term international regime to limit the impact on climate globally. Energy and climate issues are intimately related and the Government sees many advantages in developing an integrated energy and climate policy within which the EU emissions trading scheme has a powerful role.
Checkpoints have been introduced in 2004 and 2008 to monitor the Swedish climate management and the national climate target. The goal is to be subsequently followed up at checkpoints at least every fifth year. The latest review (Checkpoint 2004) included a possible reconsideration of the climate target. On 16 July 2006, the Parliament decided (Government Bill 2005/06:172, bet. 2005/06:MJU14, rskr 2005/06:389) to uphold the target that had been previously set. This means that the Parliament decided not to supplement the existing national climate target for 2008-2012 with a target that would include use of the flexible mechanisms. A reconsideration of the target’s formulations in relation to the flexible mechanisms is to take place at the latest in connection with Checkpoint 2008. In the Government Bill, the Government made proposals for a number of new policy instruments and measures with a view to ensuring fulfilment of the national climate target, which, among other things, entails a continuation of the climate investment programme, an extension of the electricity certificate system to 2030, investment support for conversion from direct electric heating and
oil-based heating in housing and a shift to a carbon dioxide-differentiated vehicle tax.
According to criterion 1 in Annex III of the Trading Directive, the total allocation should be consistent with the national climate change strategy. The allocation specified in the plan is consistent with the domestic climate target in the event of a deduction against the total amount of allocated allowances and projected emissions in the non-ETS sector. The aggregate allocation (25.2 million tonnes of carbon dioxide per year) and the most recent projection for emissions of greenhouse gases in the non-ETS sector (43.5 million tonnes of carbon dioxide equivalents per year) total 68.7 million tonnes of carbon dioxide equivalents, which is lower than the emission level entailed by Sweden’s national climate target (69.6 million tonnes of carbon dioxide equivalents per year).
However, it should be noted in this context that the Swedish allocation of allowances only affects the actual emissions from these installations to a very limited extent and thus the possibilities of meeting the domestic target. At the same time, as there is an evident link between the total allocation and actual emissions at the EU level, the impact of the trading scheme on the installation level and the national level primarily depends on the price of allowances and relative differences in the installations’ marginal cost curves for emission reductions. By deciding on a quantity of allowances consistent with the national target, there is, however, greater freedom of choice as regards a national target for the period 2008-2012 which also includes use of the flexible mechanisms, which shall be given consideration at the latest in connection with Checkpoint 2008.
1.2.2. Sweden’s energy policy
Swedish energy policy aims at securing a reliable supply of electricity and other forms of energy at internationally competitive prices. It should create conditions for efficient and sustainable energy use, as well as a cost-effective Swedish energy supply, with minimum negative impact on health, the environment and the climate. It should also facilitate the transition to an ecologically sustainable society.9 According to the guidelines for national energy policy (Government Bill 2001/02:143, bet. 2001/02:NU17, rskr. 2001/02:317), the annual use of electricity produced with renewable sources of energy is to increase by 10 TWh to 2010 compared with the level in 2002. Furthermore, there is a planning target to create the prerequisites to establish 10 TWh of wind power by 2015.
9 Government Bill (2001/02:143) on collaboration for a secure, efficient and environmentally friendly electricity supply
On 1 May 2003, the Swedish electricity certificate system was introduced, which is a market-based policy instrument, aiming to promote electricity production from renewable sources of energy. The system is based on producers of renewable energy being granted certificates in proportion to their production which are then demanded by electricity consumers who are obliged to be able to present a certain number of certificates in relation to their electricity consumption. In this way, the renewable forms of energy are exposed to competition and a market price is established for certificates corresponding to the lowest support requirement needed to comply with the level of ambition in the system, which increase over time. The Parliament has decided (Government Bill 2005/06:154, bet. 2005/06:NU17, rskr. 2005/06:141) to extend the electricity certificate system to 2030. This has been taken into consideration in connection with the most recent updating of the projections. However, it should be noted that the decrease in emissions resulting from the certificate system largely takes place in other countries with which Sweden shares the same electricity market since the fossil-based component of Swedish energy production is small.
As part of the transition of the energy system, Swedish nuclear power is to be decommissioned at the rate possible taking into account the need for electric power to maintain employment and welfare. The subsequent loss of capacity is to be replaced by more efficient use of electricity, conversion to renewable forms of energy sources and environmentally acceptable electricity production technology. In 1997, the Parliament decided that the conditions for phasing out the two nuclear power reactors at Barsebäck had been met. The first reactor was shut down on 30 November 1999 after an agreement on compensation had been reached between the state and the owners. The Government decided in December 2004 pursuant to the Phasing-out of Nuclear Power Act (1997:1320) to shut down the second reactor at the Barsebäck plant which took place on 31 May 2005.
International climate-related contributions motivated by energy policy are an important part of Swedish energy policy and the strategy for reducing the impact on climate by the energy sector. These contributions are mainly focused on bilateral and multilateral collaboration relating to the Kyoto Protocol’s project mechanisms, Joint Implementation (JI) and the Clean Development Mechanism (CDM), see section 1.2.3.
The Parliament has decided (Government Bill 2005/06:145, bet. 2005/06:BoU9, rskr. 2005/06:141) to introduce a national programme for improved energy efficiency and energy-smart construction targeted on industry, the public sector, the construction and property sector and individuals. The goal is to reduce specific energy use per area of premises in buildings by 20 per cent by 2020 and 50 per cent by 2050 in relation to the level in 1995. This is to take place, in among other ways, by an Act on energy declaration for buildings.
In December 2005, the Government appointed a special commission with the task of being the Prime Minister’s forum for discussion and analysis of the strategic issues required to create the prerequisites for the country to be able to overcome its dependence on oil by 2020. The Commission has been chaired by the Prime Minister and presented its report on 28 June 2006 with a number of concrete proposals for measures based on the specific prerequisites of various sectors to reduce emissions. The Commission has also included representatives of the business sector, interest organisations and universities. The proposals in the strategy include an increased yield of energy forest, pilot installations for production of the second generation of biofuels, environmental classification based on fuel efficiency, increased support for research and development, more stringent building regulations, public tendering and establishment of a special centre for energy efficiency. It is not intended to replace all use of oil by 2020 but to ensure that competitive alternatives to oil are available by that date for all kinds of manufacture and transport.10
More efficient use of energy and promotion of renewable energy sources are very important for the ability to overcome dependence on fossil fuels and limit the impact on the climate. The Government has therefore proposed a number of measures relating to various sectors of society with a view to developing a cost-effective and integrated energy and climate policy.
1.2.3. The project-based flexible mechanisms of the Kyoto Protocol
The two project-based flexible mechanisms of the Kyoto Protocol are central components of the international work to counteract climate change. Sweden’s contributions in this area aim at developing the mechanisms into credible and efficient tools in the international climate regime. Sweden started pilot activity as early as 1993 within the framework of a pilot phase for joint implementation (AIJ) with the intention of participating in the development of institutions and procedures for joint implementation (JI). The Swedish programme for international climate investments (SICLIP) has been in existence since 1997 consisting of both direct investments in the project mechanisms and regional climate collaboration through climate projects in the Baltic Sea region (Testing Ground Facility).
The Swedish Energy Agency is responsible for the investments within SICLIP which at present consist of projects in South America, Asia, Central and Eastern Europe. SICLIP has had over SEK 190 million at its disposal of the government funds totalling SEK 350 million which were set aside for international climate policy measures for the period
10 The Commission on Oil Independence, Towards an Oil-free Sweden, in Swedish, June 2006
2004 in connection with the 1997 energy policy decision. Agreements have been reached with project owners for three projects in Brazil and one project in India in the biofuel area within the Clean Development Mechanism. Projects are in process in Romania for combined power and heating and in Estonia for wind power within the Joint Implementation Mechanism.
Sweden is also taking part in the World Bank’s Prototype Carbon Fund (PCF), which has served as an important example for development of projects within the framework of the Kyoto Protocol’s project-based flexible mechanisms and the regulatory framework for these. The Swedish grant amounts to 10 million US dollars. The fund is intended to develop knowledge and routines by contributing to investments in various types of climate projects in countries with transitional economies and in developing countries.
Through the Government decision of 30 June 2006, Sweden is to take part and invest in the European Bank for Reconstruction and Development’s (EBRD) climate fund, the Multilateral Carbon Credit Fund. The Swedish contribution to the fund totals SEK 18.6 million and primarily relates to projects in improved energy efficiency and renewable energy in some of the countries with transitional economies in which the bank operates.
The government commitment in all of the above-mentioned programmes and projects is calculated together to obtain CERs and ERUs equivalent to around 5.7 million tonnes of carbon dioxide equivalents by 2008-2012, which is equivalent to over 1.1 million tonnes of carbon dioxide equivalents per year during the period.
1.2.4. Cross-sector policy instruments
Carbon dioxide and energy taxation
Sweden has applied a general energy tax since the 1950s and a carbon dioxide tax since 1991 to relate the energy taxation system more clearly to the environment. The general level of carbon dioxide tax has been continuously raised since its introduction and there are special reduction rules for industry and fuels used for electricity production. Differentiation of the tax since 2004 has moreover been designed to favour establishment of co-generation of electricity and heat.
In 2000, the Parliament decided on a green tax shift which entailed increased tax on environmentally-damaging activity and a reduction of tax on work. According to the decision, a total of SEK 30 billion is to be tax shifted over a ten-year period. This has led to an increase in the carbon dioxide tax in several sectors and the general level is at present SEK 910 per tonne of carbon dioxide. The carbon dioxide tax has had a
considerable impact on emissions of carbon dioxide which is particularly clearly shown in fuel use in the district heating sector.
The Government has proposed in the Budget Bill for 2006 that carbon dioxide tax is to be reduced in a first step for the activities covered by the EU scheme for emission allowance trading. The reason for this is that emissions from these industries are already subject to a cap for emissions at the systemic level which means that additional charges will not have any impact in terms of further reduction of emissions in the trading scheme but only lead to a weakening of competitiveness and a redistribution of emissions between different installations. The cost-effectiveness of the trading scheme is based on a levelling-out of the marginal cost of emission reduction between countries and sectors ideally in order to correspond to the uniform allowance price in the scheme. Applying a carbon dioxide tax in parallel with the trading scheme for the same group of installations leads to a departure from this principle. The installations in the trading scheme that are intended to be completely exempt from carbon dioxide tax are industries and particularly efficient co-generation plants. For other installations, there will be downward adjustment of the carbon dioxide tax by SEK 120 per tonne of carbon dioxide. The assessment is made that this change in the carbon dioxide tax will have some impact on the Swedish emissions and this has been taken into account in the updated emission projections.
The Environmental Code
The Swedish Environmental Code was introduced on 1 January 1999 and contains large parts of the legislation in the field of the environment. The Code includes provisions on using the best possible technology in professional activities, conservation of raw materials and energy and giving preference to renewable energy sources. In its interim report Trading for a better climate – trading with allowances 2005–2007 etc. (SOU 2004:62), the parliamentary FlexMex2 delegation proposed that the installations covered by the EU scheme for emission trading should be exempt from the provisions of the Environmental Code as regards energy conservation and use of renewable fuels. The Environmental Code also places conditions on emissions of greenhouse gases by activities from installations that are not covered by the EU emission allowance trading scheme. It is difficult to estimate the impact of the Environmental Code on emissions since few permit decisions have been made where climate and energy aspects have been taken up.
The Climate Investment Programme (Klimp)
The Climate Investment Programme was introduced in 2002. It is a government support programme intended to stimulate local government and other players to make long-term investments in measures that reduce emissions of greenhouse gases. Altogether, funds equivalent to SEK 1,040 million were distributed through the programme during the period 2002-2006. As a result of decisions in the Parliament
(Government Bill 2005/06:172, bet. 2005/06:MJU14, rskr. 2005/06:144), the programme has been reinforced by SEK 200 million for 2006 and extended by annual funds of SEK 320 million for the period 2007–2008. The projects undertaken as a result of the Climate Investment Programme are estimated to bring about a reduction in emissions of around 0.4 million tonnes of carbon dioxide equivalents per year11. According to the regulatory framework, it should not be possible to obtain grants for projects aiming to reduce emissions of greenhouse gases within the ETS sector12.
1.2.5. Measures in the non-ETS sectors
The projection produced by the authorities in connection with the updated calculation from the first checkpoint indicate that the Swedish emissions of greenhouse gases will decrease by 1.0 per cent by 2010 compared with the level for 1990. This decrease is taking place above all in the housing and service sector and within the agricultural and waste sectors (see Figure 1). A brief review of the measures considered to have the most impact on emission in the non-ETS sector by 2008-2012 is presented below. 0 5 000 10 000 15 000 20 000 25 000 1990 1992 1994 1996 1998 2000 2002 2004 2006 2008 2010 [ T h o u sa nd to n nes CO 2-eq uiv /y e ar ] Transport
Electricity and district heating production including refineries, coking plants etc. Industrial combustion
Housing and service sector
Agriculture
Industrial processes
Waste
Solvents
Figure 1. Historical and projected emissions of greenhouse gases, 1990-2004 and 2010 by sectors in accordance with the categorisation in reports to the UN Framework Convention on Climate Change13.
11 The Swedish Energy Agency and the Swedish Environmental Protection Agency,
Evaluation of Policy Instruments in Climate Policy, in Swedish, Interim Report 2 of material for Checkpoint 2004
12 NFS 2005:8
13 The Swedish Environmental Agency and the Swedish Energy Agency, Update of the
Measures in the housing and service sector
Emissions of greenhouse gases from the housing and service sector are estimated to decrease by 42 per cent between 2000 och 2010. Among the reasons for this development are the carbon dioxide tax (which at present amounts to approximately € 100 per tonne of carbon dioxide), increased use of biofuels in houses and continued expansion of district heating networks. In recent years, a number of new measures have been undertaken to increase energy efficiency and reduce emissions from heating in premises and housing. These include government support for energy-saving measures and conversion to renewable energy in public premises and tax reduction for installation of energy-efficient windows in houses and installation of biofuel boilers in newly-built housing. In addition, the sector is one of the sectors that can obtain grants from the climate investment programme (Klimp), see section 1.2.4.
Measures in the transport sector
Emissions of carbon dioxide from the transport sector are estimated to increase by 13 per cent between 2000 and 2010 due to increased use of, in particular, diesel fuel in heavy road transport. This is the case despite measures leading to a continued increase in the share of renewable vehicle fuels and in the number of environmental vehicles. The measures whose impact has been assessed in connection with the establishment of the projection for emissions of greenhouse gases in 2010 include the Government’s decision on a change in the tax rules for diesel cars with particle filters and an environmental rearrangement of vehicle taxation. It has furthermore been assumed that all petrol sold will contain five per cent ethanol fuel blend which is in practice already the case today. This contributes to emissions from petrol being expected to be relatively unchanged during the specified period. However, Sweden is working for the EU Fuel Quality Directive to be amended to permit up to ten per cent ethanol being blended with all petrol in the future.
Since 2004, carbon-dioxide neutral fuels have been exempt from carbon dioxide tax and energy tax in Sweden. This exemption from excise duty applies for five years, the intention being that these fuels will continue to be competitive in relation to conventional fuels in the market after this period. Today, more than every tenth new car sold is an environmental car and on 1 February 2006, a new law was introduced stating that all petrol stations that sell more than a specified volume of fuel per year must provide at least one renewable fuel. In June 2006, the Swedish Oil Commission proposed a number of measures with a view, among other things, to making energy use by the vehicle fleet more efficient, improving public transport and stimulating use of biofuel.
Some of the underlying reasons for the projected increase of greenhouse gas emissions by the transport sector to 2008-2012 are an increasing
population in combination with increased income and increased employment, along with an increased need for transport apace with industrial growth.
Measures in the agricultural and waste sectors
A continuous decrease of emissions of greenhouse gases is taking place in the agricultural sector owing, among other things, to continued reduced livestock keeping and use of mineral manure. In 2004, emissions by agriculture (excluding emissions from agricultural machinery which are included in the transport sector) were eight per cent lower than in 1990. Emissions are expected to continue to decrease until 2010 and will then be 16 per cent below the level in 1990.
In 2000, Sweden introduced a tax on landfill waste and a prohibition against landfill of sorted and combustible organic waste has subsequently been introduced. These prohibitions came into effect in 2002 and 2005 respectively although are being introduced gradually in certain regions which have not had time to install sufficient capacity for recycling and combustion. During the period 1990-2004, emissions from landfills have decreased by 28 per cent. New waste legislation is being prepared and the decreasing trend for greenhouse gas emissions from the waste sector is expected to lead to a decline in emissions by 55 per cent in 2010 compared with 1990.
1.2.6. Directives and other Community legislation taken into consideration when calculating the total quantity of allowances
According to criterion 4 in Annex III of the Emissions Trading Directive, account should be taken of other Community legislative and policy instruments when establishing the total allocation.
The Community legislation, which is considered to give rise to so-called unavoidable increases in emissions in the trading sector, is:
• Directive 2003/17/EC amending Directive 1998/70/EC relating to the
quality of petrol and diesel fuels See section 2.4.
Besides consideration to the above-mentioned Directive, which is considered to lead to unavoidable increase in emissions, the following Directives have also been taken into consideration in the projections which serve as a basis for the decision on the total quantity of emission allowances to be allocated to Swedish installations in 2008-2012:
• Directive 2003/96/EC restructuring the Community framework for
Sweden has taxed energy and carbon dioxide emissions for a long time for various reasons. The EU Directive on energy taxes does not significantly change Swedish emissions since the minimum tax rates for fuels in the Directive are substantially already met.
• Directive 2001/77/EC on the promotion of energy produced from
renewable energy sources in the internal electricity market
The Swedish electricity certificate system serves as a central part of the strategy to increase the share of electricity production from renewable energy sources. The Parliament recently decided to extend the system to 2030 and this decision has been included in the prerequisites for calculating the projections of greenhouse gas emissions. In addition to the long-term consequences of establishing quotas beyond 2010, this reinforces the assessment that the goal of increasing the use of renewable electricity by 10 TWh by 2010 will be achieved. The electricity certificate system is considered to lead to a considerable decrease in carbon dioxide emissions although the major part of this impact will take place in Sweden’s neighbouring countries since the fossil component in the Swedish electricity production system is low.
• Directive 2004/8/EC on the promotion of cogeneration based on a
useful heat demand in the internal energy market and amending Directive 92/42/EEC
From 1 January 2004, all production of heating and electricity in co-generation plants is subject to a revised taxation that entails that tax on fuels for heat production in combined plants is equated with that employed in industry. This change is intended to facilitate the establishment of new co-generation production, which increase resource efficiency and reduces emissions from the electricity system as a whole14. Since it is to some extent fossil-fuel based co-generation which is added to the system and changes in marginal production mainly affect emissions in other countries, the measures can, however, lead to an increase in Swedish emissions.
• Directive 2003/30/EC on the promotion of the use of biofuels or other
renewable fuels for transport
According to the biofuel directive, the share of biofuel and other renewable energy sources shall amount to at least 2 per cent in 2005
14 On 6 June 2006, Sweden reported a further change in the carbon dioxide taxation to the European Commission entailing that particularly efficient installations (which comply with criteria of at least 38 per cent electrical efficiency and at least 89 per cent total efficiency) would be wholly exempt from carbon dioxide tax from 1 January 2007.
and at least 5.75 per cent in 2010 calculated by energy content. The actual outcome in Sweden in 2005 was 2.3 per cent. The government commission (SOU 2004:133) on introduction of renewable vehicle fuels recommends that the Government adopt the objective that the share of renewable fuels should be 5.75 per cent of the energy content in the quantity of vehicle fuels used by 2010. During the past period, the Government has undertaken a number of new measures to facilitate use of environmental cars though government tendering rules, legislation obliging petrol stations to provide renewable fuels, exemption from the congestion charge, tax relief, etc. The share of environmental cars of the total number of cars is accordingly expected to increase sharply in the next few years.
• Directive 2006/32/EC on energy end use efficiency and energy services
The energy services directive is intended to achieve a more cost-effective and rational end use of energy and to remove obstacles in the market for energy services. The public sector is to assume a leading role in this work. Following on from the Directive, the Member States have non-binding targets of nine per cent energy efficiency improvement in nine years for end use of energy, with the exception of energy-intensive industries which participate in the scheme for emission allowance trading. Consideration is now being given on how to implement the Directive in Sweden although there are already a large number of measures that contribute to fulfilling the target, such as investment support for conversion from direct electricity to environmentally friendly heating, energy saving measures, energy efficiency programmes in energy-intensive industry (PFE) and programmes for energy efficiency and energy smart construction.
The effects of the following directives have not been taken into consideration in the forecast that serves as one of the bases for establishment of the total allocation for 2008-2012.
• Directive 2002/91/EC on the energy performance of buildings
In Government Bill (2005/06:145), the Government has made proposals for a law on energy declaration for buildings. This proposes that practically all buildings are to have an energy declaration when newly built, when sold or transferred. The effects on greenhouse gas emissions that the Directive will give rise to in the short-term are difficult to assess. Together with the fact that houses and commercial buildings will not be inspected before 2009, this entails that the Directive has not been taken into consideration in the projections on which the allocation is based.
• Directive 2005/32/EC establishing a framework for ecodesign requirements for energy-using products
This Directive is intended to improve the energy efficiency of energy-using products and their impact on the environment through the whole of the product’s lifecycle. Since it has not yet been clarified how the Directive is to be incorporated in Swedish legislation, it has not been possible to take this into consideration in the projections for the period 2008-2012.
1.2.7. Introduction of further industrial combustion processes in the trading scheme
As a consequence of different interpretations of the meaning of the Directive as regards the concept of combustion installation, the scope of the scheme for greenhouse gas emissions trading has varied within the EU Member States in the initial trading period. These differences affect, for instance, the chemical industry and other activities where combustion takes place without the industry as such being included in the activities in Annex 1 of the Directive. To avoid the risk of distorting competition in the internal market which differences in application can give rise to, the Commission has presented a recommended interpretation in the further guidance notified in December 2005. According to the guidance, Member States should in all circumstances include combustion processes associated with crackers, carbon black, flaring, furnaces and integrated steelworks. 15
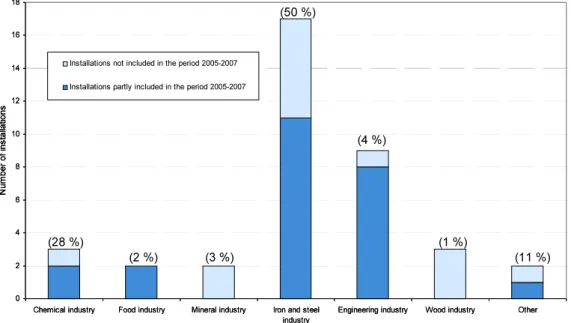
The need to harmonise the application of the Directive by Member States has led to a change in the concept of combustion installation in the Swedish Emissions Trading Ordinance (2004:1205) entailing that additional Swedish industrial activities are included in emissions trading. The effect of this change is that as from 2008 the trading scheme in Sweden covers all installations in which combustion takes place with an installed power input of at least 20 MW, regardless of the purpose of the process and regardless of the fuel used16, or which are subject to the Swedish rule on unilateral opt-in of smaller installations in accordance with Article 24 of the Directive. The Swedish interpretation of the concept of combustion installation thus coincides with the broadest interpretation that the European Commission presents in its further guidance of December 200517. The change affects around 35 Swedish industrial installations (see Figure 2). Both in terms of emissions and the number of affected installations, the iron and steel sector is the sector
15 COM(2005) 703 Final
16 In the case of combustion installations in industry which are not included in any of the activities given in Annex 1 of the Directive, units under 3 MW may be voluntary exempted from the aggregation rule when determining the total capacity installed. 17 COM(2005) 703 Final
most affected by this broadened definition of the concept of combustion installation. The total number of Swedish installations in the EU trading scheme amounts to over 700 in the initial period 2005-2007.
0 2 4 6 8 10 12 14 16 18
Chemical industry Food industry Mineral industry Iron and steel industry
Engineering industry Wood industry Other
N um ber of i ns tal la tions
Installations not included in the period 2005-2007 Installations partly included in the period 2005-2007
(28 %) (3 %) (2 %) (1 %) (50 %) (4 %) (11 %) 0 2 4 6 8 10 12 14 16 18
Chemical industry Food industry Mineral industry Iron and steel industry
Engineering industry Wood industry Other
N um ber of i ns tal la tions
Installations not included in the period 2005-2007 Installations partly included in the period 2005-2007
(28 %) (3 %) (2 %) (1 %) (50 %) (4 %) (11 %)
Figure 2. Additional installations as a result of the broadened definition of the concept of combustion installation for the trading period 2008-2012. Figures in brackets state the sector’s share of the total quantity of additional emissions in the projection for the ETS sector in 2008-2012 as a result of the Swedish application of the concept of combustion installation in the Directive being broadened to more types of emission sources.
The reported transfer of emissions from the non-ETS to the ETS sector which the broadened application of the concept of combustion installation leads to, must be taken into account when establishing the total quantity of allowances that are to be issued during the period in question. According to assessments from the Swedish Environmental Protection Agency of the installations that will be covered by the broadened concept of combustion installation, the annual emissions from the trading sector are expected to be around 2.0 million tonnes of carbon dioxide higher compared with the original projection for 2010. These emissions from industrial combustion processes that were not previously included derive for the most part from emission sources in chemical industry (flaring, crackers, furnaces) and the iron and steel industry (hot rolling, reheating, etc.). The transfer of the emissions in question from the non-ETS to the ETS sector does not entail any change in the total Swedish emissions.
1.3. The total quantity of allowances to allocate to Swedish installations
The planned annual allocation of emission allowances to installations in Sweden amount to an average of 25.2 million tonnes of carbon dioxide in the period 2008-2012. Of this quantity, allowances equivalent of 22.2 million tonnes of carbon dioxide are intended for existing installations. The total quantity of allowances to allocate according to this plan amounts to 126 million tonnes of carbon dioxide during the period 2008-2012, which is equivalent to an average of 25.2 million tonnes of carbon dioxide per year. Of this amount, 111 million tonnes of carbon dioxide (22.2 million tonnes of carbon dioxide per year) are intended for existing installations taken into commission before 30 June 2006 and they are issued proportionally during the five years of the period. The remaining 15 million tonnes of carbon dioxide are set aside in an unspecified reserve, primarily intended for allocation to new entrants. The quantity of issued allowances from the reserve may vary between the years 2008-2012, but amounts on average to 3 million tonnes of carbon dioxide per year. The total quantity of allowances also includes allocation for emission sources that are transferred to the trading scheme through the decision on a broader definition of the concept combustion installation as described in section 1.2.7. This part of the emissions from certain industrial activities with combustion emissions was not included in the allocation for the initial trading period 2005-2007. The total quantity of allowances to allocate constitutes almost 36 per cent of the projected emissions for Sweden as a whole from 2008-2012 which can be compared with the projected emissions for the ETS sector at the same time being calculated as totalling 38 per cent. In 2004, the emissions of carbon dioxide of the ETS sector amounted to 35 per cent of Sweden’s total emissions of greenhouse gases calculated on the basis of the smaller number of industrial processes for combustion included in the scheme during the initial trading period.
With the intention of limiting the planned total available volume of allowances, the Government has decided to carry out a more extensive downscaling of allocation in the electricity and district heating sector compared with the previous period. The scale factor is established on the basis of the total available volume and the material submitted by the companies in connection with the application for allocation. In the light of presently available information, the scale factor will amount to around 0.3-0.4, which means that allocation to these installations is calculated to amount to 30-40 per cent of the emissions during the period on which the allocation is calculated (which is generally 1998-2001). Downscaling in the electricity and district heating sector is consistent with the assessment of the potential of the different sectors to reduce the emissions of greenhouse gases.
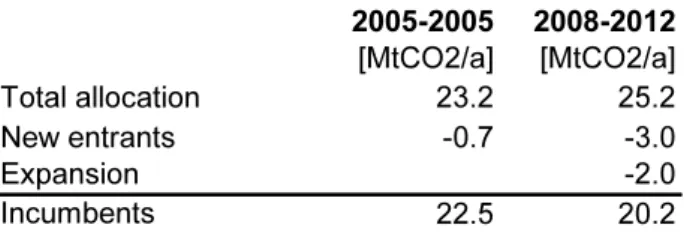
In the light of the fact that the allocation for 2005-2007 serves as the starting point for allocation in Sweden for 2008-2012, the proposed allocation to existing installations of 22.2 million tonnes of carbon dioxide will contribute to a greater scarcity of allowances for this category of installations than what was decided upon with respect to the initial trading period. Existing installations receive an allocation that is considerably lower than in the initial period, see Table 2. The fact that this is the case follows from the allocation to existing installations during the period 2005-2007 being retained during the period 2008-2012 despite the number of installations increasing as a result of the broader interpretation of the concept of combustion installation. An additional factor is that certain installations that are new entrants in the present period will become existing installations in 2008-2012. An account is given in section 1.3.1 of the estimated allocation of allowances in relation to the projected emissions for the existing installations in the respective sector.
Table 2. Annual allocation to existing installations during the first trading period (2005-2007) and the second trading period (2008-2012). The allocation for emission sources that have not been included in the initial trading period is reported separately to enable a relevant comparison to be made between the periods.
2005-2005 2008-2012 [MtCO2/a] [MtCO2/a] Total allocation 23.2 25.2 New entrants -0.7 -3.0 Expansion -2.0 Incumbents 22.5 20.2
1.3.1. The total allocation in relation to historical and projected emissions of greenhouse gases
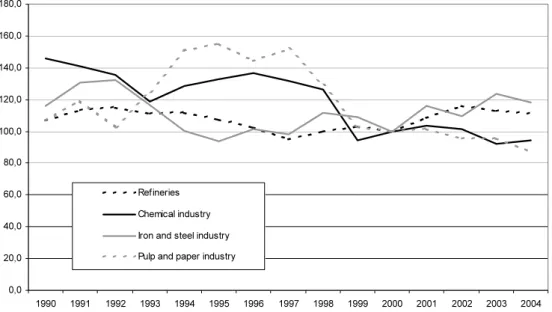
According to the projections of the development of emissions of greenhouse gases made by the Swedish Environmental Protection Agency and the Swedish Energy Agency, emission from refineries and the iron and steel industry are those that are expected to increase most to 2010. Emissions from the electricity and district heating sector fluctuate over time and largely comply with the inflow of water to the Swedish and Norwegian hydroelectric power reservoirs and variations in temperature. The share of hydroelectric power in Swedish electricity production varies considerably from year to year and generally amounts to 40-55 per cent. The rising emission trend in the projection for the electricity and district heating sector including refineries is due, among other things, to increased electricity production based on natural gas, the continued expansion of district heating and a number of substantial increases in refinery capacity. It is also important for the projection for 2010 that two nuclear power reactors have been shut down. Despite this,
Sweden is expected to export electricity corresponding to around 4.1 TWh per year at this time.18
0 10 000 20 000 30 000 40 000 50 000 60 000 70 000 80 000 1990 2000 2004 2008-2012 2008-2012 [ T hou sa n d t o nne C O 2e / year ] 72.4 70.8 69.9 68.4 EU ETS EU ETS EU ETS EU ETS NON-EU ETS NON-EU ETS NON-EU ETS NON-EU ETS 75.3 Sweden’s commitment according to EU’s burden sharing Al lo ca tio n Expanded scope 0 10 000 20 000 30 000 40 000 50 000 60 000 70 000 80 000 1990 2000 2004 2008-2012 2008-2012 [ T hou sa n d t o nne C O 2e / year ] 72.4 70.8 69.9 68.4 EU ETS EU ETS EU ETS EU ETS NON-EU ETS NON-EU ETS NON-EU ETS NON-EU ETS 75.3 Sweden’s commitment according to EU’s burden sharing Al lo ca tio n Expanded scope
Figure 3. Emissions of greenhouse gases from the trading and non-trading sectors in Sweden respectively, historically and according to the projection for 2008-2012 including additional measures, in relation to planned allocation and Sweden’s international commitment in accordance with the EU decision on burden sharing. (For 1990, the separation of emissions on trading and non-trading sectors is an estimate which must therefore be interpreted cautiously)
As shown in Figure 3, the total emissions of greenhouse gases in Sweden have decreased since 1990 and are estimated in accordance with the current projection to be less than the base year level during the period 2008-2012 as well. Swedish industry is modern, export-oriented and expansive which has entailed an increase of absolute emissions from industries in the trading sector in Sweden during the same period. This has taken place despite the decrease in specific emissions, among other things, due to measures to improve the energy efficiency of industrial processes. The increased productivity in Swedish basic industry has contributed to increased output and emissions and is in many cases directly linked to production without realistic possibilities of further reductions in the short-term.
Another important explanation for the increased emissions in the ETS sector is the transfer of emissions that takes place from the non-ETS
18 The Swedish Energy Agency’s and the Swedish Environmental Protection Agency’s material for Checkpoint 2004, Projections on emissions of greenhouse gases, in Swedish, Interim Report 1.
sector to the ETS sector. The policy instruments applied in Swedish energy and climate policy have led to a continuous transfer from individual to centralised heating through establishment of co-generation installations and expanded district heating systems. This is one of many explanations of the reduced emissions in the housing sector. Correspondingly, the increased emissions in the refinery sector (because of Directive 1999/32/EC and the supplement in Directive 93/12/EEC relating to the sulphur content of certain liquid fuels) are partly balanced by a simultaneous reduction of emissions in the transport sector in Sweden and abroad because of the improved quality of fuel which the measure is intended to achieve. The capacity of the Swedish petroleum refineries is larger than the domestic requirement which means that a considerable part of the petrol and diesel produced is exported to other countries. An increased use of waste heat from processes at Swedish refineries has moreover made possible a further expansion of the district heating networks, which contributes to reduced emissions in the non-ETS sector.
The emission projections presented below and in section 1.2 include the potentials for reducing emissions in all sectors. Taking into consideration current time perspectives and technical and economic prerequisites in the energy sector and the industrial sectors (see section 4.1), the total emissions from the installations covered by the emission allowance trading scheme are estimated to total 27.1 million tonnes of carbon dioxide per year on average during the period 2008–2012. This means that the total allocation corresponding to 25.2 million tonnes of carbon dioxide per year on average during the period 2008–2012 is consistent with criterion 3 on the potential for reducing emissions.
0 1000 2000 3000 4000 5000 6000 7000 8000 9000 10000 Electricity and district heating sector Industrial combustion
Refineries Iron and steel industry
Mineral industry Pulp and paper industry T hous a nd ton ne C O 2 / y e
ar Estimated allocation (existing capacity)
Projected emissions (existing capacity)
Figure 4. Tentative allocation of allowances to existing installations in the respective sector in relation to projected carbon dioxide emissions in 2008-2012.
The total emissions from existing installations in the ETS sectors are calculated to amount on average to 24.1 million tonnes of carbon dioxide per year during 2008-2012. Of this 3.2 million tonnes of carbon dioxide originates from existing installations in the electricity and district heating sector and a total of 20.9 million tonnes from industry. The principles for allocation presented in Chapter 2 are preliminarily estimated to give rise to a total allocation to existing installations in industry corresponding to approximately 20.4 million tonnes of carbon dioxide per year in connection with companies applying for allocation. The exact allocation will be established in the last quarter of 2006 after the agencies have processed the companies’ applications for allocation of allowances. Figure 4 shows how a tentative estimate of the allocation during 2008-2012 to installations regarded as existing capacity in the current period (including additional sources due to expansion of scope) relates to the projected emissions for the same group of installations broken down by respective sector. The greatest shortage arises in the electricity and district heating sector which is estimated to obtain an allocation corresponding to just over half of their need for allowances. The numbers in the figure only relate to the allocation and the emissions that are considered to be in question within the existing capacity and thus not those portions relating to new entrants.
1.4. The significance of verified emissions in 2005
The verified emissions from 2005 for the installations in the trading scheme have in most Member States reported lower actual emissions than the allocated quantity of allowances decided for the same year. The emissions from the more than 700 Swedish installations included in the trading scheme were in total approximately 13 per cent lower than the number of allowances issued to the installations during the year. There are a number of causes for this. In common for the installations in the trading sector is that 2005 was characterised by unexpectedly high prices for allowances, which can be expected to have a disproportionately large limiting effect on emissions relative to the total allocation of allowances during the same period. Furthermore, the Swedish installations paid an unchanged carbon dioxide tax despite the introduction of the emissions trading scheme. Emissions from the electricity and district heating sector were further affected by there being considerably more precipitation than usual during the year which meant that production in the Scandinavian hydroelectric power stations replacedproduction based on fossil fuels in the electricity system. 2005 was also a relatively warm year which reduces the need for electricity and fuels for heating.
Within industry, emissions during 2005 have also been affected by a decreased use of oil in favour of electricity due to the high oil price. It has been noted that the assumed production level for calculating the allocation during the period 2005-2007 has not yet been reached in the case of some installations. Appurtenant to this is that the method for
calculating the allocation for certain categories of installations means that the average level of activity from 2005 to 2007 has been used as a basis, which can have the effect that there will be a surplus in 2005 and corresponding deficits in 2006 and 2007 because the allocations decided upon for incumbents are to be proportional for the three years.
The Swedish iron and steel industry was affected by a temporary decline in the world market during 2005 which meant that large parts of this industry was at a standstill in December. Besides a general decline in the total demand and well-filled stocks, this was due to the industry overall reducing its primary production with a view to counteracting a decline in prices in the world market. During the first half of 2006, production has taken place with, in principle, full capacity use.
In the Bill (2004/05:18) on Trading in emission allowances II, the Government has decided that the allocation to existing installations in the period 2008-2012 shall not be based on actual data from the initial period 2005-2007. The Parliament has agreed with the Government’s assessment of this issue in Decision (Government Bill 2004/05:18, bet. 2004/05:MJU5, rskr. 2004/05:31).
There are no reasons today on the basis of the verified emissions for 2005 from Swedish installations in the scheme to undertake an adjustment of the assumptions made in this plan with respect to the projected development of emissions to 2008-2012. Verified emission data for 2005 can, however, serve as the basis for the agencies’ assessment of certain projections specified in the allocation application.
2. Principles for calculating the quantity of allowances to allocate at sector and installation level
The allocation method described in equation 1 is used for existing installations in the trading scheme commissioned before 2002, with the exception of ore-based steel production. Allocation to these installations is calculated in proportion to each installation’s average emissions during a historical period (FGP). The estimated number of allowances relates to annual allocation during the period 2008-2012 and is proportional for each year. Sweden does not intend during the period 2008-2012 to make use of the possibility of issuing allowances intended for existing installations for payment.
Emissions from the installations in the trading scheme are divided into the following two categories:
• Raw-material related emissions relate to emissions of carbon dioxide created from carbon in a process and which are combined in the raw material that is to be refined or in a process where carbon is added to remove an undesirable component from the raw material and the raw material cannot in principle be substituted for in the short-term at a reasonable cost. The definition also includes emissions arising in combustion of residual gases from some industrial processes. See section 4.1 for an account of the exact definition.
• Fuel-related emissions refer to all emissions of carbon dioxide from combustion of fossil fuels which do not constitute raw-material related emissions.
(
)
Projection 2008 2012 material Raw FGP material raw Fuel Emissions Emissions k Allocation − + + × = (1)k Factor which for combustion installations in
the electricity and district heating sector is determined by the ratio between the quantity of allowances available for the sector and the total of the allocation-based historical emissions from these installations. For installations outside the electricity and district heating sector, k = 1.0
FGP
material raw Fuel
Emissions + Average of the installation’s fuel and raw-material related emissions during the period on which allocation is based (FGP).
2012 2008 Projection material Raw
Emissions − Supplement based on the installation’s
projected increase of raw-material related emissions between the allocation based period (FGP) and an average for 2008-2012.
2.1. Allocation in proportion to the respective installation’s historical emissions
The basis for calculation of the allocation for existing installations is the respective installation’s historical emissions of carbon dioxide. This applies both to the fuel and raw-material related emissions. The period on which the allocation is based (FGP) is generally 1998-2001, although
it can in certain cases consist of a part of these four years, although never fewer than two.
In the cases where one or more exceptional events have taken place at an installation during this period, the allocation is based on a reduced number of years. An exceptional event means an operating stop because of a breakdown or a very extensive reconstruction or another event of a serious kind. In order for an event to be classified as exceptional, the reduced emission due to the event in question for each year must amount to at least 10 per cent of the average emission during the other baseline years (FGP). If the installation was affected by exceptional events for more than two of the years in the period, the allocation is based on the two years with the highest emissions.
The baseline period is adjusted for installations commissioned between 1998 and 2001, which means that the number of years decreases and is shifted towards later years for which the installation has data (see Table 3). However, the allocation is never based on emissions that have taken place after 2003.
Table 3: Baseline years for installations commissioned between 1998 and 2001.
1999 2000 2001 2002 2003
1998 X X X
1999 X X X
2000 X X
2001 X X
Period used for the calculation of allocation
C
o
mmissi
oned
Historical data on which to base the allocation is only available to a limited extent for installations taken into commission in 2002 or later. The existing installations commissioned between 1 January 2002 and 30 June 2006 receive allocation on the basis of the benchmarks or the best available technology in a corresponding way that allocation takes place to new entrants (see Chapter 3). The final allocation to this type of installations in the electricity and district heating sector is scaled down, however, to the same extent as other existing installations in this sector, which receive their allocation calculated on the basis of historical emissions. This means that the scale factor (kEnergi) in accordance with equation 2 is to be used when calculating the allocation for these installations, as takes place otherwise in accordance with equation 3. The requirement for installations in the electricity and district heating sector to engage in highly efficient co-generation to be entitled to free allocation only applies to new entrants. As for other existing installations, allocation is to be evenly distributed over the years in the period 2008-2012. The reason for using the same output-based approach as for new entrants is that it is considered to give rise to undesired signals to the companies to calculate an emission-based allocation on an allocation period that includes later years than those specified in Table 3.
Issued allowances to these existing installations will not be taken from the unspecified reserve referred to in section 3.2 but they share the totally available amount of 22.2 million tonnes of carbon dioxide just like other existing installations (incumbents).
A restrictive scale factor (kEnergi) is applied to incumbent combustion installations in the electricity and district heating sector. This constant is determined by the ratio between total available volume for the electricity and district heating sector and the total of the claims for allocation which ensue from the current basis for allocation and data in the applications for the existing installations in the electricity and district heating sector (see equation 2). Downscaling takes place proportionally for all installations in the electricity and district heating sector independently of technology and the basis for allocation otherwise. Based on the data presently available, the scale factor will amount to approximately 0.3-0.4, which corresponds to a scaling down of 60-70 per cent relative to each particular installation’s emissions during the baseline period on which the allocation is calculated. The final level of the scale factor is established at the earliest on 31 October 2006 which is the closing date for application to the authorities. For applications received between 30 September and 31 October 2006, the allocation is to amount to 90 per cent of what would have been allocated had the application been received before 30 September 200619.
∑
∑
∑
= = = − + − − = q 1 p p '' Energy m 1 j j ' Energy n 1 i i Industry Energy ) 2012 2008 ( Benchmarks ) FGP ( Emissions ) 2012 2008 ( Allocation 2 , 22 k (2)Industry Existing installations in industry including
the combustion processes included there.
Energy’ Installations in the electricity and district
heating sector commissioned before 2002
Energy’’ Installations in the electricity and district
heating sector commissioned between 1 January 2002 and 30 June 2006
The reason for down-scaling of the allocation for these particular installations is that the potential to reduce emissions is greater for fuel-based emissions than for raw-material related emissions and that the electricity and district heating sector unlike the industrial sectors are not
19 21 a § Ordinance (2006:645) amending the Emissions Trading Ordinance