Distributed Systems Seminar
Spatio-Temporal Visualization System - STVS
Mariano Hedberto Jofre
Tartu University - Faculty of Mathematics and Computer Science
Distributed Systems Group
26-11-2015
ABSTRACT
Objective:
Creating a Dynamic map to give a clear and easy way to understand the data and allow insights discovery about the past, present or the future.
Data:
For the moment, the data that we will use is the GPS locations of the shops and also all the clients addresses. Moreover, we will also have the timestamp when exactly the clients passed through the cashier’s.
Description of the systems:
The system will be capable of showing the locations of all the shops and also some additional information about the shops themselves. For example: when you put the mouse arrow on the shop icon on the map, a small label will appear with the name of the shop, its size, estimated time period spent on shopping, etc.Besides, when you click on a specific shop it will dynamically show all the exact home locations of the associated customers of the selected shop, plus an estimated routing that they take daily from their homes to the shop. The moment you put the mouse arrow on the home locations of the clients, you will see a label with information about the number of clients in that building and also some additional information about the clients.Therefore, we will be able to show travel time information regarding how much time the client spent to reach the shop and also, by knowing the time when he or she passed through the cashier, we can make an estimation about how much time he or she spent
inside the shop. It will be possible to analyse the input data by time window by specifying the start and end time. All this information can be derived directly or indirectly from the input data and shown on the map via additional graphs like histograms, line graphs, bar charts, cosmographic graphs, etc.
Technology:
Technology: The system will be created using R and embedded javascript (js). It will run in a R server and the application for visualization will be hosted with the Shiny R Web framework. The end users will access the system through a Web browser, using a username and a password. This approach will allow to several users from different locations to access the system at the same time.
Contents
1 INTRODUCTION 4
1.1 PURPOSE . . . 4
1.2 SCOPE . . . 4
1.3 DEFINITIONS, ACRONYMS and ABBREVIATIONS . . . 4
1.4 OVERVIEW . . . 4
2 SYSTEM OVERVIEW 6 2.1 SYSTEM CHARACTERISTICS . . . 6
2.2 SYSTEM ARCHITECTURE . . . 6
2.3 SOFTWARE DEVELOPMENT TOOLS . . . 7
2.3.1 Software Packages . . . 7
2.3.2 Languages . . . 10
3 PROTOTYPES 11 3.1 DASHBOARD . . . 11
3.2 ROUTING . . . 11
3.3 DYNAMIC MAP VISUALIZATION . . . 12
1
INTRODUCTION
The aim of this document is to provide a clear description of the sys-tem proposed. It is about the development and deployment of an R Application to analyse and visualize spatio temporal data from super-market customer. The results will be shown in a WEB Browser with tables, graphs and mainly with dynamic maps (OpenStreetmaps). The system proposed is Spatio-Temporal Visualization System (STVS). This integrates R statistical analysis, leaflet.js dynamic map visual-ization and R-Shiny Web framework. The R server will host the App and it could be used by several users at the same time from any location through a Web browser.
1.1
PURPOSE
The system will be designed to provide visualization of spatio-temporal information about the supermarket data. The system output will be charts, tables and dynamic maps to show the information from dif-ferent perspectives and layers.
1.2
SCOPE
The system will be a new way to show and visualize information through dynamic maps. This system provides also the possibility to access the information through the web and interact dynamically with the outputs. It is also possible to improve the system performance with parallelization if needed.
1.3
DEFINITIONS, ACRONYMS and ABBREVIATIONS
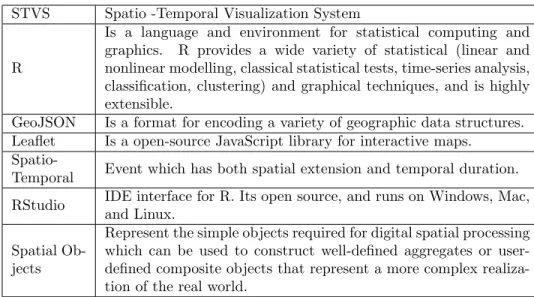
For a better understanding is important to clearly define some terms. Most of the acronyms are related with the technology and tools used in this framework. The notations used throughout the project are outlined in Table 1.
1.4
OVERVIEW
The system consists of three main software components:
• An R data analysis development that get data from the database, prepro-cessed the data, create new variables and perform some data analytical process.
• An integrated application to create the dynamic outputs from the R ana-lytical process.
• A web interface that allows the user to interact with the dynamic system output.
STVS Spatio -Temporal Visualization System
R
Is a language and environment for statistical computing and graphics. R provides a wide variety of statistical (linear and nonlinear modelling, classical statistical tests, time-series analysis, classification, clustering) and graphical techniques, and is highly extensible.
GeoJSON Is a format for encoding a variety of geographic data structures. Leaflet Is a open-source JavaScript library for interactive maps.
Spatio-Temporal Event which has both spatial extension and temporal duration. RStudio IDE interface for R. Its open source, and runs on Windows, Mac,
and Linux. Spatial
Ob-jects
Represent the simple objects required for digital spatial processing which can be used to construct well-defined aggregates or user-defined composite objects that represent a more complex realiza-tion of the real world.
Table 1: Framework terminology
These three components are the highest-level abstraction of the Spatio-Temporal Analytic System. Along with the three main software com-ponents, the system requires to run in a server with security access to protect the data and information we are working on.
2
SYSTEM OVERVIEW
The Spatio-Temporal Visualization System (STVS) software is com-prised of three main high-level components:
• STVS Data Analysis (A development to get data from the database, pro-cess the input data and get useful information of that)
• STVS Dynamic Data and Map Visualization (A framework to create dy-namic visualization)
• STVS Web-App (The web interface software that allows the user to view their data dynamically)
2.1
SYSTEM CHARACTERISTICS
The STVS Application is broken into components to ensure modu-larity, dynamic controls and future improvements. The application components are the STVS Data Analysis, the STVS Dynamic Data and Map Visualization and STVS Web-App. The STVS Data Analy-sis application get the input data from the database, pre-porcess and analyze the input data. The STVS Dynamic Data and Map Visual-ization creates the dynamic outputs and finally the STVS Web-App provide access to any Web user to the application. The STVS Dy-namic Data and Map Visualization has also several modules defined by the type of output and technology needed to create it. Therefore, there is a module for Dynamic Leaflet Maps, a module for dynamic charts and a module for dynamic tables. This system characteristics were defined to:
• serve a large number of concurrent users.
• be highly resilient or fault tolerant.
• provide security features to protect data.
• be scalable and easily maintainable in the future.
• to have any special back-up facilities to protect important data.
2.2
SYSTEM ARCHITECTURE
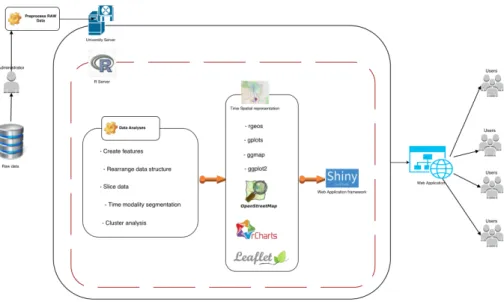
The system architecture of the STVS system is mainly defined by the use of an R server. The R Server runs under the University Server environment. This type of configuration simplify any information security issue (Fig. 1). The STVS System gets the raw data from a database. This operation is performed by a submodule of the STVS Data Analyses module (Fig. 1). This configuration also aloud that any team member can access, via Web Browser, to the STVS output.
Figure 1: System Architecture Schema.
The three main high-levels of the system (STVS Data Analysis, STVS Dynamic Data and Map Visualization and STVS Web-App) run un-der the R Server thanks to the use of tools and proper libraries. This approach simplifies the process of integration between concur-rent technologies. The main added value of this system, the dynamic maps, were also generated from the R code.
2.3
SOFTWARE DEVELOPMENT TOOLS
2.3.1 Software Packages Data Processing
The STVS Data Analysis application, provides the data analysis and create new variables for the system. There are many R software packages already in use for handling data and statistics analysis. This are a list of the most important used in this application.
• data.table: Fast aggregation of large data (e.g. 100GB in RAM), fast ordered joins, fast add/modify/delete of columns by group using no copies at all, list columns and a fast file reader (fread). Offers a natural and flexible syntax, for faster development.
• plyr: Tools for Splitting, Applying and Combining Data. When needs to break a big problem down into manageable pieces, operate on each piece and then put all the pieces back together.
• splitstackshape: Stack and Reshape Datasets After Splitting Concate-nated Values
• R.utils: Utility functions useful when programming and developing R packages.
• stats: R statistical functions. This package contains functions for statis-tical calculations and random number generation.
• parallel: R package to run code in parallel computing.
• doMC: Provides a parallel backend for the
• fpc: Flexible Procedures for Clustering. Various methods for clustering and cluster validation.
• rgeos: Interface to Geometry Engine - Open Source (GEOS). This package use the C API for topology operations on geometries.
• geosphere: Spherical trigonometry for geographic applications. That is, compute distances and related measures for angular (longitude/latitude) locations.
• dplyr: A Grammar of Data Manipulation Description A fast, consistent tool for working with data frame like objects, both in memory and out of memory.
• reshape2: Flexibly restructure and aggregate data using just two func-tions: melt and dcast (or acast).
• caTools: Contains several basic utility functions including: moving (rolling, running) window statistic functions, read/write for GIF and ENVI binary files, fast calculation of AUC, LogitBoost classifier, base64 encoder/decoder, round-off error free sum and cumsum, etc.
• gtools: functions to assist in R programming.
Data Visualization
After the data analysis performed by STVS Data Analysis, STVS Dynamic Data and Map Visualization create the charts, tables and dynamic maps. Again, there are many R libraries already extensively used for this task. There is also important to remark the use of leaflet.js library for dynamic maps and the necessary R integration.
• maptools: Tools for Reading and Handling Spatial Objects. Set of tools for manipulating and reading geographic data, in particular ESRI shape-files.
• RcolorBrewer: ColorBrewer Palettes. Provides color schemes for maps and other graphics.
• rCharts: is an R package to create, customize and publish interactive javascript visualizations from R using a familiar lattice style plotting in-terface.
• rHighcharts: is a package is an R wrapper for the Highcharts JS.
• leafletR: Leaflet is an open-source JavaScript libraries for interactive maps. It could be used with GIS tools like OpenStreetMap, Mapbox, and Car-toDB. The leafletR package makes it easy to integrate and control Leaflet maps in R.
Main features:
– Interactive panning/zooming.
– Compose maps using arbitrary combinations of map tiles, markers, polygons, lines, popups and GeoJSON.
– Create maps right from the R console or Rstudio.
– Embed maps in knitr/R Markdown documents and Shiny apps.
– Easily render Spatial objects from the sp package, or data frames with latitude/longitude columns.
– Use map bounds and mouse events to drive Shiny logic.
• xtable: Coerce data to LaTeX and HTML tables. Mainly to create HTML tables.
• gplots: Various R programming tools for plotting data.
• lattice: A powerful and elegant high-level data visualization system in-spired by Trellis graphics, with an emphasis on multivariate data.
• ggmap: A collection of functions to visualize spatial data and models on top of static maps from various online sources (e.g Google Maps and Sta-men Maps). It includes tools common to those tasks, including functions for geolocation and routing.
• colorRamps: to build color tables. This function is important assign color to the layers.
• ggplot2: An implementation of the grammar of graphics in R. It combines the advantages of both base and lattice graphics. It has no reactive or dynamic features.
• leaflet-routing-machine: is a javascript library to add routing to a Leaflet map.
Features:
– Standard Leaflet control, with Leaflet look and feel.
– Routing from start to destination, with possibility of via points.
– Add, edit and remove waypoints through both address input and using the map.
– Multiple language support.
– Support for several routing engines: OSRM, GraphHopper (through plugin lrm-graphhopper), Mapbox Directions API (through plugin lrm-mapbox), Mapzen Valhalla(through plugin lrm-valhalla) and Tom-Tom Online Routing API (through plugin lrm-tomtom).
– Highly customizable for advanced use.
– Customizable look (theming / skins).
– Open Source released under ISC License (more or less equivalent with the MIT license).
Application framework
Finally, the last stage of this project, calls STVS Web-App, requires to deploy the web application. For this I will use a specific R library. shiny: Web application framework for R. To build interactive web applications with which automatic ”reactive” binding between inputs and outputs and extensive pre-built widgets.
2.3.2 Languages R
The main developing language and platform of this project is R. I will also use the IDE RStudio because it has several features to easily handle and mange code. The R code covers the three highest-level abstraction of the STVS System.
JavaScript
Lealfet is a JavaScript library used to create interactive maps. The R application inserts the input data in the library to draw the maps. However to improve the performance and quality of the maps some-times is necessary to modify the js code.
3
PROTOTYPES
3.1
DASHBOARD
Figure 2: Dashboard Prototype.
To visualize and navigate through the content is necessary to cre-ate a framework. Due to that the Dashboard shows the information dynamically.Figure 2
3.2
ROUTING
An important add value of this approach and framework comes from the possibility to add some routing view to the analyses. The algo-rithm implementation is done and working. Figure 3
3.3
DYNAMIC MAP VISUALIZATION
The dynamic map visualization is capable of showing the information in several ways.
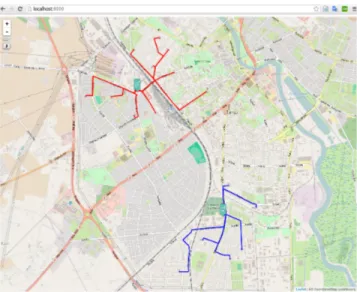
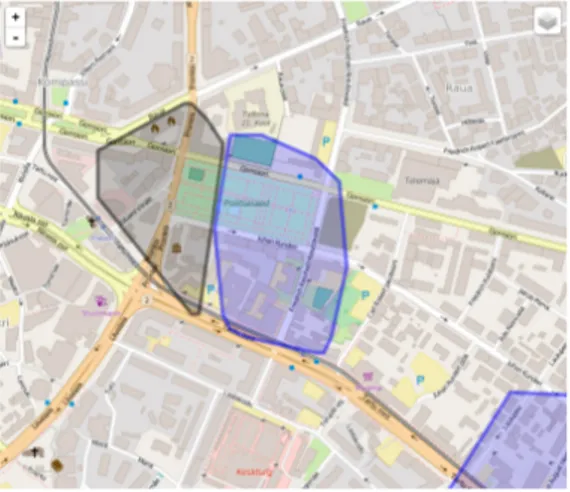
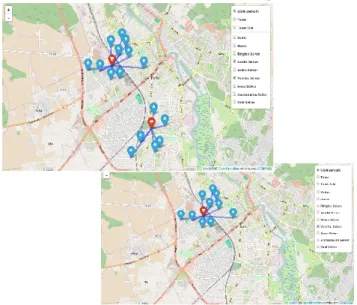
• Zoom in - Zoom out (Figure 4 and Figure 5)
Figure 4: Zoom In - Zoom Out - I.
Each polygon in this map belong to a layer. It is possible to add different layers or objects to the map such as icons, lines, polylines, polygons, arrows, dots and pop-up.
• Drag Map (Figure 6)
Figure 6: Drag Map.
• Show and hide layers (Figure 7)
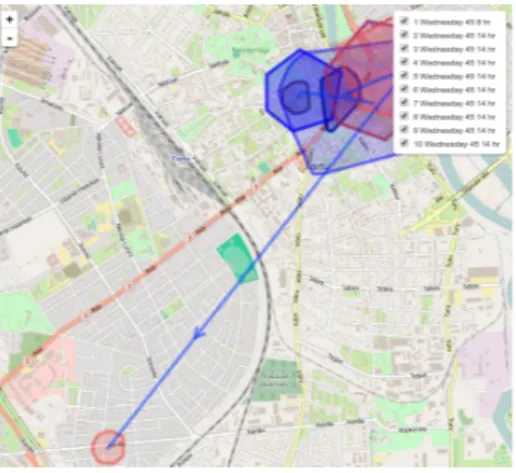
• Animation on Map (Figure 8)
Figure 8: Show/Animation Map.
The map can be animated, which make the representation of the information on the dynamic map very easy to understand by the end user.
• Pop-ups on Markers (Figure 9)
Figure 9: Show/Pop Ups Map.
Possibility to add additional details or information dynamically with pop-ups.
Besides we can use different color gradient variations to illustrate the importance of the information on the map and supported with a legend.
3.4
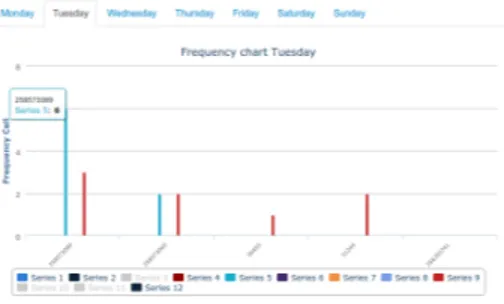
DYNAMIC CHARTS
Figure 10: Dynamic Chart I.
Figure 11: Dynamic Chart II.
The dynamic charts aloud the user to interact with the information. The user, for example could show/hide information in a graph.
In this example some Series are hidden. However, when the mouse scroll over the features or point to it, a pop up appears with the hidden information.
List of Figures
1 System Architecture Schema. . . 7
2 Dashboard Prototype. . . 11
3 Routing Visualization. . . 11
4 Zoom In - Zoom Out - I. . . 12
5 Zoom In - Zoom Out - II. . . 12
6 Drag Map. . . 13
7 Show/Hide Layers. . . 13
8 Show/Animation Map. . . 14
9 Show/Pop Ups Map. . . 14
10 Dynamic Chart I. . . 15
11 Dynamic Chart II. . . 15