Faster Insights from Any Data
Technical White PaperPublished: May 29, 2013
Applies to: Microsoft SQL Server 2014 and Microsoft SQL Server 2012
Summary: Even the modern business intelligence (BI) platform must adapt to a whole new scope, scale, and diversity of information and data—and it must continue to embrace the new ways that we discover and collaborate on information every day. Microsoft SQL Server empowers BI users through easy-to-use self-service capabilities for Microsoft Office and Microsoft SharePoint, while balancing the need to maintain credible, consistent data throughout the organization with robust data management capabilities. With Office and SharePoint 2013 and future releases, Microsoft Excel becomes a complete and powerful self-service BI tool. With the emergence of Big Data, it is all the more important to ensure that BI users are able to gain business insight from all available data, whether structured or unstructured. In this paper, we also discuss Microsoft capabilities for Big Data as an integral part of a BI platform for the modern enterprise.
Copyright
The information contained in this document represents the current view of Microsoft Corporation on the issues discussed as of the date of publication. Because Microsoft must respond to changing market conditions, it should not be interpreted to be a commitment on the part of Microsoft, and Microsoft cannot guarantee the accuracy of any information presented after the date of publication.
This white paper is for informational purposes only. MICROSOFT MAKES NO WARRANTIES, EXPRESS, IMPLIED, OR STATUTORY, AS TO THE INFORMATION IN THIS DOCUMENT.
Complying with all applicable copyright laws is the responsibility of the user. Without limiting the rights under copyright, no part of this document may be reproduced, stored in, or introduced into a retrieval system, or transmitted in any form or by any means (electronic, mechanical, photocopying, recording, or otherwise), or for any purpose, without the express written permission of Microsoft Corporation.
Microsoft may have patents, patent applications, trademarks, copyrights, or other intellectual property rights covering subject matter in this document. Except as expressly provided in any written license agreement from Microsoft, the furnishing of this document does not give you any license to these patents, trademarks, copyrights, or other intellectual property.
© 2013 Microsoft Corporation. All rights reserved.
Microsoft, Active Directory, Azure, Bing, Excel, SharePoint, Silverlight, SQL Server, Visual Studio, Windows, and Windows Server, are trademarks of the Microsoft group of companies.
Contents
The world of data is changing ... 4
Breakthrough insight with Microsoft SQL Server... 4
New business intelligence features ... 5
Rapid data exploration in Excel... 5
Appealing interactive visualization with Power View in Excel ... 6
Power View support for both tabular and multidimensional models ... 7
Project code name “Data Explorer” preview for Excel ... 8
Project code name “GeoFlow” preview for Excel ... 9
Self-service analysis with PowerPivot: Now in Excel... 10
Managed self-service BI ... 11
Governance and compliance, insight, and oversight for IT ... 11
Self-service content creation balanced with IT management ... 13
Ease of administration through SharePoint ... 13
Credible, consistent data ... 14
BI Semantic Model ... 14
Enterprise information management (EIM) ... 14
Data Quality Services ... 14
Master Data Services ... 15
SQL Server Integration Services ... 15
Big Data analytics and data warehousing ... 15
Massive data warehousing ... 15
Next-generation performance with xVelocity in-memory technology ... 15
Faster time-to-solution ... 16
Microsoft Big Data solution ... 16
The world of data is changing
Changes in the way we do business are transforming the way we interact with data. Businesses face growth in the volume of information and in the types of data they encounter, from increased transactions to unstructured data, image files, and information from new sources such as sensor networks. We’re being asked new types of questions—as businesses go online, we are interacting through new channels that provide a whole new set of data and a greater urgency to move forward in real time. There is a new scope, scale, and diversity to the types and shapes of information that we now need to process, manage, and analyze for business insight.
The proliferation of data extends beyond traditional data types. According to Gartner, the total volume of data worldwide is growing at a rate of 59 percent per year. Furthermore, Gartner estimates that 70–85 percent of data is unstructured1. The dramatic shift from structured to unstructured and complex data types requires organizations to embrace back-end solutions that support complex data types and non-traditional data sources—such as Big Data.
The way we work, and our expectations about how we work, are changing. With everything we are able to do on the Web and with the emergence of social media, we are discovering, sharing, and collaborating on information in whole new ways. Business intelligence is no different, in terms of how we access
information, collaborate and work with others, and build on the work that other people have done.
Breakthrough insight with Microsoft SQL Server
Innovations from Microsoft in the last few years have not gone unnoticed. Forrester Research, in a wave of articles about self-service BI, identified Microsoft as a leader and asserted that “Microsoft enables business users to look no further than Excel for self-service BI.”2
Breakthrough insight is about empowering everyone across an organization with self-service capabilities through the familiar Microsoft Office productivity suite, to embrace the way we discover and collaborate on information every day. It is about providing IT departments with the tools they need to manage data of any size and type, across relational and nonrelational sources, to harness the power of all available data and enable new business insights. SQL Server delivers breakthrough insight pervasively across the organization with the following enhancements:
Rapid data exploration with Microsoft Excel: Microsoft continues to empower users with self-service capabilities through the familiar productivity tools they use every day—Microsoft Office and Microsoft SharePoint. By offering the popular PowerPivot Add-In for Excel with SQL Server, Microsoft enables users of all levels to quickly gain access to data from virtually any source, analyze and model that data in Excel, and then collaborate and share insights through SharePoint. Microsoft also offers Power View as part of its self-service lineup. Power View is a highly interactive, browser-based tool that eases data exploration and visualization. Managed self-service business intelligence from Microsoft offers a means to gaining breakthrough insights as a natural part of day-to-day activities through PowerPivot and Power View in Excel to:
o Gain access to and integrate data from virtually any source o Create compelling reports and analytical applications
1 Source: Mark Beyer, “Information Management Goes 'Extreme': The Biggest Challenges for 21st-Century CIOs.” Gartner Symposium Presentation. October 2011.
2 Source: “The Forrester Wave: Self-Service Business Intelligence Platforms, Q2 2012." Forrester Research.
o Visualize and interact with data in bold, new ways
o More easily collaborate and share insights through familiar tools in Excel and SharePoint Managed self-service BI: This capability is about providing the IT department with the tools they
need to manage and protect the data and content that end users create. Microsoft uniquely provides IT administrators with the insight and oversight they need through tools for monitoring and managing user-generated content—and for transforming that content into corporate-grade solutions that are professionally managed by the IT department. One benefit is that organizations can simplify
compliance processes without hampering user agility and creativity. Another is that with SharePoint 2013, Microsoft enables enterprise-grade IT governance for your BI solutions.
Credible, consistent data: With a growing number of data types and sources, it is increasingly important for organizations to ensure that the data users are accessing is credible and consistent. With SQL Server, Microsoft provides a complete and integrated suite of enterprise information management (EIM) tools. Data Quality Services helps IT professionals to improve the quality of data, and it delivers unique capabilities such as the ability to connect to the Windows Azure Marketplace and use third-party reference data to reliably profile, cleanse, and match data. Along with productivity enhancements and a new Excel Add-In for maintenance of master data, these tools reduce time-to-solution and help ensure ease of management.
Big Data analytics and scalable data warehousing: Organizations need to harness the power of all available data, across relational and nonrelational sources, to drive the types of new insights that lead to innovation and new business opportunities. Microsoft customers are realizing the benefits of SQL Server in some of the largest analytical and data warehouse solutions today. SQL Server capabilities add complete fault tolerance and disaster recovery with AlwaysOn, in addition to next-generation performance improvements of 10–100 times through xVelocity in-memory technologies. SQL Server also activates nonrelational data types to bridge beyond the data warehouse and embrace Big Data through Hadoop.
New business intelligence features
Rapid data exploration in Excel
SQL Server enhances the data exploration capabilities of organizations by empowering users to access and integrate data from virtually any source. Users can create compelling reports and analytical
applications, and more easily collaborate and share insights by using familiar tools. Users can create interactive, tabular, graphical, and free-form reports by using data from a wide variety of data sources, including on-premises, syndicated, or unstructured data sources. SQL Server also includes customization capabilities with several programmable features.
Appealing interactive visualization with Power View in Excel
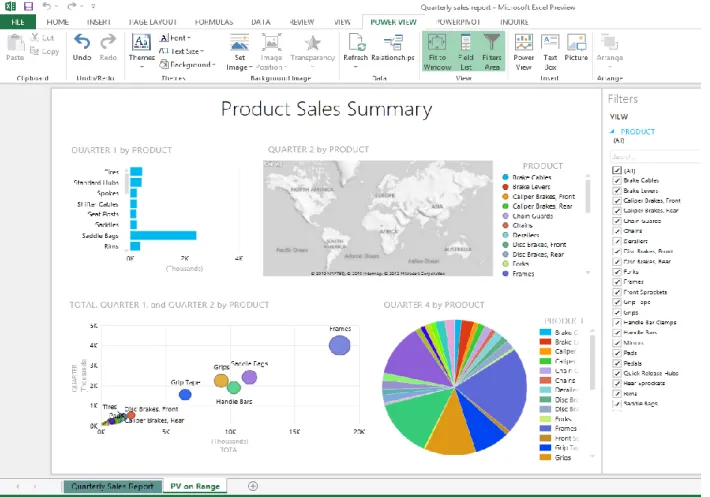
Microsoft makes self-service reporting a reality by providing a highly interactive and responsive data exploration, visualization, and presentation experience for users of all types—from business executives to information workers—in Excel. Anyone can create a report in just seconds, transform the “shape” of data with a single click, add powerful timed animation sequences to quickly identify trends or anomalies, and make a more convincing case through rich presentation of discovered insights (Figure 1).
Figure 1: Power View in Microsoft Excel
Power View in Excel offers users the following benefits:
Visual design experience: Users can access and analyze information in a completely interactive, web-based authoring environment that has the familiar look and feel of Microsoft Office. Users can create and manipulate data in a variety of tables, charts, and views to visualize the data in the way that best suits their purposes.
Filtering and highlighting of data: Because Power View can identify relationships between different tables through its underlying BI Semantic Model (BISM), users can more easily interact with the data to gain insights. Through this common metadata layer, users can apply a variety of visualization filters and can highlight capabilities across the entire report. (For more information about the BISM, see BI Semantic Model, later.)
Presentation-ready: Power View empowers users to share information quickly and easily, and lets them browse and present data at virtually any time without having to preview it on another platform. Users publish reports to SharePoint Excel Services so others can easily view and interact with the information.
Performance: To save time and resources, Power View retrieves only the data needed for visualization at any given time.
Enhanced visualizations: Formats include report styles and themes, backgrounds and background images, hyperlinks, pie charts, support for maps, and key performance indicators.
Power View support for both tabular and multidimensional models
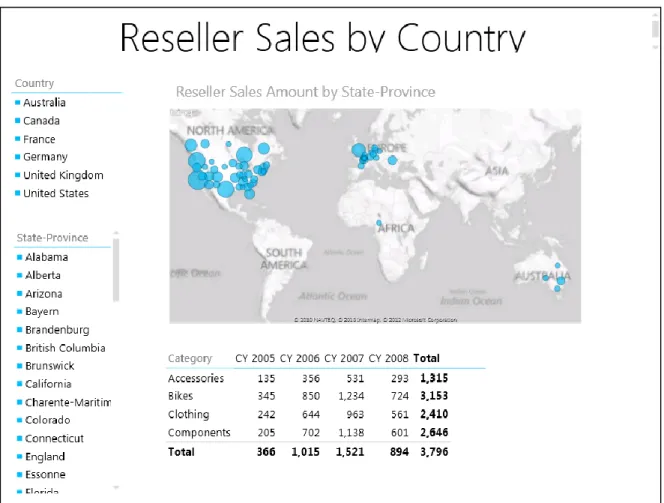
With Power View support for SQL Server Analysis Services, organizations can maximize their existing BI investments while offering users the latest BI end-user tools that include modeling flexibility with both tabular and multidimensional BISMs. Users can quickly create a variety of visualizations, from tables and matrices to bubble charts and sets of small multiple charts on both model types (Figure 2).
Project code name “Data Explorer” preview for Excel
Code name "Data Explorer" is an Excel add-in that enhances the self-service business intelligence experience in Excel by simplifying data discovery and access. This preview provides an early look into upcoming features where users can more easily discover, combine, and refine data for better analysis in Excel. With code name “Data Explorer” users can:
Identify and import the data from the external sources (relational databases, Excel, text and XML files, OData feeds, webpages, Hadoop Distributed File System, and more).
Discover relevant data by using the data search feature.
Combine data from multiple, disparate data sources and transform it in preparation for further analysis in tools such as Excel and PowerPivot (Figure 3).
Project code name “GeoFlow” preview for Excel
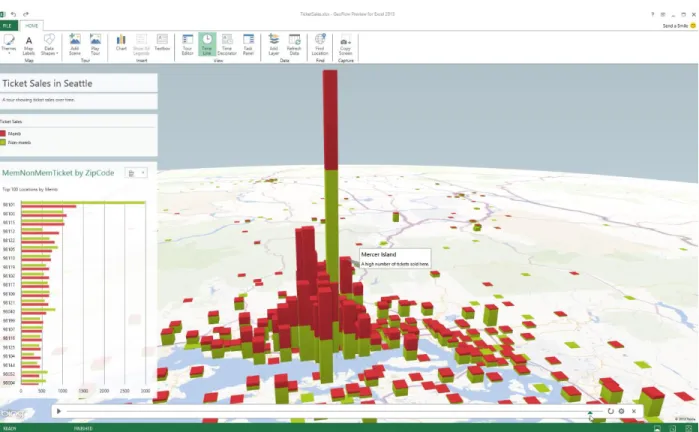
Code name “GeoFlow” makes it possible for users to plot geographic and temporal data visually, analyze that data in three dimensions (3D), and create interactive tours to share with others (Figure 4). With code name “GeoFlow,” users can:
Map data by plotting more than one million rows of data from an Excel workbook, including the Excel Data Model or PowerPivot, in three-dimensional maps in Microsoft Bing. Choose from columns, heat maps, and bubble visualizations.
Discover new insights by seeing data in geographic space and seeing time-stamped data change over time. Annotate or compare data in a few clicks.
Share stories by capturing scenes and building cinematic, guided tours that can be shared broadly to engage audiences in more interesting ways.
Self-service analysis with PowerPivot: Now in Excel
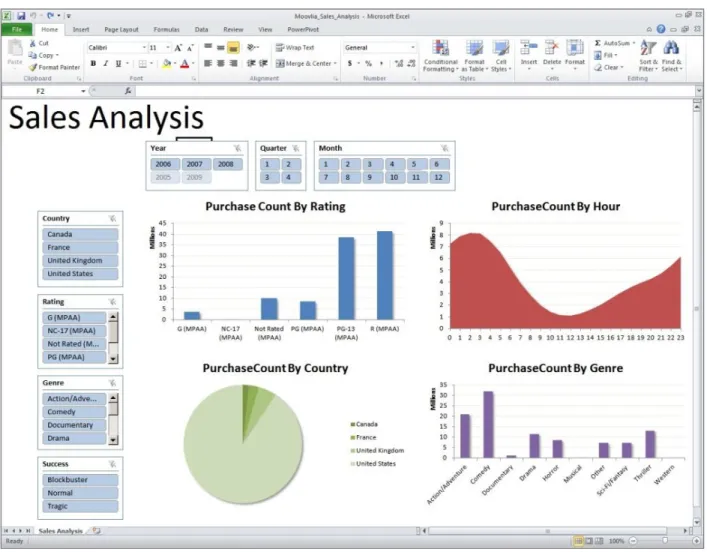
With SQL Server, Microsoft empowers users to access and integrate data from virtually any source to create compelling self-service reports and analytical applications (Figure 5). Users can publish these reports to Excel Services and then share them across the organization more easily with enhanced collaboration features. IT departments can manage these solutions with complete oversight through the PowerPivot Management Dashboards available in the SharePoint Central Administration Console, where administrators can manage and protect the data without hampering user creativity.
Figure 5: Using PowerPivot to analyze data in an Excel workbook
PowerPivot is not only integrated into Excel, but also provides advanced analytical capabilities such as key performance indicators (KPIs), advanced sorting, perspectives, hierarchies, and sophisticated business logic. It also includes extended Data Analysis Expressions (DAX) functionality, which gives end-users the power to build sophisticated analytical solutions with functions similar to those in Excel. In addition to using PowerPivot, users can speed up analysis in Excel by easily cleaning up and shaping data with Flash Fill; by using Quick Analysis to preview data, apply conditional formatting, and create tables, charts and PivotTables; and by using Quick Explore to navigate through multidimensional and tabular data models and create trend charts to analyze information over time.
Managed self-service BI
Governance and compliance, insight, and oversight for IT
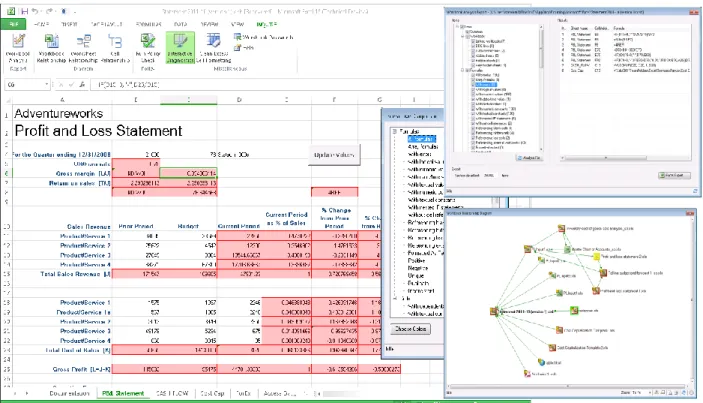
Your organization can improve governance and compliance and easily track business-critical Excel assets by enabling discovery and assessment of user-created spreadsheets with SharePoint 2013; and by comparing, tracking lineage, conducting interactive diagnostics, and delivering analysis reports of your spreadsheets with Inquire in Excel 2013 (Figure 6).
The PowerPivot Management Dashboard (Figure 7), available as part of the SharePoint Central
Administration console, helps IT departments monitor data and workbook usage and gather performance metrics from servers. This diagnostic information gives IT administrators more visibility into how data is used throughout the organization, so they can gain a deeper understanding of usage patterns and decide where to invest time and resources for the best results.
Self-service content creation balanced with IT management
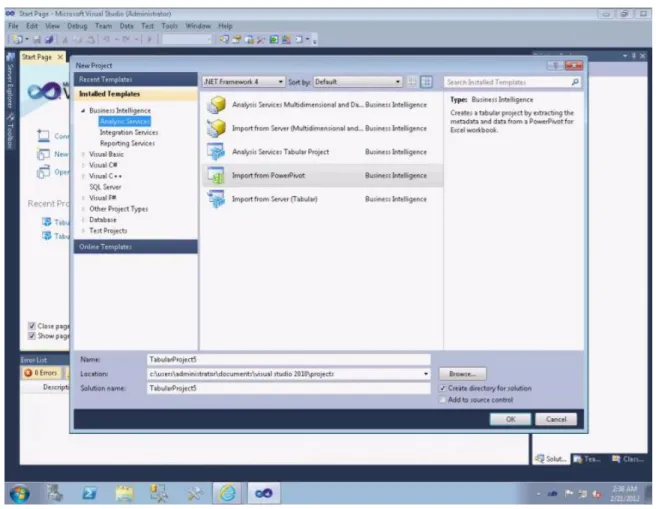
Through its capability to import PowerPivot models directly into Analysis Services (Figure 8), SQL Server bridges the gap between self-service content created by end users and corporate solutions managed by IT departments. IT professionals can identify workbooks of interest through the PowerPivot Management Dashboard, and can actively engage in managing those workbooks for users. This level of management is possible through the extended functionality made available in the professional BI development tools within Microsoft Visual Studio. IT professionals can add role-based security and other needed
enhancements and deploy the model back out to the user community.
Figure 8: Importing end-user content from PowerPivot within Visual Studio
Ease of administration through SharePoint
SQL Server delivers capabilities that provide a SharePoint integration platform for Reporting Services and self-service BI features such as Power View. These capabilities help to reduce TCO for SharePoint administrators by consolidating Reporting Services administration, configuration, and management into
Credible, consistent data
BI Semantic Model
SQL Server has the BI Semantic Model (Figure 9), a single model that offers users multiple ways to build business intelligence solutions that include:
Continued support for the powerful online analytical-processing (OLAP) technologies that make SQL Server Analysis Services indispensable to BI specialists.
Tools for IT professionals and developers accustomed to dealing with data in rows and columns. Support for a spectrum of BI solutions that span personal, team, and corporate contexts.
Figure 9: BI Semantic Model
With the BISM, organizations can scale from small, personal BI solutions to the largest organizational BI needs. The BISM is one model for all end-user experiences: reporting, analytics, scorecards, dashboards, and custom applications. It offers developers flexible modeling experiences, richness to build
sophisticated business logic, and scalability for the most demanding enterprise needs.
Enterprise information management (EIM)
Data Quality Services
Data Quality Services (DQS) helps organizations round out end-to-end data management. DQS provides knowledge-driven tools that data stewards can use to create and maintain a knowledge base of data-quality topics. These topics help improve the data-quality of organizational data and ease data management. Specifically, organizations can gain confidence in the quality of data by using organizational knowledge to profile, cleanse, and match data. Data stewards can run Data Quality Services as a standalone tool or
integrated with SQL Server Integration Services. With SQL Server, customers can access the Windows Azure Marketplace DataMarket as a source of third-party data to help validate and cleanse data in a data quality project.
Master Data Services
Master Data Services (MDS) continues to make it easier for organizations to manage master data structures (object mapping, reference data, and dimensions and hierarchies) used in data integration operations. With Entity Based Staging, database administrators (DBAs) can load all members and
attribute values for an entity at one time. Additionally, the Explorer and Integration Management functional areas of the Master Data Manager web application have been updated with a new look and feel based on the Microsoft Silverlight browser development tool. DBAs can add and delete members more quickly, and can move them into a hierarchy more easily.
The MDS Add-in for Excel democratizes data management, so information workers have the ability to build data management applications directly in Excel. Information workers can use this add-in to load a filtered set of data from the MDS database, work with the data in Excel, and then publish the changes back to the MDS database. Administrators also can use the add-in to create new entities and attributes.
SQL Server Integration Services
SQL Server Integration Services helps lower the barriers to getting started with data integration.
Integration Services makes it easier for organizations of all sizes to manage corporate information more efficiently, improve productivity, and streamline operations. SQL Server Integration Services delivers comprehensive support to help organizations run their data integration capabilities as a mission-critical application. It includes rich DBA and IT implementer support for the deployment and administration of extract, transform, and load (ETL) tasks. SQL Server also includes the ability to run administration and other capabilities as a separate SQL Server instance.
Big Data analytics and data warehousing
SQL Server supports enterprise-level needs for analytics and data warehouse solutions and offers complete fault tolerance and disaster recovery with AlwaysOn to provide 99.9 percent uptime.
Massive data warehousing
Microsoft provides a range of solutions that help organizations address the challenges of Big Data with its family of data warehouse solutions—SQL Server, SQL Server Fast Track Data Warehouse, and SQL Server Parallel Data Warehouse—that provide a robust and scalable platform for storing and analyzing data in a traditional data warehouse. SQL Server provides enhanced features such as Remote Blob Storage and partitioned tables that scale to 15,000 partitions to support large, sliding-window scenarios. (In a sliding window scenario, partitioned tables are managed for efficiency to maintain the same number of partitions over time by adding a new partition to accommodate the newest data and removing the partition that contains the oldest data.) SQL Server also has increased support for as many as 640 logical cores to enable high performance for very large workloads and consolidation scenarios.
Faster time-to-solution
SQL Server offers faster time-to-solution through reference architectures; appliances that offer pretested, preconfigured, and pretuned integration with open tier-one industry hardware; and software that
organizations can install and configure four times faster than products from other leading vendors. SQL Server offers one of the lowest costs of acquisition and ownership, where real-life scenarios show savings of hundreds of thousands of dollars after organizations move to SQL Server.
Microsoft Big Data solution
Microsoft strategy for Big Data embraces Hadoop for activating ambient data that comes into existence outside the traditional data platform. Hadoop is the open-source implementation of MapReduce parallel computation engine and environment, and it is used for processing streams of data that go well beyond the size of even the largest enterprise data sets. Whether the data is from sensors, clickstreams, social media, geographical locations, or is generated and collected in large masses, Hadoop is often in the service of processing and analyzing it.
Microsoft is delivering an enterprise-class implementation, or distribution, of Hadoop called HDInsight for Windows Server and Windows Azure that is integrated with SQL Server, Active Directory, and Microsoft System Center to make it dramatically easier, more efficient, and more cost effective for organizations to capitalize on the opportunity Big Data can bring. HDInsight is the Hadoop distribution from and supported by Microsoft that is 100-percent compatible with Apache. HDInsight empowers organizations with new insights into previously untouched unstructured data, while connecting to the most widely used business intelligence tools on the planet.
The Big Data solution from Microsoft enables customers to augment their analysis with publicly available data from social media sites such as Twitter and Facebook, and hundreds of trusted data providers on Windows Azure Marketplace. Azure Marketplace also exposes hundreds of applications and data mining algorithms to help organizations unlock new business insights.
To complement Microsoft strategy for Big Data overall, PolyBase offers breakthrough technology on the data processing engine in SQL Server Parallel Data Warehouse. PolyBase is designed to be a simple way to combine nonrelational data and traditional relational data for analysis. While organizations would normally burden IT to prepopulate the data warehouse with Hadoop data, or would undergo extensive training in MapReduce to query nonrelational data, PolyBase does these tasks seamlessly to give users the benefits of Big Data without the complexities.
Also, through deep integration with PowerPivot, Power View, and enterprise data warehouse tools, the Microsoft solution for Big Data offers organizations deep insights into all their structured and unstructured data with the tools they use every day.
Conclusion
Microsoft SQL Server offers a balance of user-powered BI and data-management capabilities—both through self-service capabilities for end users in Microsoft Office and Microsoft SharePoint, and by providing the tools to maintain credible, consistent data throughout the organization. With Office 2013 and SharePoint 2013, Excel 2013 becomes a complete and powerful tool for self-service BI.
With Power View and PowerPivot in Excel, Microsoft delivers powerful self-service reporting to any user through a user experience that is highly interactive and that offers data exploration, visualization, and
presentation capabilities. The new BI Semantic Model provides a single model for all end-user experiences, enabling organizations to scale from small, personal BI solutions to the largest
organizational BI needs. Data Quality Services (DQS) enables organizations to create and maintain a knowledge base of data quality topics that improves data quality and eases data management—helping organizations to gain leverage from internal knowledge to profile, cleanse, and match data. Master Data Services (MDS) continues to make it easier to manage master data structures and offers new
enhancements such as Entity Based Staging, updates to the Master Data Manager web application, and the new Master Data Services Add-in for Excel.
Lastly, Microsoft continues its ongoing commitment to Big Data analytics and data warehousing. The range of data warehouse offerings from Microsoft provides robust and scalable solutions for storing and analyzing data in a traditional environment. Now, Microsoft is embracing Apache Hadoop as part of its vision to provide business insight to all users from virtually any data.
More information
The following websites offer more information about topics discussed in this white paper:
http://www.microsoft.com/sqlserver/: SQL Server website
http://www.microsoft.com/en-us/bi/default.aspx: Microsoft business intelligence website
http://www.microsoft.com/bigdata/: Microsoft Big Data solutions
Feedback
Did this paper help you? Please give us your feedback by telling us on a scale of 1 (poor) to 5 (excellent) how you rate this paper and why you have given it this rating. More specifically:
Are you rating it highly because of relevant examples, helpful screen shots, clear writing, or another reason?
Are you rating it poorly because of examples that don’t apply to your concerns, fuzzy screen shots, or unclear writing?
This feedback will help us improve the quality of white papers we release. Please send your feedback to: mailto:[email protected]