E-Commerce in the Context of Declining
State Sales Tax Bases
by
Donald Bruce, Assistant Professor [email protected]
and
William F. Fox, Professor1 [email protected]
Center for Business and Economic Research 100 Glocker Building
The University of Tennessee Knoxville, Tennessee 37996-4170
(865)974-5441 (tel.) (865)974-3100 (fax)
May 2000
ABSTRACT: This paper extends the quantitative estimates of sales tax revenue losses from electronic commerce in a variety of ways. First, we place the effects of e-commerce in the context of general sales tax base trends, arguing that e-commerce is only one of the factors reducing sales tax bases. Second, we take a forward looking view, estimating both the current losses and the expected losses several years hence. Third, we estimate the revenue-neutral increases in state sales tax rates that will become necessary to offset the base declines. Revenue loss estimates are prepared for every state with a sales tax. Our baseline estimates suggest that e-commerce will cause about $10.8 billion in additional tax revenue losses nationwide in 2003.
Introduction
Much has been said about the importance of e-commerce to state tax revenues, with particular attention to effects that interstate sales have on the ability of states to impose and collect sales and use taxes.2 Estimates of the state and local government revenue losses for states, at least in general discussions, cover the spectrum from the expectation that state tax bases will be devastated to the contention that tax revenues will actually be increased by an economy that is invigorated by the internet.3 The differences depend on the perspective taken on issues such as the role that taxes play in allowing the development of e-commerce, the time period analyzed, and forecasts of how rapidly e-commerce will expand. Nearly everyone agrees that the revenue losses-to-date have been relatively limited because e-commerce is still in its infancy. The important question from a policy perspective, then, is how the losses will grow in the near and longer term, since it is future rather than current losses that will be affected by policy decisions and which should be a factor in structuring policy. As with most issues, the probable reality of the revenue implications lies between the purported extremes.
A common assertion by those arguing that tax revenues will increase as a result of failure to impose the sales tax on e-commerce transactions is that the productivity enhancements
stimulated by the internet and electronic commerce will expand the economy and raise all states’ tax revenues. A case has been made that new electronic technologies are allowing output quality to rise and production costs to fall (for example, see OECD, 1999). This is certainly true to a degree, but the productivity gains are not entirely a result of tax exemption. One possible argument for subsidization involves the presence of a network or information externality that requires a subsidy to achieve efficiency. However, Goolsbee and Zittrain (1999) argued that to the extent that any externalities exist they will be short lived and any tax exemption should also be short lived. It seems hard to imagine that the externalities would remain in the near future (and require subsidies equal to an average sales tax rate of 6.5 percent), given the expected magnitude of e-commerce transactions over the next several years. In the absence of
expand the economy, even though the overall presence of e-commerce expands the economy. If consumer transactions are taxed differently on the basis of how commodities are obtained, efficiency losses are probable. Efficiency effects of sales and use taxes on business inputs are more difficult to evaluate because reduced taxation of business inputs is generally efficiency enhancing. However, the efficiency effects of exempting business inputs purchased via
e-commerce, while taxing many business inputs obtained in other forms, potentially at higher rates, could increase efficiency losses.
This paper seeks to extend the quantitative estimates of sales tax revenue losses in a variety of ways. First, we place the effects of e-commerce in the context of general sales tax base trends, arguing that e-commerce is only one of the factors reducing sales tax bases. Second, we take a forward looking view, estimating both the losses today and the expected losses several years hence. Third, we estimate the revenue neutral increases in state sales tax rates that will become necessary to offset the base declines. Finally, estimates are prepared for every state with a sales tax.
Sales Tax Trends
State sales tax bases have been declining relative to state personal income for many years. For the average sales-taxing state, the tax base equaled 51.4 percent of the state’s personal income in 1979, but had fallen to 42.8 percent in 1998 (see Figure 1).4 The breadth of sales tax bases varied widely by state, from 27.6 percent of personal income in Rhode Island to 109.2 percent in Hawaii.5 The base does not narrow every year, despite the overall trend. Immediately after a recession and in very strong consumption years like much of the latter part of the 1990s, the base rises as a share of income, but this cyclical pattern must be distinguished from the downward trend.
The narrowing of sales tax bases is attributable to three major factors. The first is remote sales, including e-commerce, catalog sales, and cross-state shopping, all of which have been rapidly expanding in recent years. Every state with a sales tax imposes a corresponding use tax on remote purchases, effectively intended to convert the overall tax structure to a destination basis.6 Thus, to the extent that the base is shrinking because of remote purchases, tax evasion rather than avoidance or re-definition is generally the cause. Administration and compliance costs could be limited through collection of the use tax from vendors rather than buyers.7 However, the U.S. Supreme Court in Quill v. North Dakota, 112 U.S. 298 (1992) ruled that states could only require firms with physical presence in the state to collect use tax on their behalf. As a result, the use tax frequently relies on voluntary compliance, which is very limited for individuals except for a small set of commodities such as automobiles and boats that must be registered. Use tax compliance is somewhat greater for businesses, but still falls far short of the
FIGURE 1—Sales Tax Base as a Percent of Personal Income, 1979-2003
'79 '80 '81 '82 '83 '84 '85 '86 '87 '88 '89 '90 '91 '92 '93 '94 '95 '96 '97 '98 '99 '00 '01 '02 '03 38 40 42 44 46 48 50 52
legislated burdens. The court’s limitation of collection responsibility to firms with physical presence was based on the Commerce Clause, meaning that Congress has the authority to override the decision through legislation.
The second and perhaps foremost factor is the shift in consumption patterns towards greater consumption of services and less consumption of goods. Services are much less broadly taxed than goods, meaning the base shrinks relative to the economy as services become more prominent. As evidence of this shift in spending, services were 47.4 percent of consumption in 1979 but rose to 58.8 percent in 1998. The implications for base decline would be even larger except that much of the decline in goods consumption has been for food at home, which is exempt in most states.
Third, the continuing process of legislated exemptions has narrowed the base in essentially every state. To be sure, some of the recently legislated exemptions, such as for industrial equipment,8 are consistent with good tax policy, but they still have the effect of lowering the taxable base. Other exemptions are intended to improve equity, such as the exemption of food for consumption at home and prescription drugs. These equity enhancing exemptions may come at a high price in terms of targeting and of administration and compliance, and improved equity may be better achieved in most states though direct taxes. Still other
exemptions are given mostly for political reasons. These exemptions are often for business inputs, which should be excluded from a consumption tax, but they are given in a haphazard fashion that may not be efficiency enhancing. For example, the exemptions are often firm-specific or are very narrowly construed, and can lead to differential taxation within industries.
States have responded to the narrowing tax bases by raising tax rates, though the extent of a causal relationship has not been carefully studied. The median state sales tax rate increased from 3.25 percent in 1970 to 4.0 percent in 1980 and to 5.0 percent in 1990. Seventeen states now have rates at or above 6.0 percent. The rate increases have allowed states to slightly increase revenues as a percent of GDP since 1986. Local governments in 32 states are also permitted to impose sales taxes.9A pattern of rate increases appears to have occurred at the local level as well.
Revenue Losses from Sales Tax Patterns
The combined effects of the trend decline in demand for sales taxable commodities and e-commerce are summarized in Figure 2. D1 is the demand for sales taxable commodities, which
in this simple example can be thought of as in-state purchases of goods. Changes in tastes for non-taxed services and development of a non-taxed substitute commodity (through e-commerce) reduce demand for sales taxable commodities, as evidenced by movement of the demand curve to D2. States lose tax revenue equal to t1*(S1-S2), at the initial tax rate t1. Based on past patterns,
states raise their tax rates to offset the lost revenues, which will reduce the tax base further (evidenced by S2 to S3), depending on the price elasticity for sales taxed commodities. States
could increase their tax rate to t2, where the additional revenue from the higher tax rate ((t2-t1)*
S3) equals the lost tax revenues from fewer taxable purchases (t1*(S1-S3)).
FIGURE 2—Effect of Sales Tax Base Changes on Tax Revenues
P(1+t2) S2 S1 SALES TAX BASE D2 D1 PRICE P P(1+t1) S3
Estimates of Revenue Loss
This section presents estimates of sales tax losses from e-commerce in the context of the broader decrease in sales tax bases. To accomplish this objective, we first estimate the trend reduction in sales tax bases that is occurring independent of e-commerce, and then estimate the loss from e-commerce. The focus in this paper is on an estimate of revenue losses for 2003, because the nascent state of e-commerce makes a current year estimate of limited value for policy purposes.
Estimating Trend Decreases in State Sales Tax Bases
The first step in our analysis involves calculating state level estimates of the trend decrease in sales tax bases as a percent of personal income. The process involves arithmetic calculations of state sales tax bases, panel model estimates of the relationship between the tax base and personal income, state by state estimates of personal income growth, and tax base forecasts as a function of the personal income forecasts. The first step, estimation of state sales tax bases, was accomplished by dividing each state’s sales tax revenues by its sales tax rate.10
Then a sales tax base equation was fit for all 45 sales-taxing states plus the District of Columbia, using panel data for 1979 to 1996. The equation was estimated through 1996 in an attempt to find the underlying relationships prior to any effect from e-commerce. Controls in this equation include state personal income and state fixed effects to account for differences across states in the underlying sales tax base and other state specific impacts. The growth in real GDP was used instead of fixed effects for time, presuming that differences across time are heavily dependent on the point in the business cycle. Results of the panel model are shown in equation (1). The key variable of interest is personal income, and the 0.85 elasticity on personal income is consistent with previous findings.11 The finding of an elasticity below 1 results in the forecast of a trend decrease in the base as a share of the economy, consistent with the pattern generally observed since 1979.12
ln Tax base = 1.94 + .85 (ln personal income) + .097 GDP growth (1) (7.96) (61.62) (0.41)
R2 = 0.92
Equation (1) is used to forecast the state-specific sales tax base for each year through 2003, based on a forecast of personal income for each state. Personal income forecasts were developed using a time series equation for each state, relating state personal income to national personal income and the growth rate in real GDP.13 The latter was intended to account for any state specific differences in the response to national business cycles. Then, state personal income estimates through 2003 were made based on WEFA’s November 1999 forecast for U.S. personal income and growth in GDP.14
In Table 1, the tax base as a share of personal income is given for each state for 1996 and an estimate is provided for 2003.15 All states are forecast to experience a reduction in the tax base during this time period. It should be noted that Table 1 does not include effects from the development of e-commerce. It is these effects to which we now turn.
Revenue Losses from E-Commerce
The revenue losses from e-commerce generally arise because e-commerce significantly expands the potential for remote sales causing a shift from collecting sales taxes at the point of sale to collecting use taxes for goods used, consumed or stored in the state. Compliance rates are much better for sales taxes than for use taxes. Also, use tax compliance, which even before e-commerce was less effective than sales tax compliance, is expected to fall because of
e-commerce. There appears to be a feeling, at least among some taxpayers, that e-commerce transactions are free from sales and use taxes. The limited moratorium enacted through the Internet Tax Freedom Act may be one explanation for this misunderstanding. Further, taxpayers who generally comply with use taxes may be less willing to pay because of the perception that others are reducing their compliance. The revenue losses described here are generally the result of tax evasion, not tax avoidance, since the use tax is due even if the sales tax cannot be
State and local revenue losses from e-commerce sales are measured here by estimating the reductions in the sales tax base and then multiplying the lost tax base by the state-specific effective state and local sales tax rate.16 Key inputs to estimating the tax base loss for
e-commerce transactions are forecasts of e-e-commerce sales, identification of the sales taxable
Table 1: Sales Tax Base as a Percentage of Personal Income, 1996 and 2003
________________________________________________________________________ State 1996 2003 ________________________________________________________________________________ AL 39.9 37.8 AR 64.9 61.7 AZ 47.8 45.3 CA 39.6 37.3 CO 45.1 43.0 CT 36.7 34.6 DC 44.0 41.6 FL 55.4 52.2 GA 56.7 53.6 HI 109.2 102.3 IA 46.4 44.5 ID 51.3 48.8 IL 32.2 30.7 IN 44.3 42.1 KS 48.7 46.4 KY 46.5 44.2 LA 64.7 61.9 MA 29.0 27.4 MD 35.8 33.7 ME 42.3 39.9 MI 47.8 45.5 MN 46.6 44.3 MO 48.1 45.7 MS 55.5 52.9 NC 45.8 43.3 ND 51.9 50.0 NE 43.1 41.1 NJ 29.1 27.5 NM 86.2 81.8 NV 58.4 55.4 NY 34.4 32.5 OH 38.8 36.9 OK 67.2 64.3 PA 32.2 30.5 RI 27.6 26.0 SC 52.6 49.7 SD 65.9 62.8 TN 51.0 48.3 TX 48.7 46.3 UT 61.8 58.9 VA 42.8 40.3 VT 41.6 39.3 WA 49.9 47.3 WI 45.5 43.3 WV 48.0 45.8 WY 71.5 68.9 ___________________________________________
components of these sales, assumptions about what share of taxable sales could be collected in the absence of e-commerce, and estimates of the share of taxes due that can be collected.
E-commerce sales are drawn from Forrester Research Inc.’s annual forecasts for the years 1999 through 2003 for 24 categories of business to consumer (B2C) sales and 13 categories of business to business (B2B) sales.17 Forrester anticipates a rapid compound growth rate of 83.7 percent annually through 2003.18 B2B sales are expected to dominate e-commerce activity,
representing 90.3 percent of the 2003 total.
Forrester’s forecasts were adjusted to net out purchases by businesses and residents in non-sales-taxing states.19 The assumption was that the share of e-commerce sales in these states
is proportionate to their share of the national population.20 The remaining transactions are
assumed to be made by residents and businesses in sales-taxing states. Sales tax bases differ by state and the categories which Forrester uses are relatively broad, so it was necessary to make assumptions about the percentage of sales for each sales category that would be taxable on average across the U.S. For sales that are expected to occur through e-commerce, major exempt purchases on B2C transactions are for most leisure travel (which includes airline tickets
purchased through e-commerce), much of the food and beverage purchases (at least 27 states exempt food for consumption at home), some health and beauty expenditures (medical
expenditures are exempt in most states), and a portion of apparel (part of apparel expenditures are exempt in some states). Based on the specific assumptions adopted, 70.2 percent of forecast 2003 e-commerce B2C sales will be taxable. States are assumed to collect about 20.9 percent of the due revenues through either the sales or use tax, based on the assumptions that all liabilities on automobile sales are collected and 10 percent of liabilities on other categories are collected.21
Many categories of B2B e-commerce sales are exempt, but the largest categories of expected sales are computing and electronics and motor vehicles. The vast majority of both is taxable. Examples of exemptions in these categories are for custom software and computers used for research in some states and for computers used directly in the manufacturing process. Paper
where many purchases are taxable. In total, 52.5 percent of expected B2B sales are assumed to be taxable, based on reasonable assumptions about what percentage of each of Forrester’s categories is taxable.
In some states, certain sales of tangible personal property are taxable but sales of a digital counterpart are not. For example, all states tax pre-packaged software, but 16 states do not tax software if it is downloaded (State Taxation Institute, 2000). No explicit adjustment is made to account for changes in form that alter taxability of transactions, except as assumptions are made about the extent to which certain types of sales are assumed to be taxable. At most one-seventh of e-commerce sales appear to reasonably fit into the category where they might become non-taxable in some states because they are sold in digitized form. (for example, software, music, books, etc.).22 The resulting estimates are overstated (assuming that states do not alter the tax base to reflect this trend) to the extent that this shift reduces the tax base, but most states could be expected to react quickly to such base erosion and redefine the base to include many digitized sales.
The total revenue loss from e-commerce equals total taxes due on internet sales minus use taxes collected. However, a new or incremental loss from e-commerce occurs only to the extent that taxes on the transactions would have been collected without e-commerce. These two factors must be combined to obtain the final loss estimate. No precise estimates are available on the extent to which use taxes are being paid on B2B transactions. Discussions with state revenue officials suggest 40 to 50 percent compliance is the current average, except for motor vehicles where compliance should be much better. The baseline estimates used here assume 50 percent use tax compliance for all items, except for vehicles where the compliance rate is 100 percent. This results in a weighted average 65.2 percent compliance rate.23 This would appear to be an upper bound on compliance for e-commerce sales. Also, the baseline assumption used in this analysis is that 50 percent of the B2B revenue loss and 35 percent of the B2C revenue loss would have occurred even without e-commerce transactions (because of failure to collect sales and use tax in a non-e-commerce environment).24
Based on the assumptions, forecasts of the incremental revenue loss from e-commerce sales are shown in Table 2 for 1999 through 2003. The incremental loss is estimated to be $10.80 billion in 2003.25 The incremental loss is the amount that would not have occurred without
e-commerce, after recognizing the substitution of e-commerce sales for other remote sales.
The dominant role that B2B is expected to play in e-commerce sales means that the ability to collect revenues on B2B transactions is very important to the revenue loss for state and
Table 2: Estimated Sales Tax Revenue Losses from E-Commerce
(Billions) 1999 2000 2001 2002 2003
Total Business-to-Business1 106.59 244.87 486.63 821.80 1,297.80 Less Exempt Sales -47.54 -105.05 -208.76 -369.81 -616.45
Less B2B on which sales/use tax collected -34.07 -80.96 -164.77 -281.59 -444.24
Equals B2B Base Loss 24.98 58.87 113.09 170.40 237.11
Less substitution for other remote sales -12.49 -29.43 -56.55 -85.20 -118.55
Equals Incremental B2B Base Loss 12.49 29.43 56.55 85.20 118.55
Approximate Revenue Loss from B2B 0.80 1.88 3.61 5.44 7.57
Total Business-to-Consumer1 19.75 37.79 62.59 98.62 140.19 Less Exempt B2C -8.32 -15.34 -23.53 -32.74 -41.78
Less B2C on which sales/use tax collected -1.14 -2.60 -5.51 -10.54 -20.57
Equals B2C Base Loss 10.29 19.85 33.55 55.34 77.85
Less substitution for other remote sales -3.60 -6.95 -11.74 -19.37 -27.25
Equals Incremental B2C Base Loss 6.69 12.90 21.81 35.97 50.60
Approximate Revenue Loss from B2C 0.43 0.82 1.39 2.30 3.23
Approximate Incremental Revenue Loss 1.23 2.70 5.00 7.74 10.80
1. Sales taxing states only.
local governments. B2B is responsible for 70.1 percent of the expected incremental revenue loss in 2003, with the other 29.9 percent coming from B2C sales. Economists have argued that exemption of B2B sales is consistent with structuring the sales tax as a consumption tax. This could lead some to conclude that loss of revenues on B2B transactions is a good thing.
However, exempting B2B transactions acquired through a specific means may not be welfare enhancing. Elimination of the B2B sales from the base should be part of broader policy reform.
State-specific estimates of the revenues lost from e-commerce were prepared based on the 2003 calculations. The distribution between states was approximated based on two factors. First, each state’s taxable e-commerce sales were assumed to be proportionate to the state’s share of the combined sales tax base for all states. Estimates of each state’s sales tax base were drawn from the calculations described in the section on trend base losses. Second, each state’s tax base was weighted for the propensity of residents to shop via e-commerce depending on the state and local sales tax rate. Goolsbee (1999) found that each one-percent increase in the sales tax rate led to a 0.5 percent increase in the probability of buying something online. Thus, differences across states in the share of the national loss from e-commerce are a function of the breadth of the states’ sales tax base (a determinant of the state’s existing share of the combined base), the states’ income growth (determining the forecasted growth in the general sales tax base) and differences in state sales tax rates (determining the relative propensity to purchase through e-commerce).
Table 3 lists (1) the 2003 state and local government revenue losses from trend narrowing of the tax base, (2) total e-commerce losses, (3) incremental e-commerce losses, and (4) the combined total revenue losses, which add the trend losses in (1) to the incremental e-commerce losses in (3). The national total of the combined revenue losses shown in column 4 is $23.86 billion. An estimated 45.2 percent of the revenue loss comes from incremental e-commerce sales. This is a surprisingly large share, given that the trend sales tax base losses over the past several decades appear to have been driven more by shifts to consumption of services than by increases in remote sales. The incremental revenue loss of $10.8 billion is shown in column 3.
Table 3: Combined State and Local Revenue Losses in 2003 (Millions)
_____________________________________________________________________
(1) = Trend Revenue Loss (Without E-Commerce) (2) = Total Revenue Loss Due to E-Commerce
(3) = Incremental (New) Revenue Loss Due to E-Commerce (4) = Total Combined Revenue Loss = (1) + (3)
______________________________________________________________________________ State (1) (2) (3) (4) _____________________________________________________________________ AL 177.2 269.7 144.8 322.1 AR 113.9 188.6 101.3 215.1 AZ 218.7 341.4 183.4 402.1 CA 1,964.4 2,780.2 1,493.2 3,457.6 CO 167.5 290.7 156.2 323.6 CT 201.5 288.0 154.7 356.2 DC 38.6 55.1 29.6 68.2 FL 1,006.8 1,403.0 753.6 1,760.4 GA 419.6 620.7 333.4 752.9 HI 127.0 158.6 85.2 212.2 IA 82.4 162.7 87.4 169.8 ID 39.9 67.1 36.0 75.9 IL 497.7 844.8 453.7 951.5 IN 202.1 324.6 174.3 376.5 KS 112.3 189.5 101.8 214.1 KY 145.3 238.6 128.2 273.4 LA 239.2 453.9 243.8 483.0 MA 207.6 303.6 163.1 370.7 MD 215.9 294.1 158.0 373.8 ME 56.7 78.5 42.1 98.9 MI 460.7 757.5 406.8 867.6 MN 254.3 408.6 219.5 473.8 MO 243.8 395.0 212.1 456.0 MS 119.9 206.1 110.7 230.6 NC 300.1 444.9 239.0 539.1 ND 17.7 38.6 20.7 38.4 NE 59.4 105.6 56.7 116.1 NJ 360.0 510.7 274.3 634.2 NM 119.8 191.1 102.6 222.4 NV 122.8 191.1 102.7 225.5 NY 1,073.1 1,581.3 849.3 1,922.4 OH 411.4 671.4 360.6 772.0 OK 155.5 298.3 160.2 315.7 PA 427.6 666.8 358.2 785.7 RI 39.5 55.5 29.8 69.3 SC 158.6 231.4 124.3 282.9 SD 33.8 57.7 31.0 64.8 TN 361.1 545.6 293.0 654.2 TX 1,039.5 1,735.9 932.4 1,971.9 UT 91.9 158.2 85.0 176.9 VA 262.6 363.8 195.4 458.0 VT 22.4 31.8 17.1 39.5 WA 422.0 646.2 347.1 769.1 WI 193.5 320.1 171.9 365.4 WV 57.9 104.7 56.2 114.1 WY 16.9 38.5 20.7 37.6 _____________________________________________________________________________ US 13,060.3 20,109.9 10,801.0 23,861.4 ______________________________________________________________________________
These incremental losses from e-commerce are estimated to range from $17.1 million in
Vermont to $1.49 billion in California, and are highly correlated with state population (0.98) and the state and local tax rate (0.48).
The loss in Column 3 should not be interpreted as the taxes that states would collect if Congress enacted legislation establishing nexus for firms with economic rather than physical presence. Rather, it is simply the incremental effect of e-commerce beyond any losses already occurring from inability to collect sales and use taxes. Column 2, the total e-commerce revenue loss of $20.1 billion, is the estimate of the total revenues from collecting all taxes due on
e-commerce transactions.26 This estimate assumes 100 percent compliance with the sales and use
taxes.
The share of total tax revenues that each state loses is a useful way to measure the importance of the loss to specific states. For purposes of this calculation, each state’s total tax revenue is assumed to be the same percentage of personal income in 2003 as in 1996.27 The loss to state governments is given in Table 4 and the loss to local governments is in Appendix Table 1. Note first that, in 2003, the state-level share of the national incremental e-commerce loss will amount to 1.52 percent of total state taxes (in sales-taxing states only), while the state-level share of the national total e-commerce loss is 2.84 percent and the combined loss is 3.37 percent.
These national estimates mask wide variation across states, however. Of course, there is no revenue loss for the five states without a sales and use tax. For the states with sales and use taxes, the incremental (total) loss from e-commerce ranges from a low of 0.90 (1.68) percent of state tax revenues (setting aside D.C.) in Massachusetts to a high of 2.62 (4.88) percent in Texas. The combined loss ranges from 2.05 percent in Massachusetts to 5.83 percent in Florida. The estimated incremental revenue loss as a share of tax revenues is positively correlated with the importance of the sales tax to states’ pre-e-commerce tax structures (0.87), the breadth of states’ sales tax bases (0.52) and states’ tax rates (0.25).
Table 4: State Revenue Losses as Percentages of Total State Taxes, 2003 _____________________________________________________________________ (1) = Trend Revenue Loss (Without E-Commerce)
(2) = Total Revenue Loss Due to E-Commerce
(3) = Incremental (New) Revenue Loss Due to E-Commerce (4) = Total Combined Revenue Loss = (1) + (3)
______________________________________________________________________ State (1) (2) (3) (4) ______________________________________________________________________ AL 1.37 2.09 1.12 2.49 AR 1.81 3.00 1.61 3.42 AZ 1.80 2.82 1.51 3.32 CA 1.87 2.65 1.42 3.30 CO 1.28 2.22 1.19 2.47 CT 1.75 2.50 1.34 3.09 DC 1.06 1.51 0.81 1.87 FL 3.33 4.64 2.49 5.83 GA 2.01 2.97 1.59 3.60 HI 2.67 3.33 1.79 4.46 IA 1.35 2.66 1.43 2.78 ID 1.55 2.60 1.40 2.95 IL 1.74 2.95 1.58 3.32 IN 1.70 2.73 1.47 3.17 KS 1.69 2.85 1.53 3.22 KY 1.60 2.63 1.41 3.01 LA 1.94 3.68 1.98 3.91 MA 1.15 1.68 0.90 2.05 MD 1.77 2.41 1.29 3.06 ME 2.01 2.78 1.49 3.50 MI 1.76 2.90 1.55 3.32 MN 1.75 2.81 1.51 3.25 MO 1.70 2.76 1.48 3.19 MS 2.25 3.86 2.07 4.32 NC 1.34 1.99 1.07 2.41 ND 1.28 2.79 1.50 2.78 NE 1.56 2.78 1.49 3.05 NJ 1.70 2.41 1.29 2.99 NM 2.27 3.62 1.94 4.21 NV 2.82 4.39 2.36 5.18 NY 1.16 1.72 0.92 2.09 OH 1.58 2.58 1.38 2.96 OK 1.77 3.40 1.83 3.60 PA 1.61 2.51 1.35 2.96 RI 1.71 2.41 1.29 3.01 SC 2.07 3.02 1.62 3.69 SD 2.57 4.39 2.36 4.93 TN 3.08 4.65 2.50 5.58 TX 2.92 4.88 2.62 5.54 UT 1.89 3.26 1.75 3.65 VA 1.61 2.22 1.19 2.80 VT 1.81 2.57 1.38 3.19 WA 2.24 3.43 1.84 4.08 WI 1.37 2.27 1.22 2.60 WV 1.54 2.79 1.50 3.04 WY 1.49 3.39 1.82 3.31 _______________________________________________________________________ US 1.85 2.84 1.52 3.37
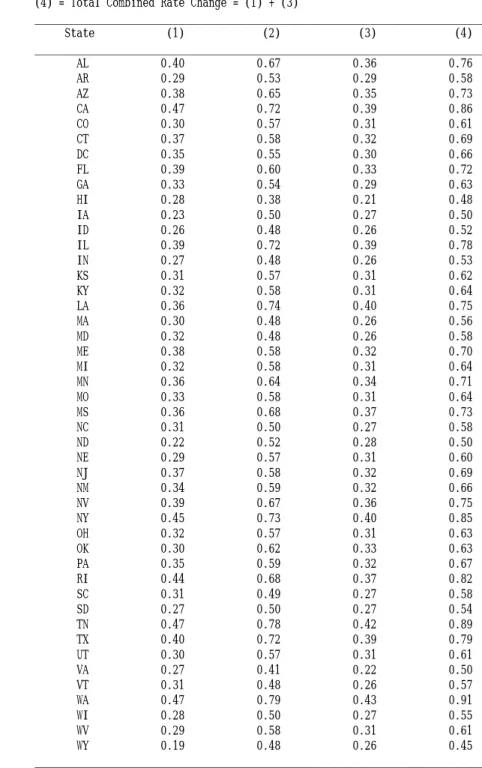
States have demonstrated a propensity to raise tax rates to offset previous base reductions, and it is reasonable to expect states to respond to further base narrowing with additional rate hikes. As rates are increased, the sales tax base will be narrowed further as purchasers substitute non-taxable items and use remote purchasing to evade the tax. Sales tax rate increases necessary to replace the lost revenues were calculated for each state and are given in Table 5. Washington (0.91 percentage points) will need the largest rate increase and
Wyoming (0.45 percentage points) will need the smallest increase to offset the total base decline (column 4 of Table 3). The tax rate increases are correlated with tax rates (0.94), population (0.47), breadth of the initial tax base (-0.30), and the percent of revenues raised from sales taxes (0.29).
Policy Implications
The sales tax base erosion that is stimulated by e-commerce is part of a downward trend in the tax base that has been underway for many years. However, e-commerce has accelerated the trend that otherwise appeared to have been slowing in the middle 1990s. The revenue loss estimates provided here, totaling nearly $24 billion in 2003, suggest that the combination of the trend decline and e-commerce will significantly alter state tax structures during the next several years unless states increase their sales tax rates. State and local governments will be confronted with several choices: they must either cut expenditures, increase sales tax rates, or shift to another tax source, such as the property or income tax. Each choice has important implications. The effects of the first option, shrinking government, depend on the choices that are made. For example, reducing education and infrastructure spending could lower the economy’s growth potential.
If the size of government is not cut, the issue comes down to the way in which state and local governments are to finance themselves. With these decisions goes the full range of
implications regarding taxation, including equity, administration and compliance, and behavioral incentives. From a public policy perspective the issue is whether state and local governments are better financed with the triad of sales, property, and income taxes, or whether the sales tax base
Table 5: Sales Tax Rate Changes Necessary in 2003 to Maintain Constant Revenue
______________________________________________________________________ (1) = Without E-Commerce
(2) = Total Due to E-Commerce
(3) = Incremental (New) Due to E-Commerce (4) = Total Combined Rate Change = (1) + (3)
___________________________________________________________________________ State (1) (2) (3) (4) ___________________________________________________________________________ AL 0.40 0.67 0.36 0.76 AR 0.29 0.53 0.29 0.58 AZ 0.38 0.65 0.35 0.73 CA 0.47 0.72 0.39 0.86 CO 0.30 0.57 0.31 0.61 CT 0.37 0.58 0.32 0.69 DC 0.35 0.55 0.30 0.66 FL 0.39 0.60 0.33 0.72 GA 0.33 0.54 0.29 0.63 HI 0.28 0.38 0.21 0.48 IA 0.23 0.50 0.27 0.50 ID 0.26 0.48 0.26 0.52 IL 0.39 0.72 0.39 0.78 IN 0.27 0.48 0.26 0.53 KS 0.31 0.57 0.31 0.62 KY 0.32 0.58 0.31 0.64 LA 0.36 0.74 0.40 0.75 MA 0.30 0.48 0.26 0.56 MD 0.32 0.48 0.26 0.58 ME 0.38 0.58 0.32 0.70 MI 0.32 0.58 0.31 0.64 MN 0.36 0.64 0.34 0.71 MO 0.33 0.58 0.31 0.64 MS 0.36 0.68 0.37 0.73 NC 0.31 0.50 0.27 0.58 ND 0.22 0.52 0.28 0.50 NE 0.29 0.57 0.31 0.60 NJ 0.37 0.58 0.32 0.69 NM 0.34 0.59 0.32 0.66 NV 0.39 0.67 0.36 0.75 NY 0.45 0.73 0.40 0.85 OH 0.32 0.57 0.31 0.63 OK 0.30 0.62 0.33 0.63 PA 0.35 0.59 0.32 0.67 RI 0.44 0.68 0.37 0.82 SC 0.31 0.49 0.27 0.58 SD 0.27 0.50 0.27 0.54 TN 0.47 0.78 0.42 0.89 TX 0.40 0.72 0.39 0.79 UT 0.30 0.57 0.31 0.61 VA 0.27 0.41 0.22 0.50 VT 0.31 0.48 0.26 0.57 WA 0.47 0.79 0.43 0.91 WI 0.28 0.50 0.27 0.55 WV 0.29 0.58 0.31 0.61 WY 0.19 0.48 0.26 0.45 ___________________________________________________________________________
should be allowed to continue shrinking and the focus increasingly shifted toward other broad-based taxes. Replacement of the lost local sales tax revenues with higher property taxes and the lost state revenues with higher income taxes would change the overall revenue mix. In our baseline scenario, the sales tax would fall from 25.1 percent to 22.6 percent of revenues between 1996 and 2003 if there were no rate hikes. In order to recover this loss in a revenue-neutral fashion, the personal income tax would have to rise from 21.2 to 23.2 percent of total taxes and the property tax would have to rise from 30.2 percent to 30.6 percent. These are large structural changes in the short window examined here, and the shifts could be much larger over the next decade.
REFERENCES
Cline Robert, and Thomas Neubig. “The Sky is not Falling: Why State and Local Revenues were not Significantly Impacted by the Internet in 1998.” State Tax Notes. July 5, 1999, pp. 43-51.
Due, John F. and John L. Mikesell. Sales Taxation: State and Local Structure and Administration. The Urban Institute Press, Washington D.C. 1994.
Fox, William F. and Charles Campbell. “Stability of the State Sales Tax Income Elasticity.” National Tax Journal. Volume XXXVII, No. 2, June 1989, pp. 201-212.
Fox, William F. and Matthew N. Murray. “The Sales Tax and Electronic Commerce: So What’s New?” National Tax Journal. Volume L, No. 3, September 1997, pp. 573-592.
Goolsbee, Austan and Jonathan Zittrain. “Evaluating the Costs and Benefits of Taxing Internet Commerce.” National Tax Journal, Vol. LII, No. 3, September 1999, pp. 413-428.
Goolsbee, Austan. “In a World Without Borders: The Impact of Taxes on Internet Commerce.” Quarterly Journal of Economics, forthcoming.
Hawkins, Richard R. “Price Elasticities in Consumer Sales Tax Revenue,” Public Finance Review Volume 28, March 2000, pp. 171-184.
Mikesell, John L. “Fiscal Effects of Differences in Sales Tax Coverage: Revenue Elasticity, Stability and Reliance.” Proceedings of the Eighty-fourth Annual Conference, National Tax Association—Tax Institute of America. Columbus, Ohio: pp. 50-57, 1991.
Mikesell, John L. "State Retail Sales Taxes, 1995 - 1998: An Era Ends," State Tax Notes, Feb 21, 2000.
Organization for Economic Cooperation and Development. The Economic and Social Impact of Electronic Commerce. Paris: OECD, 1999, pp. 166.
Ring, Raymond J. Jr. “Consumer’s Share and Producer’s Share of the General Sales Tax.” National Tax Journal, Vol LII, No. 1, March 1999, pp. 79-90.
State Taxation Institute. “Taxability of Electronic Downloads Varies among States.” E-Commerce Tax Alert Volume 1, Number 1, 2000, pp. 2-4.
Appendix Table 1: Local Revenue Losses as Percentages of Total Local Taxes, 2003
_______________________________________________________________
(1) = Trend Revenue Loss (Without E-Commerce) (2) = Total Revenue Loss Due to E-Commerce
(3) = Incremental (New) Revenue Loss Due to E-Commerce (4) = Total Combined Revenue Loss = (1) + (3)
_______________________________________________________________________ State (1) (2) (3) (4) _______________________________________________________________________ AL 2.15 3.27 1.76 3.91 AR 1.28 2.11 1.13 2.41 AZ 1.01 1.57 0.85 1.85 CA 0.86 1.22 0.66 1.52 CO 1.36 2.36 1.27 2.63 CT 0.00 0.00 0.00 0.00 DC 0.00 0.00 0.00 0.00 FL 0.15 0.21 0.11 0.26 GA 1.18 1.74 0.94 2.11 HI 0.00 0.00 0.00 0.00 IA 0.10 0.19 0.10 0.20 ID 0.00 0.00 0.00 0.00 IL 0.36 0.61 0.33 0.69 IN 0.00 0.00 0.00 0.00 KS 0.58 0.98 0.52 1.10 KY 0.00 0.00 0.00 0.00 LA 2.34 4.44 2.38 4.72 MA 0.00 0.00 0.00 0.00 MD 0.00 0.00 0.00 0.00 ME 0.00 0.00 0.00 0.00 MI 0.00 0.00 0.00 0.00 MN 0.03 0.05 0.03 0.05 MO 1.13 1.83 0.98 2.11 MS 0.01 0.01 0.01 0.01 NC 1.04 1.54 0.83 1.86 ND 0.25 0.54 0.29 0.54 NE 0.36 0.64 0.34 0.70 NJ 0.00 0.00 0.00 0.00 NM 1.88 2.99 1.61 3.48 NV 0.31 0.49 0.26 0.58 NY 0.88 1.30 0.70 1.58 OH 0.37 0.61 0.33 0.70 OK 1.78 3.42 1.83 3.61 PA 0.04 0.07 0.04 0.08 RI 0.00 0.00 0.00 0.00 SC 0.13 0.20 0.10 0.24 SD 0.81 1.38 0.74 1.55 TN 1.56 2.36 1.27 2.83 TX 0.60 1.00 0.54 1.13 UT 0.84 1.44 0.77 1.61 VA 0.51 0.70 0.38 0.88 VT 0.00 0.00 0.00 0.00 WA 1.15 1.76 0.95 2.10 WI 0.12 0.21 0.11 0.24 WV 0.00 0.00 0.00 0.00 WY 0.59 1.34 0.72 1.31 _____________________________________________________________________________ US 0.57 0.89 0.48 1.05 ______________________________________________________________________ Source: Authors’ calculations.
ENDNOTES
1
The authors wish to thank Matthew Murray, Douglas Holtz-Eakin, and two anonymous reviewers for very helpful comments on an earlier draft.
2
See Fox and Murray (1997) for a discussion of various issues surrounding the taxation of electronic commerce.
3See Cline and Neubig (1999) and Goolsbee and Zittrain (1999), for examples. 4These percentages are weighted averages for sales taxing states.
5
The combination of Hawaii’s broad taxation of consumer purchases and taxation of certain business inputs results in a base that exceeds personal income.
6Tax base definitions for the sales and use taxes are very similar (see Due and Mikesell, 1994). 7
Multi-state vendors would probably experience higher compliance costs associated with collecting and remitting sales and use taxes than single state vendors. However, if the choice is between collecting use taxes from multi-state vendors or from individual consumers, higher costs would be expected for the sum of state governments and all individual consumers than for the sum of state governments and the multi-state vendors.
8Today, most states exempt industrial equipment, but machinery is fully taxed in some states,
partially taxed in others, and taxed at a lower rate in others.
9The Census of Governments reports local sales tax revenues in 32 states. 10
In some cases Census sales tax data include revenues from sources other than the general sales tax and exclude revenues from special levies normally included in the sales tax. For example, the Washington business occupations tax is included and the Maryland tax on motor vehicles and boats is excluded (see Due and Mikesell, 1994). Also, some states use multiple tax rates. For example, the District of Columbia has a 5.75 percent general tax rate, a 13 percent tax on hotel rooms, a 12 percent tax on parking, a 10 percent tax on food and drink for immediate
consumption, and an 8 percent tax on beer, liquor, and wine for off premises consumption. John Mikesell used painstaking means to develop a more accurate data series on sales tax bases for 1995-1998, and has graciously provided the data for this study (see Mikesell, 2000). Census-derived sales tax bases were adjusted from 1979 to 1996 to match the difference between Mikesell’s 1996 data and the 1996 data drawn directly from the Census. It should be noted that this correction only affects the intercept terms for states and not the slope coefficients. No data are available to measure the time trend effects.
11
For example, see Fox and Campbell (1984) who find the income elasticity varies from 0.15 to 1.0, depending on the category of goods, and Mikesell (1991) who finds the elasticity varies from 0.76 to 1.22, depending on the state.
12
13Correcting these equations for auto-correlation yielded forecasts for state personal income that
differed from prior expectations in some cases. Consequently, we used uncorrected results. The coefficient estimates, which are still unbiased and consistent, yielded very similar overall
conclusions.
14All estimates were corrected for jump-off error in 1996, presuming that the model fails to
adequately account for shifts in the tax base during the last two years. Had this correction not been made, the main effect on the empirical estimates provided here would be to more than double the trend decline in base shrinkage without e-commerce. Nonetheless, the primary conclusions regarding the losses from e-commerce are essentially unchanged as a result of making this correction.
15Analysts have not separated the sources of sales tax base shrinkage—legislated changes, the
shift to services, and increased remote sales—for all of the states. The forecast of continued shrinkage provided here implicitly assumes that the combination of all three factors would remain important. There are practical limits on the extent to which these factors, and particularly legislated changes, can occur, but there is no reason to presume that the aggregate of states is nearing the limits. States have continued to legislate or consider legislating base narrowing. Additional states have recently exempted food from the base (for example, Georgia) and other states have given it serious consideration (for example, Tennessee). A number of states are granting sales tax holidays for clothing, and the list of new exemptions continues.
16The estimated tax rate is the sum of the legislated state rate and a weighted average local rate
defined as local sales tax revenues divided by the state sales tax base. Throughout the paper, we have chosen not to explicitly consider the effects of international sales. Sales of tangible goods from outside the US are likely to be a small part of total e-commerce during the time period examined in this paper, and services are largely untaxed under current law. In any case, tangible goods would have to be shipped (and would probably be warehoused) within the US, and this offers the opportunity to collect the tax.
17Forrester’s detailed estimates are proprietary.
18Forrester’s estimates used in this paper were made prior to the rapid creation by large bricks
and mortar based firms of parallel corporations (with very similar names) that operate through e-commerce, and may not have nexus in most states. These developments could result in even faster sales growth. The Boston Consulting Group (2000) has recently estimated e-commerce sales of $2.0 trillion in 2003, versus the less than $1.5 trillion estimated by Forrester, and used in this paper. Forrester recently prepared a new forecast and significantly increased its B2B e-commerce forecast.
19The five states without sales taxes, Alaska, Delaware, Montana, New Hampshire, and Oregon,
comprise 2.48 percent of the U.S. population.
20The percentage could have been adjusted for the expected differences in the propensity to
purchase over the internet, but the simple population weighted assumption was chosen as a more conservative option.
21As with many of the parameter assumptions used in this study, empirical guidance is either very
limited or nonexistent. No studies are available, for example, on use tax collections from individual consumers. A number of states provide a line on their individual income tax return to allow for voluntary remittance of use taxes. The revenues obtained through this mechanism provide some evidence of the use tax’s weak performance. In a recent unpublished survey of the states, the Federation of Tax Administrators received data from 9 that include the line on the income tax return, and found no state that collected more than $1.5 million. Maine, which required a minimum payment of 0.4 percent of AGI, received the largest amount. The second highest, Wisconsin, where payment depends entirely on voluntary reporting, collected $1.4 million, based on reporting by fewer than 1 percent of taxpayers. The assumption used here is comparable to assuming that consumers randomly purchase from firms that have nexus in states representing 10 percent of the U.S. population. This assumption is of surprisingly little
consequence in the calculation of overall revenue losses. For example, doubling the use tax collection assumption from 10 to 20 percent on non-automobile purchases (or from 20.2 to 29.7 percent on total sales) would only decrease the incremental loss from e-commerce from $10.8 billion to $10.5 billion.
22Potentially digitizable B2C categories (software, books, music, videos, and toys/video games)
and B2B categories (computing and electronics) make up slightly less than 28 percent of total e-commerce in 2003. Our assumption is that at least half of this represents tangible,
non-digitizable goods.
23Again, very little analysis of use tax compliance for business to business purchases is available.
The State of Washington undertook a study of use tax compliance of registered taxpayers in 1991 and found 19.9 percent non-compliance for the use tax, the highest non-compliance rate of any tax. The Washington study can be expected to understate non-compliance for remote sales, however. Audit rates are generally very low, and normally well below 3 percent (see Due and Mikesell, 1994), and the ability to uncover non-compliance through audit is certainly far less than perfect. Many firms, and particularly out of state firms, may not register for tax purposes. Also, use tax compliance in the study is a combination of compliance on remote purchases (which is probably not as good) and compliance for items purchased with a resale certificate but which are taxable. Further, non-compliance may be expected to grow with e-commerce.
Tennessee offers a good example of use tax behavior. Use tax collections were 4.4 percent of 1998 sales and use tax collections, but use tax collections on remote sales were less than 2.3 percent of revenues. Based on Ring’s (1999) estimates of the consumer share of the sales and use tax, only about 6.1 percent of taxes paid by business come from use tax paid on remote sales. This suggests either that firms buy few inputs from outside the state or that compliance is relatively low.
24
The combination of 65.2 percent compliance with the B2B use tax and this 50 percent reduction for previous non-compliance can be interpreted as a combined 82.6 percent
“compliance” rate. With this alternative interpretation, incremental revenue losses in column 3 rather than total e-commerce losses in column 2 in Tables 3 through 5 are the relevant indicators of loss to the extent that the additional 50 percent subtraction is seen as further compliance.
to $11.8 billion on the high side. Also, as mentioned earlier, doubling the B2C compliance on non-automobile purchases (increasing overall B2C compliance to 29.7 percent) would only decrease the loss to $10.5 billion.
26Also, states would collect a somewhat lower amount if Congress created nexus on the basis of
economic presence, but with a de minimus rule excluding small firms.
27 To be sure, there has been a slight upward progression in taxes as a percent of personal
income. State tax revenues grew from 6.10 percent of personal income in 1979 to 6.53 percent in 1996 and local tax revenues rose from 3.94 percent to 4.22 percent during the same time period. If revenues continue their upward trend, the revenue loss estimates will represent slightly smaller shares of total state taxes.