INTERPRETATION OF MERCURY INJECTION EXPERIMENTS USING
A MINIMUM SET OF POROUS DESCRIPTORS DERIVED BY
QUANTITATIVE IMAGE ANALYSIS
Y
ANNICKA
NGUY1,
S
OPHIEB
ELIN1,
R
OBERTE
HRLICH2 ANDA
ZITAA
HMADI11LEPT-ENSAM, UMR 8508, Esplanade des Arts et Métiers, 33405 Talence cedex France, 2Residuum Energy,
1048 S Oak Hills Way, Salt-Lake City, USA
e-mail: [email protected], [email protected]
(Accepted May 28, 2002)
ABSTRACT
The porosity exposed in a series of petrographic thin sections from a sub-arkosic sandstone reservoir of the Alwyn area (North Sea) is described by 5 morphological porous descriptors, Pore-Types, obtained by quantitative image analysis procedures and pattern recognition algorithms developed by Ehrlich et al. (1991a). By combining Pore-Type data with capillary pressure curves, we obtain preliminary results showing that in the studied reservoir, the achieved Pore-Types relate better to petrophysics when they are complemented with a sedimentological information.
Keywords: capillary pressure curves, connectivity, morphology, Pore-Types, sandstone, throats.
INTRODUCTION
For a variety of transport processes in porous media, there exists a strong relation between the structure at the pore-scale and the macroscopic transport properties. The comprehensive and predictive study of such relation requires the availability of analytical models relating the physical property of interest to a minimum set of geometrical parameters describing those aspects of the fabric relevant to physics.
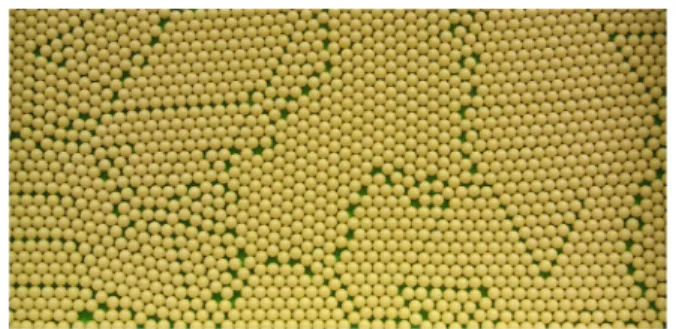
As far as sedimentary detritic granular rocks such as sandstones are concerned, a variety of studies converged towards a general structural model where the pore space is partitioned into a few classes of porosity whose size and shape are controlled by the dynamics of the aggregation (Graton and Fraser, 1935; Berg, 1975; Ehrlich et al., 1991a,b; McCreesh et al., 1991; Prince et
al., 1995). This general model, illustrated qualitatively
in Fig. 1 by an experiment with a mono layer of spheres, highlights two classes of porosity: 1 loose-packed pores, and 2 close-packed pores.
Graton and Fraser (1935) acknowledged first the inevitable occurrence of this domainal structure arising from the dynamics of the sedimentation: due to the simultaneous sedimentation of the grains, many foci of close packing form simultaneously, but no process exists to insure the mutual, parallel alignment of their internal fabrics. As the well-packed clusters grow towards another, an intervening compromise
zone of loose-packing is formed. This fabric was generalized into 3-D by Azaroff (1960).
Fig. 1. General model for the structure of sedimentary
granular rocks.
In the structural model above, packing (and grain size) control both pore size and throat allowing pores of like type to be mutually adjacent (in the form of continuous circuits or within well-packed clusters of grains) and connected by similarly sized throats (Graton and Fraser, 1935; Berg, 1975; McCreesh et
al., 1991). Thus, at the time of deposition, pores of
like type determine the flow paths. Of course, the influence of pores of like type on the flow-paths may then be weakened by the diagenetic overprint. Yet, the availability of this general structural model suggests that a set of porous descriptors will show a petrophysical relevance if they describe the different classes of porosity illustrated in Fig. 1.
classified into a few classes of objects, called Pore Types. Pore Types are derived from the size and shape (the morphology) of the PORe ELements (porels) exposed in a series of petrographic thin sections and are interpreted as the consequence of the depositional and post-depositional processes at the origin of the rock. The petrophysical relevance of Pore Types has been quantified for a variety of sandstone reservoirs in the form of the association between Pore Types and throat size, obtained by blending Pore Type data with capillary pressure data (McCreesh et al., 1991). The "Pore Types / throat size" relation yielding all the necessary information to parameterize physical models of tube-like type, the effects of Pore Types on physical properties such as permeability, formation factor etc. ... have been documented for a variety of case studies (Ehrlich et al., 1991b).
This work is an application of the Ehrlich et al. (1991a, b) and McCreesh et al. (1991) approach to a series of sub-arkosic sandstone samples from the Brent of the Alwyn area (North Sea) showing various amounts of kaolinite and illite (Belin et al., 1999). In a previous contribution (Anguy et al., 1999), we showed that, for this particular reservoir, the achieved Pore Types were not sufficient to interpret a series of capillary pressure curves measured on the plugs from which were cut the thin sections used to determine the Pore Types. The objective of the current work is to evaluate if such an interpretation becomes possible when the sedimentological context associated to the Pore Types is taken into account. The sedimentological information considered herein being incomplete, this work is a preliminary report.
GEOMETRICAL CHARACTERIZATION
Ehrlich et al. approach (1991a) relies on the idea that the multitude of elementary closed loops of porosity (PORe ELements: porels) observed in a thin section such as Fig. 2 is the 2-D signature of a few classes of 3-D objects, or Pore Types, intersected by the plane of section.
Pore Types determination requires the availability of a series of thin sections. For each thin section, a statistically significant number of porels are submitted to erosion / dilation (ED) procedures where each porel is smoothed by progressive degrees of erosion followed by an equal degree of dilation. The number of pixels lost between successive ED cycles is recorded as a frequency roughness. The ED process stops as the number of erosions exceeds half the maximum width of the porel, the final dilation supplying the smooth part of the porel. The frequency
distribution of size and shape of the thin section is produced by pooling all porel smooth/rough spectra and converting pixel frequencies to proportions.
The frequency distribution of size and shape
are the input data to a pattern recognition / classification algorithm whose output expresses the porosity of the sample set as a linear mixture of N Pore Types (Eq. 1) (Miesch, 1976; Klovan and Miesch, 1976; Full et al., 1981).
≈ ≈ = ≈ A.F
Q , (1)
where:
≈
Q is a × ' matrix whose ith row is a ith
frequency distribution of size and shape with ' class intervals, each interval relating to a range of sizes of roughness (resp. smooth seed).
≈
A is a × N matrix
whose element aik is the proportion of the kth Pore
Type in the ith sample.
≈
F is a N × ' matrix whose
element fkj is the proportion of jth class interval in the
kth Pore Type.
Five Pore Types PTii=1, 5 (Figs. 3-7) were obtained
to describe the porosity of the 27 available thin sections (Anguy et al., 1999). The porels characteristic of a PT can be visualized on the digital binary images containing the PT in a high proportion and the PT can be replaced in its sedimentological framework(s) by examining the corresponding petrographic thin section.
1 mm
Fig. 2. 1981 × 2047 binary image of a sandstone
A B
Fig. 3. Pore Type 1. A: Intergranular primary pores at grain boundaries
within well-packed local clusters of grains. B: Small intra-particle pores in partially dissolved feldspars containing flaky clusters of illite.
A B
Fig. 4. Pore Type 2. A-B: Primary intergranular porosity ("packing
flaws") located essentially in contact zones between clusters of efficiently packed grains.
A B
Fig. 5. Pore Type 3. A: Primary intergranular porosity. B: Dissolved
feldspars.
A B
Fig. 6. Pore Type 4. A: Very connected primary intergranular porosity
("packing flaws"). B: Dissolved feldspars filled by flaky clusters of illite.
A
1mm
B
Fig. 7. Pore Type 5. A-B: Very large pores associated to dissolved
feldspars.
The optical porosity of the sample in Fig. 2 contains the 5 PTs in the following proportions: PT1: 0.19, PT2: 0.09, PT3: 0.43, PT4: 0.24 and PT5: 0.05.
DISCUSSION
PETROPHYSICAL RELEVANCE OF
THE POROUS DESCRIPTORS
The petrophysical relevance of PTs has been quantified for various reservoirs by relating PT data (matrix
≈
A in Eq. 1) to mercury capillary pressure
(Pc) data measured on the plugs from which the
available thin sections were cut (McCreesh et al., 1991).
0 0.2 0.4 0.6 0.8 1
0.1 1 10 100 1000 10000
Capillary Pr essur e (105 Pa)
Saturati
on
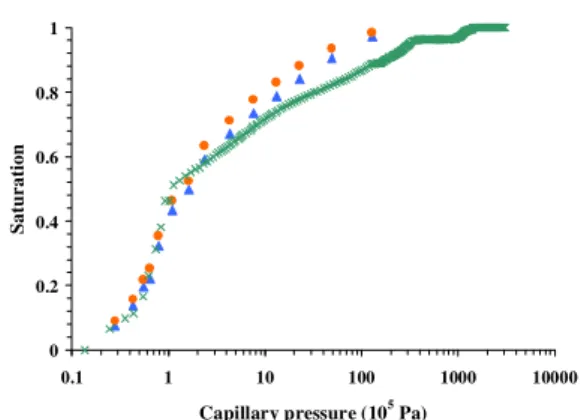
Fig. 8. Capillary pressure (Pc) curve measured on the plug from which was cut the thin section displayed in Fig. 1. Crosses represent experimental mercury saturations as a function of capillary pressure.
A Pc curve (Fig. 8) is a macroscopic measure of
the fraction of porosity (saturation) invaded by mercury as a function of pressure. For constant surface tension (480 mN.m-1) and contact angle for mercury (θ = 141.3 degrees), Pc relates to throat size according to
Pc = 7.492· 105 r-1 (Pc in Pa and r in µm). Fig. 8 is
accordingly a measure of the fraction of porosity lying behind throats of a given size.
The relation between PTs and throat size is searched in the form of a series of equations representing the relative filling of the Pore Types as a function of Pc (Eq. 2):
α α α α = N k 2 1 N k 2 1 jN jk 2 j 1 j N 2 k 2 22 21 N 1 k 1 12 11 j 2 1 i i i i i i i i . a a a a a a a a a a a a a a a a S S S S M M M M M , (2)
where: Sji is the relative saturation recorded for a jth
sample in a ith discrete pressure interval representing a range of throat sizes. Coefficient ajk is the
proportion of the kth PT in the jth sample (Eq. 1) In Eq. 2, αki is the searched fraction of a kth
Pore-Type invaded by mercury in a ith Pc interval. For a
series of discrete Pc intervals, the unknowns of the
model (αki) are determined by a maximum likelihood
estimator strategy. The correctness of the obtained relation between PTs and throat size (the achieved model of connectivity) can be checked by calculating simulated Pc curves from the determined αki k=1, N; i=1, M
and
≈
A matrix (N: number of PTs; M number of
The studied samples show a variable amount of illite or kaolinite. For each sample, the associated micro-porosity, not resolved in a binary image such as Fig. 2, was estimated in the manner of Sears (1984) from measured thin section clay content. A pseudo Pore Type PT0 was introduced in the right hand side of Eq. 2 allowing: 1. to take into account the estimated micro-porosity fraction, and 2. to re-scale, to a first approximation, fractions of optical porosity (matrix
≈
A ) to fractions of porosity seen by mercury
(vector
i ~
S in Eq. 2).
In a previous study (Anguy et al., 1999), we solved Eq. 2 for 15 discrete Pc bins in order to
interpret the measured Pc curves in terms of the
relative filling of the 5 PTs. The achieved model of accessibility, provided in Fig. 9A, did not permit to reproduce several experimental Pc curves as
illustrated in Figs. 10-13 and 15.
Implicit to searching the PTs / throat size relation is that such relation is fixed in all samples of the series (McCreesh et al., 1991). We saw previously that a single PT can relate to different sedimentological framework (Figs. 3, 5, 6). In this respect, if the sedimentological framework associated to a PT is a factor controlling the fixed nature of the PTs / throat size relation, then the model in Fig. 9A is compromised. This may explain its inability to reproduce some of the experimental Pc curves. As far as PT4 (Fig. 6) is
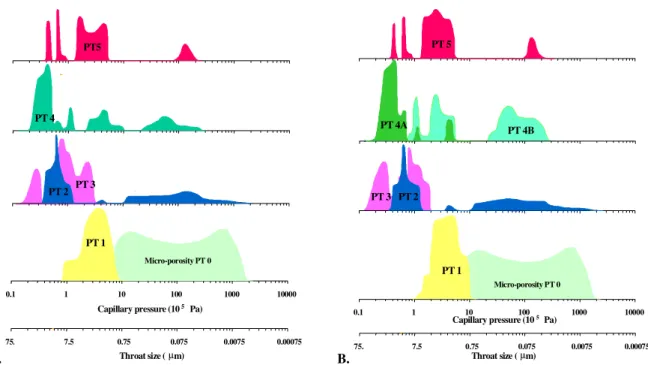
concerned, the information about its sedimentological interpretations can be fitted straightforwardly in Eq. 2. Indeed, the two sedimentological contexts associated to PT4 i.e., A: primary intergranular porosity and B: dissolved feldspars, are exclusive in the samples. So that one needs only duplicate PT4 in two Pore-Types PT4A and PT4B and then set to 0 in every sample the content of the duplicated PT whose sedimentological meaning does not apply to the sample. The following PT contents apply for example to Fig. 2 where PT4 (24%) is associated to dissolved feldspars: PT4A: 0. and PT4B: 0.24.
A.
0.1 1 10 100 1000 10000
Micro-porosity PT 0
PT 1
PT 2 PT 3
PT 4 PT5
Capillary pressure (105 Pa)
75. 7.5 0.75 0.075 0.0075 0.00075
Throat size (µm) B.
0.1 1 10 100 1000 10000
Micro-porosity PT 0
PT 1 PT 2 PT 3
PT 4A PT 4B
PT 5
Capillary pressure (105 Pa)
75. 7.5 0.75 0.075 0.0075 0.00075
Throat size (µm)
Fig. 9. Relation between PTs and throat size obtained A: by taking into account MORPHOLOGICAL criteria,
and B. by taking into account both MORPHOLOGICAL and SEDIMENTOLOGICAL criteria. In A and B, the 15 discrete regression equations predicting the filling of PTs at discrete Pc intervals are schematically represented as continuous distributions of PT volume invaded by mercury as a function of Pc (throat size). For example, in Fig. 9A, PT4 fills in 3 modes: 60% of PT4 fill in a 0.32 105 - 0.64 105 Pc range (throat sizes: 23.4 11.7 µm), another 16% of PT4 are invaded by mercury at a Pc range of 1.72 10
5
0 0.2 0.4 0.6 0.8 1
0.1 1 10 100 1000 10000
Capillary pressure (105 Pa)
Saturation
Fig. 10. Sandstone from the Tarbert Formation (Fig.
2) (core depth: 4125 m). Green crosses: experimental mercury saturation as a function of Pc. Orange circles: discrete simulated Pc curve calculated using the model of connectivity in Fig. 9A (Anguy et al. 1999). Blue triangles: discrete simulated Pc curve calculated using the model of connectivity in Fig. 9B.
0 0.2 0.4 0.6 0.8 1
0.1 1 10 100 1000 10000
Capillary pressure (105 Pa)
Saturation
Fig. 11. Same as Fig. 10 but for another sample of
the series from the Tarbert Formation (core depth: 3553.30 m).
0 0.2 0.4 0.6 0.8 1
0.1 1 10 100 1000 10000
Capillary pressure (105 Pa)
Saturation
Fig. 12. Same as Fig. 10 for a sample of the suite from
the Ness 2 Unit Formation (core depth: 3554.80 m).
0 0.2 0.4 0.6 0.8 1
0.1 1 10 100 1000 10000
Capillary pressure (105 Pa)
Saturation
Fig. 13. Same as Fig. 10 but for a sample of the suite
from the Ness 1 Unit Formation (core depth: 3585.00 m).
0 0.2 0.4 0.6 0.8 1
0.1 1 10 100 1000 10000
Capillary pressure (105 Pa)
Saturation
Fig. 14. Same as Fig. 10 but for another sample of
the suite from the Ness 2 Unit Formation (core depth: 3195.70 m).
0 0.2 0.4 0.6 0.8 1
0.1 1 10 100 1000 10000
Capillary pressure (105 Pa)
Saturation
Fig. 15. Same as Fig. 10 but for another sample of
We solved again Eq. 2 with PT4 duplicated according to its two sedimentological meanings and obtain the model of connectivity displayed in Fig. 9B. Experimental Pc curves that were not reproduced by
the model in Fig. 9A are now correctly matched (Figs. 12-13). For other samples (Figs. 10, 11 and 15) the differences between measured Pc curves and the
simulated Pc curves have been decreased.
This preliminary work suggests that in the case of the studied reservoir, a series of 5 porous descriptors, Pore Types, relate better to petrophysics when the morphological information is complemented by a sedimentological interpretation.
Because the Pore Types / throat size relationship provides all the parameters required by "tube-like" models for permeability, formation factor etc. (Ehrlich
et al., 1991b), this suggests that in this reservoir these
physical properties arise from both the morphology and the sedimentological context associated to the samples.
REFERENCES
Anguy Y, Belin S, Bernard D, Fritz B, Ferm JB (1999). Modeling physical properties of sandstone reservoirs by blending 2D image analysis data with 3D capillary pressure data. Phys Chem Earth (A) 24(7):581-6. Azaroff LB (1960). Introduction to solids. McGraw-Hill,
New York.
Belin S, Anguy Y, Bernard D, Fritz B, Ferm JB (1999). Caractérisation par analyse d’images de la micro-géométrie d’un réservoir gréseux illitisé (Alwyn, Mer du Nord). Bull Soc Geol France 170(3):367-77.
Berg RR (1975). Capillary pressures in stratigraphic traps. Am Assoc Petr Geol Bull 59(6):939-56.
Ehrlich R, Crabtree SJ, Horkowitz KO, Horkowitz JP (1991a). Petrography and reservoir physics I: objective classification of reservoir porosity. Am Assoc Petroleum Geol Bull 75(10):1547-62.
Ehrlich R, Etris EL, Brumfield D, Yan LP, Crabtree SJ (1991b). Petrography and reservoir physics III: physical models for permeability and formation factor. Am Ass Petr Geol Bull 75(10):1579-92.
Full WE, Ehrlich R, Klovan JE (1981). Extended Qmodel - objective definition of external end members in the analysis of mixtures. J Math Geol 13(4):331-44.
Graton LC, Fraser HJ (1935). Systematic packing of spheres with particular relation to porosity and permeability. J Geology 43:785-909.
Klovan JE, Miesch AT (1976). Extended CABFAC and QMODEL computer programs for Q-mode factor analysis of compositional data. Comput Geosci 1:61-76.
McCreesh CA, Ehrlich R, Crabtree S (1991). Petrography and reservoir physics II: relating thin section porosity to capillary pressure, the association between pore types and throat sizes. Am Assoc Petr Geol Bull 75(10):1563-78. Miesch AT (1976). Q-mode factor analysis of geochemical and
petrologic data matrices with constant row sums. US Geol Survey Prof Paper, 574G, 47pp.
Prince CM, Ehrlich R, Anguy Y (1995). Analysis of spatial order in sandstones II: grain clusters, packing flaws, and the meso-scale structure of sandstones. J Sedim Research A65(1):13-28.