The Enriched Object Oriented Software processes for Software
Fault Prediction
T. Ravi Kumar1, Dr. T. Srinivasa Rao2
#1. Sr.Asst professor, Department of CSE, AITAM Engineering College, Tekkali, (AP), India, #2. Associate professor, Department of CSE, GIT, GITAM University, Visakhapatnam, (AP), India.
Abstract
A software fault prediction is a demonstrated strategy in accomplishing high software unwavering quality. Prediction of fault-inclined modules gives one approach to help software quality designing through enhanced booking and venture control. Quality of software is progressively imperative and testing related issues are getting to be noticeably pivotal for software. This requires the need to build up a constant evaluation procedure that groups these progressively created frameworks as being faulty/sans fault. An assortment of software fault predictions procedures have been proposed, In fact different methodologies created by the numerous researchers, they may not be optimal while predication of faults. In this approach we are presenting the fault prediction approach with OO metrics alongside cyclomatic complexity and nested block depth, in acceptance testing, each capacity determined in the plan report can be freely tried, that is, an arrangement of experiments is produced for each capacity, not for every work process module or other module/segment. Our test results demonstrate the productive fault prediction with our algorithm parameters. Our approach predominantly focuses on the tally of faults before testing, expected number of faults, our classification which includes algorithmic and handling, control, rationale and succession, typographical Syntax blunders i.e. off base spelling of a variable name, customary cycle of articulations, off base instatement proclamations per module, this proposed classification approach demonstrates optimal results while analyzing the metrics with preparing tests after estimation.
Keywords: Metrics, Cyclomatic complexity, OO metrics, Fault prediction
I. Introduction
Software fault prediction is one of the vital angles to be considered while building up a software. It makes
treatment of vast undertakings [2]. The conventional methodologies are fault prediction works with the fundamental metrics like Lines of code(LOC),Number of blunders discovered, Number of mistakes found concerning the module, These parameters are not adequate to gauge the fault prediction and cost viability. Software faults might be configuration faults which are deterministic in nature and are recognized effortlessly and other sort of software faults is delegated being brief inward faults that are transient and are hard to be distinguished through testing [3]. It is hard to dissect the fault prediction by essentially measuring the software metrics of the project. We require a classification instrument for the examination of the anticipated results [4].The utilization of software in high-affirmation and mission-basic frameworks builds the need to create and evaluate measures of software quality. In this manner, software metrics are valuable in the opportune prediction of high risk segments amid the software advancement process such a prediction empowers software directors to target quality change endeavors to the required territories. For instance, preceding the framework test, recognizing the segments that are probably going to be faulty amid operations can enhance the adequacy of testing endeavors. Different software quality displaying strategies have been produced and utilized as a part of genuine software quality predictions. Classification-based demonstrating for software quality estimation is a demonstrated system in accomplishing better software quality.
II. Related Work
The objective association is a software purchaser side organization that gives different sorts of media transmission administrations utilizing gained software frameworks. In the software obtaining forms, the organization is in charge of prerequisites examination, structural outline, and acknowledgment testing, while designer side organizations are responsible for point by point configuration, programming unit/reconciliation/framework testing, and investigating. [1, 8]As the administrations develop in the quantity of varieties with shorter reestablishment cycles than at any other time, the principle inspiration here is improvement of acknowledgment testing to give brilliant administrations to clients. From this viewpoint, the essential objective of this paper is diminishment of acknowledgment test exertion utilizing procedures for anticipating faultprone modules [7]. Our
examination incorporates metrics accumulation, building indicator models, and surveying the lessening of test exertion.
C4.5 Algorithm
The C4.5 algorithm is an inductive directed learning framework which utilizes choice trees to speak to a quality model. C4.5 is a descendent of another enlistment program, ID3, and it comprises of four primary projects: choice tree generator, creation administer generator, choice tree mediator, and generation manage translator. The algorithm utilizes these four projects while building and assessing classification tree models. Diverse tree models were worked by fluctuating parameters: least hub measure before part and pruning rate.
The C4.5 algorithm orders certain preprocessing of information with the goal for it to construct choice tree models. Some of these incorporate property estimation portrayal sort, predefined discrete classes, and adequate number of perceptions for regulated learning. The classification tree is at first unfilled and the algorithm starts including choice and leaf hubs, beginning with the root hub.
Tree disc Algorithm
The Tree disc algorithm is a SAS full scale execution of the changed Chi-square Automatic Interaction Detection algorithm. It builds a regression tree from an info informational collection that predicts a predetermined all out reaction variable in light of at least one indicators. The indicator variable is chosen to be the variable that is most fundamentally connected with the needy variable as per a chi squared trial of freedom in the possibility table. [3, 5]
Regression tree-based models are worked by fluctuating model parameters keeping in mind the end goal to accomplish the favored harmony between the misclassification mistake rates, and to stay away from over fitting of classification trees. A summed up classification run is utilized to name each leaf hub after the regression tree is constructed. This classification lead is fundamentally the same as the approach took after, when utilizing S-PLUS regression trees as classification trees[8].
Sprint Sliq algorithm
manufacture classification tree models that can break down both numeric and all out traits. It is an altered rendition of the classification tree algorithm of CART, and uses an alternate pruning strategy in view of the base depiction length guideline. The algorithm has phenomenal versatility and investigation speed. Classification tree displaying utilizing Sprint-Sliq is refined in two stages: a tree building stage and a tree pruning stage. The building stage recursively allotments the preparation information until the point when each segment is either ""unadulterated"" or meets the quit part governs set by the client. The IBM Intelligent Data Miner apparatus, which actualizes the Sprint-Sliq algorithm, was utilized by our exploration gathering to construct classification trees. Sprint Sliq utilizes the Gini Index to assess the decency of split of all the conceivable parts. A class task lead is expected to group modules as fp and nfp.[9].
Logistic Regression
Logistic regression is a measurable demonstrating method that offers great model elucidation. Free factors in logistic regression might be straight out, discrete or ceaseless. In any case, the all-out factors should be encoded (e.g., 0, 1) to encourage classification displaying. Our exploration amass has utilized strategic regression to construct software quality classification models. [9]
Give xj a chance to be the jth free factor, and let xi be the vector of the ith module's autonomous variable esteems. A module being fp is assigned as an ''occasion''. Give q a chance to be the likelihood of an occasion, and consequently q=q/1-q is the chances of an occasion. The logistic regression show has the shape [10],
Log(q/1-q)=β0+β1x1+β1x2… … .βjxj+βmxm Where, log implies the common logarithm, bj is the regression coefficient related with autonomous variable xj, and m is the quantity of free factors. Logistic regression suits software quality demonstrating in light of the fact that most software designing measures do have a monotonic association with faults that is inalienable in the fundamental procedures. Given a rundown of applicant autonomous factors and a noteworthiness level, an, a portion of the assessed coefficients may not be essentially contrast.
III. Defect Prediction Metrics
The number of researcher has been studied many metrics and proposed different model based on different metrics. Each researcher was proposing new metrics to create the defect prediction model. The mostly used metrics are line of code, source code and process metrics. Source code- provides the information about the complexity of the software and stated that if source code is big then it would be complex and cause a no. of defects. The process metrics- stated the information about the development process, like interrelation or correlation, right of source code and modification in source code. Code metrics are directly related to the source code available where process metric is related with historical information archived. Code metric is also told as product metrics which is used to measure the complexity of source code. The different metric used are size metric which measure length, volume, quantity of software product. It is already told in previous section that most studied base on the machine learning approach or statically approach. The machine based model provides the information about the defect prone in source code known as classification or number of defects in source code known as regression. Kim et al. proposed a model based on bug cach algorithm. It is different than machine learning approaches. The main working theme of bug cache algorithm, it stored the list of locality information for previous most bug prone source code, methods or files [9]. The researcher also studied the preprocessing techniques used before the creating the model. The preprocessing technique is the important part of defect prediction model. To improve the assurance and quality, the preprocessing techniques used for feature extraction, normalization and noise minimization [8] [6]. The other most important studied perform by the researcher was cross project defect prediction which was not feasible for the new arrival software module, only few model had been achieved very less feasibility. But it was too low to accept. Various researchers further studied about the feasibility of cross project defect prediction and stated that to achieve feasibility is hard [30].
IV. Application of Defect Prediction
developer did not get acceptable defect prediction model [4]. Defect prediction could be benefits to prioritize warning by find bug. These study conducted by Rehman et al. [8]. Another application is to prioritize or extract test case. Regression test is costly for all test suits than many prioritizations and selection for test case. Defect prediction model produce the defect prone software and its ranks.
V. Research Background
In this, summary of metrics selected for this paper, machine learning methods used, research hypothesis and measures used for the model are presented.
A. Metrics and Fault Proneness
Fault proneness is defined as probability of presence of fault in the module. In our research fault proneness is binary dependent variable while other metrics form the independent variables. We aim at exploring the effect of metrics on the fault proneness of a class using machine learning methods
B. Research Hypothesis
We tested the hypothesis given below to test the machine learning methods used. Ho: There is no difference in accuracy of six machine learning classifiers. HA: At least one of the classifiers is more accurate than other.
C. Data Collection
This paper uses the datasets provided by Marco et al. [30]. The dataset is a collection of models and metrics of five software systems and their histories. These datasets are collection of models and metrics of five software systems and their histories.
D. Machine Learning and Model Prediction
Machine Learning is a branch of Artificial Intelligence which is concerned with design and development of algorithms that describes behaviors based on empirical data [6]. Researchers have started using machine learning as it provides better results than regression and can incorporate complex nature of data.
E. Measures for Model Validation
Specificity and Sensitivity validate the model’s correctness. While specificity means proportion of classes predicted to be fault prone, sensitivity states the classes correctly predicted to be fault prone.
Precision is the proportion of classes predicted correctly and F- measure is the harmonic mean on recall (sensitivity) and precision. Receiver operating characteristic (ROC) is plot of sensitivity on Y-coordinate and its specificity on x-Y-coordinate. ROC is used effectively to evaluate the performance of prediction models. Area under ROC Curve (AUC) is combined measure of sensitivity and specificity. To compute the accuracy of model being predicted, AUC is used [1].
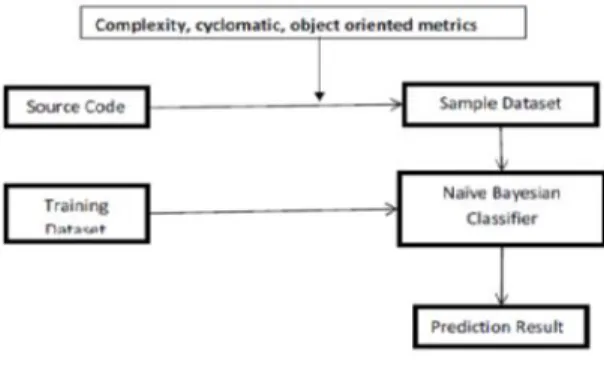
VI. Proposed Methodology
We are proposing a dynamic fault prediction with effective parameters or metrics optimal results. The paper is worried about faults because of Object arranged issues and measures with the coordinated essential metrics of software designing. Our proposed approach measures the metrics on the source code and dissects the Testing tests which are measured Algorithmic and handling, Control, rationale and arrangement, Typographical Syntax blunder and so on, at that point advances these metric measures to the classification lead for examination of testing test, the underneath chart indicates proposed design, at first complexity, cyclomatic and protest situated metrics connected over source code squares and measures separate parameters and regard them as testing tests and forward those testing tests to preparing tests to register back likelihood of testing test.
Fig. Proposed Architecture
Essential Complexity metrics
point figures the program exertion as far as volume and thickness.
n1 = the quantity of particular administrators n2 = the quantity of unmistakable operands N1 = the aggregate number of administrators
N2 = the aggregate number of operands
From these numbers, a few measures can be figured:
• Program vocabulary: n=n1+n2
• Program length: N=N1+N2
•Calculated program length: N'= 1 log2 1 + 2 log2 2
• Volume: V=N+ log2
• Difficulty: D=
• Effort: E=D V
Cyclomatic complexity
It is a quantitative measure of intelligent quality of the program. It specifically measures the quantity of straightly autonomous ways through a program's source code, these ways can be spoken to in different organizations as succession, while for cycle, if then else for basic leadership, until for emphasis and afterward figures the multifaceted nature as far as vertices or hubs and edges and as far as number of predicate hubs. Scientifically, the cyclomatic unpredictability of an organized program is characterized with reference to the control stream diagram of the program, a coordinated chart containing the fundamental pieces of the program, with an edge between two essential squares if control may go from the first to the second. The complexity M is then characterized as
M = E− N+ 2P,
Where
E = the quantity of edges of the chart.
N = the quantity of hubs of the chart.
P = the quantity of associated parts.
Protest situated metrics
Protested situated metrics are likewise one kind of metrics for measure the quality and cost of the venture as far as
•Weighted techniques per class
• Depth of the legacy tree
• Coupling between classes
• Response for a class
• Class measure lastly figures the polymorphism factor which incorporates the variables of number of abrogating strategies, number of techniques and number of sub classes
Classification
After the calculation of the considerable number of metrics, testing test information can be sent to the preparation tests to gauge and group the metric results with existing results as far as restrictive likelihood by utilizing Naive Bayesian classifier, which prompts the fault prediction examination.
Naive Bayesian Classification
Evaluating probabilities
P(X), P(X|Ci),and P(Ci)may be evaluated from given information Bayes Theorem:
P(Ci | X)=
Steps Involved:
1. Each information test is of the sort X=(xi) i =1(1)n, where xi is the estimations of X for characteristic Ai
2. Suppose there are m classes Ci, i=1(1)m.
P(Ci|X) > P(Cj|X)
i.e BC doles out X to class Ci having most elevated back likelihood molded on X
The class for which P(Ci|X) is boosted is known as the most extreme back theory.
From Bayes Theorem
3. P(X) is consistent. Just P(X|Ci), P(Ci) require be boosted.
•If class earlier probabilities not known, at that point expect all classes to be similarly likely
• Otherwise augment P(Ci) = Si/S Problem: processing P(X|Ci) is unfeasible!
4. Naïve suspicion: property autonomy
5. In request to characterize an obscure example X, assess for each class Ci. Test X is doled out to the class CiffP
P(X|Ci)P(Ci) > P(X|Cj) P(Cj).
Exploratory Analysis
We tentatively broke down the results by registering the all measures over code scraps independently and after that figured parameters sent towards preparing dataset.
Let us consider an example for computing Halstead metrics for small code snippet as follows main() { inta,b,c,avg;
scanf(“%d %d%d”, &a,&b,&c); avg=(a+b+c)/3; printf(“avg=%d”,avg);
}
The unique operators are main,(),(),int,scanf,&,=,*,/,printf
The unique operation are a,b,cavg,”%d %d
%d”,3,”avg=%d”
• 1=10, 2=7, =17
• N1=16,N2=15,N=31
• Calculated Program Length N’=10 log210 + 7 log27=52.9
• Volume V=31 log217=126.7
• Difficulty D=10/2 15/7=10.7
• Effort E=10.7 126.7=1,355.7
• Time required to program T=1,355.7/3000=0.004 For the measure of object oriented metrics, we considered weighted methods per class, Depth of the inheritance tree, Coupling between classes and overridden methods and for the measure of cyclomatic complexity we considering an
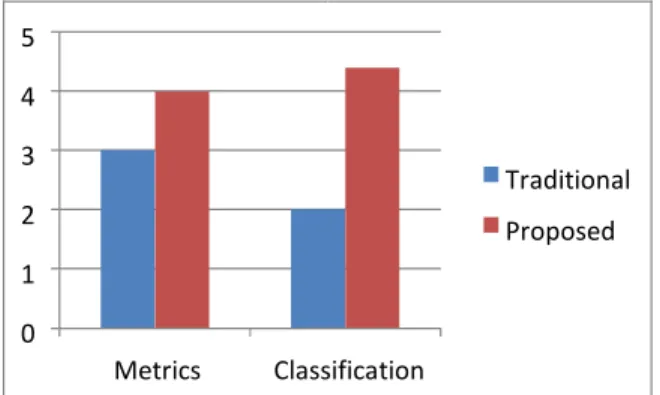
subroutine. Alternatively one may calculate the cyclomatic complexity using the decision points rule. Since there are two decision points, the cyclomatic complexity is 2 + 1 = 3. Now these measures can be forwarded to training dataset for classification of this testing sample, the following experimental results shows efficient acceptance results than the traditional approaches as follows
Fig 2: Comparative Analysis
VII. Conclusion
We are concluding our research work with efficient metrics computation with Complexity, cyclomatic, object oriented metrics over blocks of source code followed by naïve Bayesian classification to compute whether the testing sample is cost effective or not by analyzing fault prediction.
References
1. A. Bacchelli, M. D’Ambros, and M. Lanza. Are popular classes more defect prone? In Proceedings of the 13th International Conference on Fundamental Approaches to Software Engineering, FASE’10, pages 59– 73, Berlin, Heidelberg, 2010. Springer-Verlag.
2. A. Mockus and L. G. Votta. Identifying reasons for software changes using historic databases. In
example like if A = 354 then if B > C then A = B else A = C endif endif print A
Thus using the formal formula the cyclomatic complexity is 8-7 + 2 = 3. In this case there is no graph called or
0 1 2 3 4 5
Metrics Classification
Proceedings of the International Conference on Software Maintenance, 2000.
3. C. Bird, N. Nagappan, B. Murphy, H. Gall, and P. Devanbu. Don’t touch my code!: Examining the effects of ownership on software quality. In Proceedings of the 19th ACM SIGSOFT Symposium and the 13th European Conference on Foundations of Software Engineering, ESEC/FSE ’11, pages 4–14, New York, NY, USA, 2011. ACM.
4. C. Lewis, Z. Lin, C. Sadowski, X. Zhu, R. Ou, and E. J. W. Jr. Does bug prediction support human developers? Findings from a google case study. In International Conference on Software Engineering (ICSE), 2013.
5. E. Engstrom, P. Runeson, and G. Wikstrand. An empirical evaluation of regression testing based on fixcache ¨ recommendations. In Software Testing, Verification and Validation (ICST), 2010 Third International Conference on, pages 75–78, April 2010.
6. F. Akiyama. An Example of Software System Debugging. In Proceedings of the International Federation of Information Processing Societies Congress, pages 353–359, 1971.
7. F. Peters and T. Menzies. Privacy and utility for defect prediction: Experiments with morph. In Proceedings of the 34th International Conference on Software Engineering, ICSE ’12, pages 189–199, Piscataway, NJ, USA, 2012. IEEE Press.
8. F. Rahman and P. Devanbu. Comparing static bug finders and statistical prediction. In Proceedings of the 2014 International Conference on Software Engineering, ICSE ’14, 2014.
9. F. Zhang, A. Mockus, I. Keivanloo, and Y. Zou. Towards building a universal defect prediction model. In Proceedings of the 11th Working Conference on Mining Software Repositories, MSR 2014, pages 182–191, New York, NY, USA, 2014. ACM. 34
10. J. Nam, S. J. Pan, and S. Kim. Transfer defect learning. In Proceedings of the 2013 International Conference on Software Engineering, ICSE ’13, pages 382–391, Piscataway, NJ, USA, 2013. IEEE Press.
Authors
T. Ravi Kumar received M.Tech degree in Computer Science and Engineering from Jawaharlal Nehru technological University Hyderabad, A.P., India. And B.tech in computer Science and Information Technology from Jawaharlal Nehru Technological University Hyderabad, A.P., India. He is having 10 years of experience in teaching and presently working as Sr Assistant Professor in the Department of Computer Science and Engineering at Aditya Institute of Technology and Management, Tekkali [AITAM], A.P., India. His area of research includes Software Engineering, Fuzzy logic and Software Testing Methodologies.