Oviedo University Press 97 Economics and Business Letters
8(2), 97-105, 2019
The quality of public finances: where do we stand?
Marta Rodríguez-Vives*
Department of Fiscal Policies, European Central Bank, Germany
Received: 14 March 2019 Revised: 14 September 2019 Accepted: 14 September 2019
Abstract
There is a renewed interest in the quality of public finances (QPF). This is a multidimensional concept that can be approached from different angles. In practice, the QPF implies a budget composition that should promote long-term output growth and, at least, not raise inequality. This paper revisits the framework of QPF and provides some data on the changing trends in the composition of public finance in the post-crisis period in a sample of advanced countries.
Keywords: public finances, expenditure, revenue, COFOG data, inequality JEL Classification Codes: E62, H11, H20, H23, H50
1. Introduction
The quality of public finances (QPF) is a multidimensional concept, which had its major relevance during 2008-2009 under the auspices of the European Commission.1 This led to the definition of QPF comprising of five direct dimensions: the size of government, the sustainability of the fiscal position, the composition and efficiency of expenditure, the structure and efficiency of revenue systems, and fiscal governance. This framework was complemented by one indirect dimension, which is the short and long-term effect of fiscal policies on labour, goods and services market (Deroose and Kastrop, 2008).
The OECD has also been active in the recent years in providing analytical avenues to quantify the evolution of the QPF across OECD countries, based on statistics and econometric simulations. In a recent report, the OECD (2018) presents the key findings on how the structure of revenue and expenditure, together with public finance reforms, shape long-term output (per capita) and income distribution (real disposable income). The key dimensions for the analysis of the QPF are the size of government, the composition and effectiveness of expenditure, and the structure of the revenue systems. In an earlier OECD work, Cournède et al. (2013) proposed
* E-mail: marta.rodriguez@ecb.int.
Citation: Rodríguez-Vives, M. (2019) The quality of public finances: where do we stand?, Economics and Business Letters, 8(2), 97-105.
DOI: 10.17811/ebl.8.2.2019. 97-105
1 “The Quality of Public Finances is a broad concept with many facets…it is about the level and composition of
a methodology2 for selecting consolidation instruments that contribute to minimizing the
trade-offs of short- and long-term growth, equity and external rebalancing.
The concept of QPF is gaining momentum again. In the post-crisis world, governments in developed countries are facing more constrains. First, the stock of public indebtedness is higher than in the pre-crisis years (see Section 2). Second, there are renewed worries on the impact of ageing populations on public finances, in particular regarding government expenditure pressures on pensions and health care in several countries (European Commission, 2018). Third, there are also new uncertainties, such as the impact of the 4th Industrial Revolution on the labour market and public finances. This is leading to increased discussions on the role of distribution of governments3 (World Economic Forum, 2017) and the digital transformation of governments (IMF, 2018a). Overall, there is currently more emphasis in what is called ‘inclusive growth’ and various institutions have recently carried out detailed studies (e.g. European Commission, 2017; IMF, 2015; OECD, 2018). Inclusive growth is a multidisciplinary concept that can be defined as episodes of increases in real GDP per capita without a simultaneous deterioration in the distribution of household disposable income (De Mello and Jalles, 2019). In this context, the choices on how to better allocate public resources become even more imperative in the policy making.
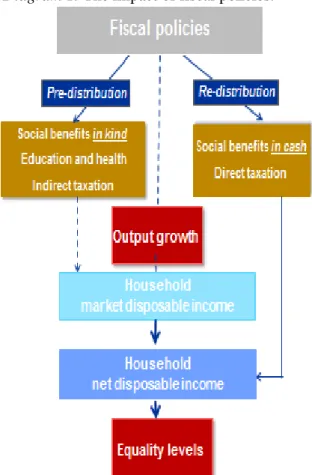
Diagram 1 illustrates that the government action - through fiscal policies - affect the distribution of household income (e.g. Bargain et al. 2018; European Commission, 2017; IMF 2015; Joumard et al., 2012). A direct effect is produced via re-distributive policies, i.e. social transfers in cash and the direct tax system. More progressive tax systems make the post-tax income distribution more equal. An indirect effect is produced via pre-distributive policies, i.e. social protection in kind, education and health, together with indirect taxation. Moreover, output growth impacts the (market and net) household disposable income.4 Hence, analyzing the inequality levels in the society is also an important indicator on the effectiveness of the government action in the economy. In this context, the net Gini inequality provides a measurement of the evolution of the distribution of the net disposable income (Rodríguez-Vives and Vedia, 2019).
The rest of the paper is structured as follows. Section 2 shows the main elements driving the QPF. Section 3 summarizes the evolution of the composition of public finance in the euro area compared with a sample of advanced countries. Section 4 outlines a set of conclusions.
2. The quality of public finances: a multidimensional concept
The QPF is a wide concept that can be analyzed from different angles. Diagram 2 proposes a synthesis of the several relationships around the concept. The QPF implies a budget composition that ideally promotes long-term output growth, while trying to preserve certain levels of equity in the income distribution. The success in the implementation of the QPF is subject to country-specific characteristics and constraints. Reforms in public finances should be aimed at improving the country-specific parameters.
2 The authors suggest a sequential approach for finding the most optimal budget. This implies starting from the
most desirable fiscal instrument, which could be exploited as much as possible taking into account certain country specific limits.
3 The possible impact of rapid technological changes in labour markets, is posing questions such as who will
provide insurance in the future in the society?, will it be privately or publicly funded?, or will our societies become more unequal?
4 There is no consensus on the specific channels through which income inequality are affected by economic growth
Diagram 1. The impact of fiscal policies.
Source: Author compilation based on the literature review. Notes: Market disposable income is the income before taxes and transfers in cash. Net disposable income is the income after tax and transfers in cash, i.e. after the redistribution of government.
Diagram 2. The quality of public finances revisited.
From an economic viewpoint, the composition of public finances mainly relates to the question
of the fiscal multiplier. This includes advocating for growth-friendly fiscal instruments, with the underlying idea that the composition of public finances particularly weighs on long-term output growth as a key government objective. Although there is no consensus on the size of fiscal multipliers, there is some evidence in the economic literature on the impact of the different fiscal instruments regarding their long-term growth-friendliness.5 It is important to keep in mind that the findings on the estimates of the long-term fiscal multipliers can only provide broad guidelines for evaluating the quality of fiscal policy strategies.6
On the expenditure side, the empirical evidence of individual instruments in mixed. In particular, there is preference for cuts in less productive instruments (social payments or subsidies), over education or health, which typically entail a favourable long-run growth impact.7 Likewise, the empirical evidence of the impact from government investment on growth can be positive (e.g. Angelopoulos et al., 2007) or negative (e.g. Afonso and Jalles, 2013, Afonso and Jalles, 20158). These conflicting views can be reconciled if productive and unproductive investment can be distinguished.9
On the revenue side, taxes are generally found to be distortionary on long-term growth. However, there are less distortionary options (e.g. IMF, 2013, Cournède et al., 2013). In particular, hikes in direct taxation (corporate taxes and personal income taxes) are likely to be most detrimental to growth, followed, while indirect taxes and particularly capital taxes (taxes on property) are likely to be least distortionary. Furthermore, Afonso and Jalles (2013) find that increases in any kind of taxes are usually beneficial for government investment.
The social costs of an ill-designed budget composition arise from the inefficient allocation of resources, but also when the burden of the adjustment falls on groups at the lower end of the income distribution. In practice, it is difficult to reconcile the objectives of growth and equity in several fiscal instruments. However, there are shifts in fiscal instruments that could be achievable through public finance reforms, which boost long-term average output per capita with no adverse consequences for income inequality (OECD, 2018). On the expenditure side, increasing public investment and lowering pension expenditure are found to be neutral in terms of equity. On the revenue side, hikes in recurrent property taxation and lowering corporate income tax effective rates are also neutral, while increasing taxes on heritage narrows income inequality gaps.
Overall, how to best design and implement the QPF framework is a complex issue that involves country-specific features and constraints. Diagram 2 provides an overview of the possible key dimensions to be taken into account. The size of government (i.e. the relative level
5 The focus on the role of QPF is to increase the long-term output growth. The quantitative effects of the different
fiscal instruments on output growth can be simulated by dynamic macroeconomic long-term equilibrium models (e.g. Roeger and in’t Veld, 2010). For instance, the effects of consolidation strategies in reducing debt level and interest payments give a leeway to governments (either to reduce distortive taxes or to increase expenditure). If this leeway is used in a growth-friendly way, the long-term effects on growth are generally positive, despite the negative short-term effects.
6 The literature also tend to treat the effects of government action as linear (contractionary and expansionary
policies are assumed to have the same symmetric effect and small and large shocks also have the same linear effects). However, the fiscal multipliers can show non-linear effects, as a function of prevailing business cycle conditions and on initial macroeconomic conditions (e.g. Banchard and Perotti, 2002).
7 The literature shows linkages between expenditure in health and education on the labour market. However,
countries provide these services differently: publicly, privately, or jointly (via public-private partnerships, PPPs).
8 The authors find a negative effect of government expenditure and of government consumption spending on
private investment by assessing the relevance of fiscal components for private and public investment using panel data for 95 countries during 1970–2008.
9 Pritchett (1996) suggests the ‘white elephant’ hypothesis: public investment in developing countries is often
of expenditures and revenues) is a political choice. In fact, the progressivity of the tax system
and the choices for welfare in a society show the preferences in the trade-off between growth and equity. This is a widely studied dimension (e.g. Bergh and Henrekson, 2011), which depends on the performance and efficiency of governments. Reducing the government size is generally seen as an important measure to improve the QPF, although this might be more feasible in countries with comparatively larger government sectors relative to GDP. Afonso and Schuknecht (2019) find that government expenditure in a range of 30-35% of GDP is still an optimal size for advanced countries.
Also the efficiency of revenue and expenditures systems is very relevant for the QPF. In this respect, the literature typically recommends fiscal reforms aimed at improving tax collection (tax administration, broadening tax bases, reduce tax expenditures), improving the targeting of social transfers (e.g. means testing), spending reviews across the board to promote efficiency gains, and assessing policies against performance indicators (e.g. cost-benefit for investment where PPPs could be seen as alternative). Finally, fiscal governance refers to the set of national rules, institutions and procedures in place to enable implementing the QPF.
There is a key restriction for governments: debt must be sustainable. This implies that the accumulated short-, medium- and long-term debt must be serviced at any point in time (Bouabdallah et al., 2017). This requires governments to be liquid and solvent. Solvency refers to the government's intertemporal budget constraint, which requires that the present value of current and future taxes must be sufficient to cover the present value of current and future government expenditure plus the initial stock of government debt. Although the central variable for debt sustainability analysis is the stock of (gross) government debt,10 the aggregate public sector balance sheets analysis provides a complementary and comprehensive view of public finances (IMF, 2018b). On the asset side, countries have financial assets, infrastructure and natural resources. Public assets are at the service of economic and social goals as well as accountable to citizens and creditors. Also, the concept of government action has to be expanded to include also entitlements that will be accrued in the future, such as implicit liabilities (e.g. pensions) and contingent liabilities (e.g. guarantees to the financial sector), as compared with future social contributions and tax payments (implicit assets).11
Other dimensions constraining government actions are, for example, the relative macroeconomic situation of the country (e.g. unemployment rates), the impact of the QPF on other markets (e.g. crowding-in or crowding-out resources in the economy), the demographic situation (e.g. pensioners, fertility ratios, migration trends), or the political capital (e.g. reform fatigue).
3. The composition of public finances in the euro area – stylized facts
Most countries in the euro area have chosen a broadly neutral fiscal stance since 2014, after a revenue-consolidation period over 2011-2013 (see ECB, 2017 for country details). Government debt-to-GDP ratios are on a declining path, but debt is projected to reach 84.3% of GDP by 2020 in the euro area, which is almost 20 percentage points (pps.) of GDP above the pre-crisis
10 Changes in government debt-to-GDP ratios are not only explained by primary government deficit/surplus for a
given period, but also by the stock-flow adjustments (SFA) and the snow-ball effect. A positive SFA means that government debt increases more than the annual deficit (or decreases less than implied by the surplus). The SFA captures the impact of net acquisition of financial assets, debt adjustment effects and/or statistical discrepancies. The concept of snow-ball relates to the impact of interest expenditure, GDP growth and inflation on the debt-to-GDP ratio.
11 See Hartwig Lojsch et al. (2011) for a conceptual framework of the government balance sheet and calculations
levels.12 Going forward, the expected decline in the total revenue-to-potential GDP ratio (from
46.3% in 2018 to 45.8% of GDP in 2020) is mainly explained by discretionary policies. However, the decline in the total primary expenditure-to-potential GDP ratio is expected to be marginal in the euro area (from 47.1% in 2018 to 47.0% of GDP in 2020).13
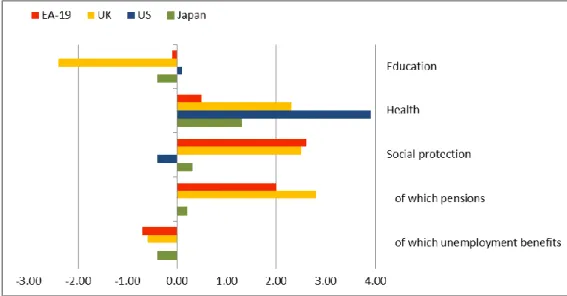
The functions of government expenditure can be better analysed by using data on the “Classification of the Functions of Government” (COFOG) (see ECB, 2009 and 2017). Although not completely free of data comparability issues across countries, these data show some trends. Social protection is by far the largest component of total expenditure in most developed countries (except in the US),14 with pension payments having the largest share. Expenditure in social protection has been increasing compared to the pre-consolidation shares,15 as a consequence of the growth in pensions (see Figure 1). In the euro area, social protection grew by 2.6pps. of primary expenditure, mainly attributed to more spending in pensions (2pps.) while unemployment benefits decreased (-0.7pps.). Still, there have been pension reforms in several euro area countries that have helped containing the expenditure development (e.g. Carone et al. 2016). Government expenditure on health services increased remarkably in the sample countries during the last decade,16 particularly in the US. The shares in the expenditure on education generally dropped during the reference period, except in the US. This fall is particularly pronounced in the UK.
Figure 1. Changes in the functional composition of government expenditure (2011-2017).
(cumulative changes as percentage of total primary expenditure, percentage points)
Source: Eurostat and OECD. Data are available until 2017. Notes: Breakdowns for pensions (old age pensions and survivors’ pensions) and unemployment benefits are not available for the US.
12 In 2018, the debt ratio in the euro area stood at 87.1% of GDP, which compares with the UK (86.8% of GDP),
the US (107.4% of GDP) and Japan (236.1% of GDP). In absolute terms, the level of government debt in the euro area amounted to around EUR 10,090bn in 2018, which compares with a stock of around EUR 6,113bn in 2007 (or 65% of GDP) (source: AMECO database, May 2019).
13 See European Commission (2019) for country details.
14 Social protection represents around 40% of total government expenditure in the euro area, the UK, and Japan,
while it is limited to around 20% in the US (2017 data). Health is the second biggest spending item, representing around 24% of total expenditure in the US, which compares with 15% in the euro area, 18% in the UK, and more than 19% in Japan. Spending in education is also important among developed countries: the ratio-to-GDP is 16% in the US, which compares with 11% in the UK, almost 10% in the euro area and almost 9% in Japan.
15 The most updated available data point 2017 is compared to 2010, which is the last year of expansionary policies
in the euro area, as most consolidation efforts started in 2011 in the euro area countries.
Figure 2. Rebalancing the composition of public finances (2019-2020).
Source. European Commission (AMECO database, May 2019).
Looking ahead, Figure 2 provides an overview of the expected changes in the composition of public finances over the period 2019-2020. On the expenditure side,17 there is a general increase in the shares of investment (except in the US and the UK) and social benefits (except in the UK) in the total primary expenditure. These fiscal variables are rebalanced by lower projected compensation of employees and subsidies (except in the US for the latter).
On the revenue side, tax receipts are the most important source of government revenue in the euro area. Still, governments are generally rebalancing towards higher direct and indirect taxation while the share of social contributions is set to decline, except in the US. This trend is mostly due to the implementation of discretionary measures in several euro area countries.18 The US is rebalancing its composition towards a higher weight of direct taxation and social contributions, while the UK and Japan’s expected pattern is towards a higher share of direct and indirect taxation, respectively. In any case, it seems to be still room for a higher recourse to capital taxes in advanced countries, such as property taxation.
17 As COFOG projections are not available, only national accounts data are shown. This implies that cross-country
differences in the provision of public good and services impact the main fiscal variables accordingly.
18 There is heterogeneity across countries. For instance, while tax increases are assumed in the forecasts for Spain,
4. Conclusion
This paper has reviewed the multidimensional concept of the QPF, with a particular focus on the composition of public finances. The emphasis of QPF is on trying to maximize the beneficial long-term effects on output growth while protecting the most vulnerable parts of the population with distributive policies, subject to guaranteeing government debt sustainability.
The key message is that there is no a unique optimal composition of public finances. Public finance theory divides the government functions into the efficient ‘allocation’ of resources in the economy, the ‘stabilisation’ of income in the economic cycle and the ‘distribution’ in mitigating income inequality (Musgrave, 1959). The political choices take into account a wide range of country specific circumstances, including the demographic trends and the preferences of the median voter. In practice, countries have specific preferences regarding tax and social security systems. Hence, the QPF strongly depends on the country idiosyncrasies.
Indeed, changes in the composition of public finances over the recent years denote different preferences across countries. In the euro area, the shares in social protection expenditure increased, mainly due to growing pension expenditure. By contrast, the US has made a more substantial shift towards health and education expenditure.
Going forward, however, social benefits are expected to grow in the US as well. The euro area and Japan foresee increases in investment expenditure. This shift can boost growth and equality levels, but assessing the efficiency of investment projects is key for improving the QPF. On the revenue side, the developments are mixed across economic areas. In particular, there is a rebalancing towards more taxation, especially on direct taxation, which has drawbacks in terms of growth friendliness. However, the expected higher reliance on indirect taxation, in some countries, and the lower social contributions suggest a broadly growth friendly composition of taxes.
Acknowledgements
The opinions expressed herein are those of the author, and do not necessarily reflect the views of the ECB or the Eurosystem. I would like to thank Phillip Rother, the Editor, and an anonymous referee for their useful comments and suggestions for improving the paper. Remaining errors are my responsibility.
References
Afonso, A., and Jalles, J. (2015) How Does Fiscal Policy Affect Investment? Evidence from a Large Panel, International Journal of Finance and Economics, 20(4), 310-327.
Afonso, A., and. Jalles, J. (2013) Fiscal Composition and Long-term Growth, ECB Working Paper, 1518.
Afonso, A., and Schuknecht, L. (2019) How ‘big’ should government be?, Economics and Busi-ness Letters, 8(2), 85-96.
Angelopoulos, K., Economides G., and Kammas, P. (2007) Tax-spending policies and eco-nomic growth: Theoretical predictions and evidence from the OECD, European Journal of Political Economy, 23, 885-902
Bergh, A., and Henrekson, M. (2011) Government size and growth: a survey and interpretation of the evidence, Journal of Economic Surveys, 25(5), 872-897.
Blanchard, O., and Perotti, R. (2002) An Empirical Characterization of the Dynamic Effects of
Changes in Government Spending and Taxes on Output, The Quarterly Journal of Econom-ics, 117 (4), 1329–1368.
Bouabdallah, O., Checherita-Westphal, C., Warmedinger, T., de Stefani, R., Drudi, F., Setzer, R., and Westphal, A. (2017) Debt sustainability analysis for euro area sovereigns: a me-thodological framework, ECB Occasional Paper Series, 185, April.
Carone, G. (2016) Pension Reforms in the EU since the Early 2000’s: Achievements and Chal-lenges Ahead, European Economy Discussion Papers, 042, December.
Clemens, B., de Mooij, R., and Keen, M. (2015) Inequality and Fiscal Policy, IMF, Washing-ton.
Cournède, B., Goujard, A., and Pina, Á. (2013) How to Achieve Growth- and Equity-friendly Fiscal Consolidation?: A Proposed Methodology for Instrument Choice with an Illustrative Application to OECD Countries, OECD Economics Department Working Paper, 1088. De Melo, L., and Jalles, J. (2019) Cross-Country Evidence on the Determinants of Inclusive
Growth Episode, Review of Development Economics, forthcoming.
Deroose, S., and Kastrop, C. (2008) The Quality of Public Finances, European Economy Occasional Papers, 37, March.
ECB (2017) The composition of public finances in the euro area, Economic Bulletin, 5, 44-62. ECB (2009) The Functional Composition of Government Spending in the European Union,
Monthly Bulletin, April, 91-99.
European Commission (2019) European Economic Forecast – Sprig 2019, Institutional Paper, 102, May.
European Commission (2018) The 2018 Ageing Report – Economic & Budgetary Projections for the 28 EU Member States (2016-2070), Institutional Paper, 079, May.
European Commission (2017) Report on Public Finances in EMU 2017, Institutional Paper 069, January 2018.
European Commission (2008) The quality of public finances and economic growth, Economic Papers, 337, September.
Hartwig Lojsch, D., Rodríguez-Vives, M., and Slavik, M. (2011) The Size and Composition of Government Debt in the Euro Area, ECB Occasional Paper, 132, October.
IMF (2018a) Capitalizing on Good Times, IMF Fiscal Monitor, April. IMF (2018b) Managing Public Debt, IMF Fiscal Monitor, October. IMF (2013) Taxing Times, IMF Fiscal Monitor, October.
Joumard, I., Pisu, M., and Bloch, D. (2012) Less Income Inequality and More Growth – Are They Compatible? Part 3. Income Redistribution via Taxes and Transfers in OECD Coun-tries, OECD Economics Department Working Paper, 926.
Musgrave, R.A. (1959) The Theory of Public Finance: A Study in Public Economy, McGraw Hill, New York.
OECD (2018) Public Finance Structure and Inclusive Growth, OECD Economic Policy Paper, 25.
Prichett, L. (1996) Mind Your p’s and q’s: the cost of public investment is not the value of public capital, World Bank Working Paper, 1660.
Roeger, W., and in’t Veld, J. (2010) Fiscal stimulus and exit strategies in the EU: a model based analysis, European Economy Economic Papers, 426.
Rodríguez-Vives, M., and Vedia, D. (2019) How can fiscal policies mitigate inequality?, Mimeo.