A framework for incorporating DTI Atlas Builder registration into Tract-Based Spatial Statistics and a simulated comparison to standard TBSS
Matthew Leming Abstract - Tract-based spatial statistics
(TBSS) is a software pipeline widely used in comparative analysis of the white matter integrity of groups of diffusion tensor imaging (DTI) datasets. However, several components of TBSS have been criticized over the years. Many of these criticisms stem, in part, from its white matter skeletonization and projection and the lack of directional data in its calculations. In addition, currently there exist no accepted, unbiased methods for comparing TBSS to its counterparts, and there is clearly a need for a more intuitive user-friendly software interface for running TBSS. In this study, I have altered existing diffusion atlas building software and integrated it into TBSS named DAB-TBSS (DTI Atlas Builder Tract-Based Spatial Statistics) by using advanced registration offered by DTI Atlas Builder and incorporating blurring into the skeletal projection step. Here, I also propose a framework for simulating population differences for diffusion tensor imaging data, providing a more substantive means of empirically comparing DTI group analysis programs such as TBSS
Overview of TBSS
Tract-based spatial statistics is an open-source tool in the FMRIB Software Library (Jenkinson et al, 2012), developed at the FMRIB at Oxford. The purpose of this tool is to identify statistically significant differences in white matter neural tracts across groups of medical images of the brain. Given a population of test images and control images, TBSS can find the white matter tracts that show areas of statistically significant differences between the white matter integrity of these groups,
quantified by a one-dimensional measurement of DTI (usually fractional anisotropy, FA).
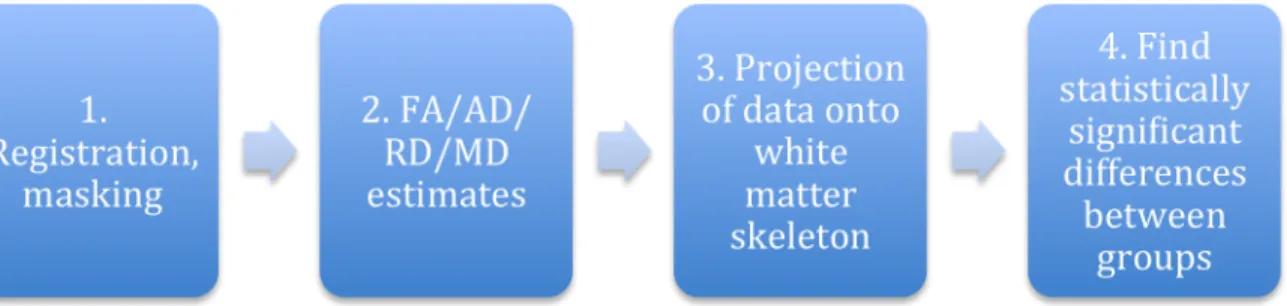
TBSS works in a multi-step process. From a given DTI or DWI (Diffusion-Weighted Imaging) dataset, TBSS processes FA maps derived from the DTI datasets in a four-step process. First, they are preprocessed; this means that the data is scaled and presented to the user in such a way as to make quality control easier. Second, each subject is registered via deformable registration into the MNI152 (Montreal Neurological Institute 152) standard space [11] (in preceding this step, the user may optionally affine align every image to the most representative subject in the group, then register the resulting images to MNI152). Third, from these deformably registered FA maps, TBSS creates a mean FA image and estimates a white matter skeleton that runs through the centers of all major white matter tract regions (this same skeleton, found from FA, would also be used were the user tests non-FA measurements). Fourth, TBSS projects the maximal FA values of all subjects onto the skeleton and displays areas on the skeleton in which there is a statistically significant difference between each group of subjects. This process is also detailed on the FMRIB website [10].
Overview of previous research and suggestions for improving TBSS
While TBSS is easy to use, its flaws have been discussed and expounded upon extensively in past studies. The risks of TBSS proposed by its original authors (Smith et al, 2006) were issues with respect to the extent of spatial smoothing, the
Later studies expanded on these and suggested different practices for using TBSS. In general, it is the consensus that registration is improved through the use of directional data. (Bach et al, 2014) suggest using DTI-TK (available at www.nitrc.org/projects/dtitk) as an alternate registration method, and has the potential to improve registration results since it is tensor-based; similarly, (Schwarz et al, 2014) analyzed the use of the ANTS-SyN algorithm, which also uses directional data in the application of the deformable registration.
The skeleton projection step has been a widely criticized component of TBSS, but there is less consensus about the ways in which it should be addressed. This step is used to account for any potential misalignments between subjects and the skeleton, and it does so by projecting the maximal FA value within a certain range orthogonal to the skeleton onto the skeleton. (Van Hecke et al., 2010) pointed out that the area with the highest FA values has never been verified to be an area of particular interest within white matter tracts. (Zalesky et al, 2011) introduced a metric for assessing this skeleton projection step, going on to conclude that its alignment of maximum FA values comes at the expense of aligning voxels that are anatomically concordant; maximum FA values do not necessarily represent the center of a tract. (Schwarz et. al, 2014) suggested to do away with the skeleton projection step entirely, in favor of stronger registration techniques that do not require as much
built that are capable of doing this. The problems with the current skeletonization method have been well-documented, and while some best practices are agreed upon (such as threshold selection), there are no feasible alternatives to address many of these criticisms.
It is worth mentioning that one component that has not received as much attention in the study of the TBSS pipeline has been the use of measurements of DTI other than FA. While there have been some investigations into this in the context of other studies (Nave et al, 2011), Axial Diffusivity (AD), Mean Diffusivity (MD), and Radial Diffusivity (RD) have rarely been the focus of studies of TBSS, even though cross-group differences in these values may indicate areas that are affected uniquely by disease or drug use, which FA may fail to detect.
FA, however, is essential in the use of TBSS because it is not sensitive to the diffusivity of cerebrospinal fluid, whose diffusion tensors would have a larger magnitude of diffusion but are undirected. Thus, when TBSS selects the largest value perpendicular to project to the skeleton, there is little risk that its selected value is far outside the center of a white matter tract. The vectors mapping the maximum FA value perpendicular to the tract to the skeleton is provided in a separate output file; currently, TBSS is designed to use these vectors when projecting any measurement of DTI onto the skeleton. The use of virtually any measurement other than
FA thus risks picking up values outside of a white matter tract.
Proposed alterations of TBSS
As said previously, TBSS essentially throws out directional tensor information in its initial steps and focuses on fractional anisotropy. Even so, this decision is, in many ways, practical; after all, FA is a the major measurement employed in studies of white matter integrity or pathology. How, then, could directional data be enhancing such studies within the framework of TBSS?
As stated above, registration is the most straightforward way for this to happen. Several methods to register DTI images have been proposed that are superior to the FA-based registration that TBSS uses.
Additionally, one could imagine the use of a decomposition algorithm in estimating the white matter skeleton, and, beyond that, incorporating directional data when finding projection vectors to the white matter skeleton. However, such sophisticated skeleton extraction and projection algorithms are beyond this study.
If incorporating directional data into the later steps of TBSS is not straightforwardly feasible, then a worthwhile investigation may be to research the use of DTI measurements other than FA into the skeletal analysis step. TBSS already provides this capability, but as stated previously, very few studies have used this
capability likely due to lack of ease-of-use. With TBSS, one may use projection paths derived from the locations of maximal FA values to project AD, RD, or MD values onto the skeleton.
While the importance of the maximal FA value in proximity of the white matter skeleton has been questioned (see above), thus far no other practical and superior heuristic for selecting an FA value to project on the skeleton has been proposed. The AD, MD, and RD values within the same voxel are not indicative of particularly important locations at all; the highest FA value does not necessarily correspond to the highest MD, RD, or AD value within the white matter tract. Selecting the maximal (or minimal) MD, RD, or AD could easily lead to an area outside of the white matter tract.
One interesting variation on the standard TBSS projection of non-FA measures would be to select a Gaussian area of the MD, RD, or AD image at the voxel of the maximum FA value. This gives more assurance of the projected value as it is computed over a a larger area. Furthermore, this method of Gaussian sampling of an area could be used for the FA value only, which would, if anything, remove noise from the projected values.
Thus, there are at least two concrete areas in which TBSS may be improved: its registration method, and the projection of Figure 1: A rough guideline of the steps for DAB-TBSS
SyN was selected in DTIAtlasBuilder as it has shown in numerous comparison studies to be the best performing registration algorithm for 3D medical imaging data. Secondly, DAB-TBSS computes the local Gaussian average of DTI measures at the location of of the maximal FA value that is then projected to the white matter skeleton, instead of the maximal FA value itself. Thus, a local average of AD, MD, or RD is obtained, rather than the value directly underlying the voxel of maximal FA
DAB-TBSS Pipeline Details
DAB-TBSS performs step-by-step similarly to TBSS; the instructions for TBSS can be found in the TBSS user guide (http://fsl.fmrib.ox.ac.uk/fsl/fslwiki/TBSS/Us erGuide). To make the organization of results easier, the overall setup for folders and naming conventions in DAB-TBSS have been kept the same. Though there might be some overlapping descriptions with the FSL TBSS user guide, this section will describe the entire proposed DAB-TBSS from beginning to end for clarity.
DAB-TBSS itself is primarily a set of Unix shell scripts (bash) that perform function calls to DTIAtlasBuilder and the FSL library.
Linking the output of DTI Atlas Builder with dab_tbss_1
dab_tbss_1 is the script that preprocesses DTI datasets, registers them to the same space as DTI Atlas Builder, then estimates and applies a mask to the results. This currently supports .nrrd, .nii.gz and .nii files.
called “stats”. This can be run directly after the completion of dab_tbss_1.sh.
When this is done running, there should be four new folders -- entitled FA, AD, MD, and RD -- which contain all of the image estimates (and their corresponding Gaussians, if applicable). Additionally, there should be a folder called “stats” which has the projected property maps “all_FA.nii.gz”, “all_RD.nii.gz”, “all_AD.nii.gz”, and “all_MD.nii.gz”, and their corresponding Gaussian files. These are 4D compilations of all measurement estimations of all subjects in a particular set, with the same mask (made from the mean FA) applied to each subject. Additionally, this script measures the mean values of these sets (though not the Gaussians) and puts the result into the stats folder.
White matter skeletonization with dab_tbss_3
This script estimates a white matter skeleton and projects the DTI measurement onto it. By default, the script will look for the Gaussian-blurred images from the previous step (assuming that they were generated) and project those onto the skeleton. If it finds no such images, it will project the standard values onto the skeleton. If Gaussian images were generated in the previous step, then projection of the standard values onto the skeleton can be forced with the argument “--nogaussian”,.
Group analysis with dab_tbss_4 This step separates the projected data into groups and finds the differences between
groups of subjects across the white matter skeleton. dab_tbss_4 requires a group file to run -- something indicating which of two groups each subject is in.
FSL requires that groups be distinguished with two particular files in the stats folder. If those files are present, the script will run automatically. However, when these are not present, the user is presented with a .csv file that is output in the main folder. The user is given instructions to edit the subjects listed in that folder and to
categorize them into their proper groups. When dab_tbss_4.sh is run again, this .csv file is turned into the proper format.
Following this, the script uses this output to run FSL’s randomize function, which finds differences in each group of subjects across the values projected onto the skeleton.
Performance Evaluation via Simulation of Group Effects
A problem with TBSS, or any such group comparison software, is quantifying whether any potential alteration to the pipeline is an improvement or not. In most cases (Schwarz et al, 2014; Bach et al, 2014), alterations are tested on datasets acquired by the research groups that conducted the study. However, since these datasets are usually typical to a particular kind of study, they are a poor way to test differences in the general case. If both TBSS and its proposed alterations find a false positive or false negative at a point along the dataset, it is necessary to point out a common weakness in both methods.
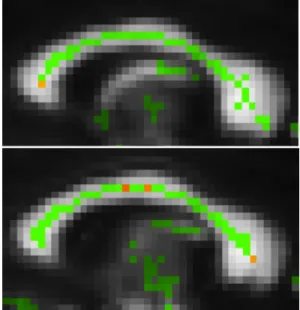
To address this, I created a novel Matlab-based simulation tool for group effects. This tool creates synthetic differences in a given set of diffusion tensor images. It works in three steps. First, a user selects the coordinates of anatomically corresponding places in each subject. Then, a sphere of an indicated radius is placed at the center of these coordinates. Finally, the principal eigenvalue of all tensors that fall within this sphere are multiplied by a Gaussian random value with a specified mean and standard deviation. Optionally, the user may also specify mean and standard deviation values to edit the magnitude of the second and third Figure 2: Sagittal view of results of DAB-TBSS
atlas upon a 10% variation in the principal eigenvalue between the two groups tested. The displayed voxel indicates a statistically significant difference in AD values of both groups along the ventral, middle, and dorsal corpus callosum (p < 0.05).
Figure 3: A sagittal view of the detected differences in AD values in TBSS upon a 0.05% variation in the principal eigenvalue. While this did successfully detect a difference in the middle corpus callosum (left, p-0.0423), it detected false positives outside of the corpus callosum (p= 0.0096 for the middle and p= 0.015 for simulation < control).
datasets of a group of 20 patients from a study on drug abusing mothers, acquired on a 3T Siemens scanner with 21-direction diffusion-weighted imaging. These were simulated to have differences in selected regions in their dorsal, middle, and ventral corpus callosum, with the following set of setting: (µ=1.005, σ=0.001); (µ=1.01, σ=0.005); (µ=1.02, σ=0.005); (µ=1.05, σ=0.005); (µ=1.10, σ=0.005); (µ=1.15, σ=0.005). Results from this simulation will allos us to look at varying magnitudes of the group difference for the principal eigenvalue. Thus, 20 patients were compared to 20 simulated sets, and so no other statistically significant differences outside those simulated would be predicted to occur across these groups. I ran all of these datasets through TBSS and DAB-TBSS for both FA and AD values.
Results
The results of this study as presented below indicates that the AD values within DAB-TBSS were the most powerful indicator of the changes indicated, as it was the only indicator to successfully find statistically significant differences in all three of the simulated areas (p < 0.05). This is not surprising given that AD value is same as the principal eigenvalue, which is the value that is modified in the simulation. While the standard TBSS AD analysis indicated those areas as being statistically significant at much lower percentages, it also showed many false positives at many areas further away from the localized regions of the dataset. The FA
measurements of the normal TBSS dataset only managed to detect statistically significant differences at the middle cortex upon a 15% change in its principal eigenvalue. The FA differences measured in DAB-TBSS did not detect any statistically significant differences.
Discussion
In this study, it was found that the proposed alterations of TBSS were more effective at detecting simulated differences in data without producing any false positives. We increased the magnitude of axial diffusivity in localized regions within the ventral, middle, and dorsal corpus callosum of 20 DTI datasets. It was found that testing for these differences directly on AD values in DAB-TBSS successfully detected these changes at a 5-10% magnitude of change, without producing a false positive throughout the dataset. While TBSS detected these differences, it also produced a number of false positives throughout the dataset. The FA measurement on TBSS found differences in the 10-15% range without such false positives, while FA measurements in DAB-TBSS did not find these differences. Thus, the method, in this study, that found the simulated differences most accurately, was DAB-TBSS with AD measurements. This suggests that non-FA
differences in FA upon a 15% increase in the principal eigenvalue, the first value that
successfully predicted differences in those areas. While p<0.05 in areas around the ventral and middle corpus callosum, the FA indicators failed to detect differences around the dorsal region.
measurements in TBSS are useful, but the previous registration method may have not been as accurate as the differences in ANTS. Further studies comparing DAB-TBSS to DAB-TBSS would increase the number of subjects, finding how many subjects are necessary to detect more subtle differences in the data, as well as the sensitivity it has to detecting RD and MD differences.
References
1. Bach, M., Laun, F.B., Leemans, A., Tax, C.M.W., Biessels, G.J., Stieltjes, B., Maier-Hein, K.H. “Methodological Considerations on tract-based spatial statistics (TBSS).” Neuroimage 100, 358–369. 2014.
2. Bassler, P.J., Mattiello, J., LeBihan, D. “MR diffusion tensor spectroscopy and imaging.” Biophysical journal 66(1), 259– 267. 1994.
3. Hecke, W.V., Leemans, A., Backer, S.D., Jeurissen, B., Parizel, P.M., Sijbers., J. “Comparing isotropic and anisotropic smoothing for voxel-based DTI analyses: A simulation study.” Human Brain Mapping 31(1), 98–114. 2010.
4. Jenkinson, M., Beckmann, C. F., Behrens, T. E. J., Woolrich, M. W.., Smith, S. M., “FSL.,” Neuroimage 62 (2), 782–90. 2012.
5.. Nave, R.D., Ginestroni, G., Diciotti, S., Salvatore, E., Soricelli, A., Mascalchi, M. “Axial diffusivity is increased in the degenerating superior cerebellar peduncles
of Friedreich's ataxia.” Neuroradiology 53, 367–372. 2011.
6. Schwarz., C.G., Reid., R.I., Gunter, J.L., Senjem, M.L., Przybelski, S.A., Zuk, S.A., Whitwell, J.L., Vemuri, P., Josephs, K.A., Kantarci, K., Thompson, P.M., Petersen, R.C., Jack, C.R. “Improved DTI registration allows voxel-based analysis that outperforms Tract-Based Spatial Statistics.” Neuroimage 94, 65–78. 2014.
7. Smith, S.M., Jenkinson, M., Johansen-Berg, H., Rueckert, D., Nichols, T.E., Mackay, C.E., Watkins, K.E., Ciccarelli, O., Cader, M.Z., Matthews, P.M., Behrens, T.E.J. “Tract-based spatial statistics: voxelwise analysis of multi-subject diffusion data.” Neuroimage, 31(4), 1487–1505. 2006.
8. Verde, A.R., Budin, F., Berger, J., Gupta, A., Farzinfar, M., Kaiser, A., Ahn, M., Johnson, H., Matsui, J., Hazlett, H.C., Sharma, A., Goodlett, C., Shi, Y., Gouttard, S., Vachet, C., Piven, J., Zhu, H., Gerig, G., Styner, M. “UNC-Utah NA-MIC framework for DTI fiber tract analysis.” Neuroinform. 51(7), 2014.
9. Zhu, H., Kong, L., Styner, M., Gerig, G., Lin, W., Gilmore, J.H. “FADTTS: Funcitonal Analysis of Diffusion Tensor Tract Statistics.” Neuroimage 56(3), 1412–1425. 2011.
10.
http://fsl.fmrib.ox.ac.uk/fsl/fsl4.0/tbss/index. 11. http://fsl.fmrib.ox.ac.uk/fsl/fslwiki/Atlases