Open Access
Research article
The effects of incomplete protein interaction data on structural and
evolutionary inferences
Eric de Silva
1, Thomas Thorne
1, Piers Ingram
1,2, Ino Agrafioti
1,
Jonathan Swire
1, Carsten Wiuf
3,4and Michael PH Stumpf*
1,5Address: 1Theoretical Genomics Group, Centre for Bioinformatics, Division of Molecular Biosciences, Imperial College London, London, UK, 2Department of Mathematics, Imperial College London, London, UK, 3Bioinformatics Research Center, University of Aarhus, Aarhus, Denmark, 4Molecular Diagnostic Laboratory, Aarhus University Hospital, Aarhus, Denmark and 5Institute of Mathematical Sciences, Imperial College
London, London, UK
Email: Eric de Silva - [email protected]; Thomas Thorne - [email protected]; Piers Ingram - [email protected]; Ino Agrafioti - [email protected]; Jonathan Swire - [email protected]; Carsten Wiuf - [email protected];
Michael PH Stumpf* - [email protected] * Corresponding author
Abstract
Background: Present protein interaction network data sets include only interactions among subsets of the proteins in an organism. Previously this has been ignored, but in principle any global network analysis that only looks at partial data may be biased. Here we demonstrate the need to consider network sampling properties explicitly and from the outset in any analysis.
Results: Here we study how properties of the yeast protein interaction network are affected by random and non-random sampling schemes using a range of different network statistics. Effects are shown to be independent of the inherent noise in protein interaction data. The effects of the incomplete nature of network data become very noticeable, especially for so-called network motifs. We also consider the effect of incomplete network data on functional and evolutionary inferences.
Conclusion: Crucially, when only small, partial network data sets are considered, bias is virtually inevitable. Given the scope of effects considered here, previous analyses may have to be carefully reassessed: ignoring the fact that present network data are incomplete will severely affect our ability to understand biological systems.
Background
Molecular networks such as protein interaction, transcrip-tional or metabolic networks are widely seen as integra-tive and coherent descriptions for the whole complement of molecular processes inside a cell [1]. There has been considerable interest in their structure, their functional organization and their evolutionary properties. For important model organisms such as Saccharomyces
cerevi-siae, Caenorhabditis elegans and Drosophila melanogaster there are now extensive protein interaction data deposited in public-domain databases and serious attempts are being made at elucidating the human protein interaction network (PIN) [2,3]. These network data sets – extensive though they are thanks to experimental advances and in silico prediction – do not cover the entire network. In par-ticular they do not include all the proteins in these
organ-Published: 03 November 2006
BMC Biology 2006, 4:39 doi:10.1186/1741-7007-4-39
Received: 01 June 2006 Accepted: 03 November 2006
This article is available from: http://www.biomedcentral.com/1741-7007/4/39
© 2006 de Silva et al; licensee BioMed Central Ltd.
isms and represent samples only from much larger networks.
But a network introduces a set of relationships and poten-tial dependencies between the constituent nodes and these may be broken up in the subnet. By subnet we mean a subset of the nodes of the overall global network and the interactions among them (i.e. the induced sub-graph of a set of nodes); depending on how the nodes in are chosen, properties of will be different from those of . Until very recently, all studies surprisingly ignored the effects of the incompleteness of molecular networks [4] despite the fact that the sampling properties of networks can lead to systematic differences between the properties of networks and their subnets (discrepancies can be further inflated when the nodes in are chosen in a highly ascertained manner [5]). While random subnets of classical random graphs have properties that can be taken as representative of the true network, most net-works, notably the popular scale-free classes of netnet-works, will display noticeable and qualitative differences between networks and their subnets. This early work was followed by an analysis of Han et al. [6], who reported results regarding the effects of sampling on the degree dis-tribution of PINs and further theoretical studies by Lee et al. [7]; Hakes et al. [8] considered not subsampling but the question of the effect of data-set selection on structural inferences of networks, which can also have considerable impact on the analysis and may explain differences between analyses. A host of other network statistics can be considered in addition to the degree distribution, Pr(k), in order to assess the structure [9]; these include the cluster-ing coefficient and network motifs (see Methods for defini-tions). Importantly, all of these will be different for subnets compared with the true network and it is essential to understand the extent to which subnet properties other than the degree distribution differ from those of the true network. As we will show, this is to a large extent a ques-tion of how the subnet is created (that is, how nodes are chosen), and the statistic under consideration. A useful general premise we have found is that subnetworks differ more from the true network in non-local properties: i.e. their degree distributions will be more "similar" (in a loose sense which has been made somewhat more precise [5,10]) than, for example, motif spectra [11,12].
It is thus important to understand the extent to which the sampling properties of networks affect our inferences regarding structure, function and evolution. Considerable effort has been invested in understanding, for example,
the functional organization and evolutionary properties of PINs, and contradictory results have been reported in the literature which are probably affected by many factors in addition to incomplete data. We have recently studied statistical sampling properties of network ensembles [4,5] in considerable detail: the results suggest that when t80% of the nodes in a network are sampled at random, the shape of the degree distribution of the subnet, Pr*(k), will be virtually indistinguishable from that of the true net-work. Current PIN data comprise interactions only among a relatively small number of the proteins known to be present in the different organisms. For S. cerevisiae, for which sampling is most complete, present publicly avail-able data sets include interaction data among ≈4900 out of an estimated 6000 proteins. We have therefore taken the present S. cerevisiae PIN as a starting point for our analysis. We compare results for subnets with those of the assumed 'true' network. This study is meant as a qualita-tive investigation into how incomplete sampling has affected studies into PINs and not as a quantitative assess-ment of the reliability of the present dataset. Despite the noise in the present yeast PIN, the S. cerevisiae data will give us a more realistic representation of a true PIN than theoretical network models.
We will show that the sampling nature of a real network does indeed lead to different properties in the subnets compared with the true network. Sampling properties of networks have hitherto been largely ignored – whereas the poor data quality has attracted considerable attention [13,14] – but may lead to large variances and biases for network statistics obtained for different subnets, and act independently of noise. In light of the present analysis it may be necessary to reevaluate previous results for biolog-ical networks. In the context of systems biology this study demonstrates both the importance of performing care-fully delimited studies of well-defined aspects of systems, and the potential pitfalls of analyzing only parts or com-ponents of complex biological systems. Clearly the way the data have been collected needs to be considered before an analysis, and the sampling properties of net-works need to be included in the analysis explicitly and from the outset.
Results
Network sampling schemes
Assuming random sampling of nodes leads to great sim-plifications in the mathematical analysis [4]. In reality, however, experimenters are more likely to pick some pro-teins than others and quite generally we can assume that each protein has probability 0 <pi < 1. Then the number of nodes in the subnet is given by
Equally, we can determine the average probability of sam-pling a node
As N becomes large (strictly as N → ∞) it is possible to show that we can use rather than the individual pi to determine the sampling probabilities of random net-works.
Sampling properties of networks
Uncorrelated random networks are networks which are maximally random conditional on a given degree distri-bution [15,16] (thus their degree-degree correlations may be different from zero); in such a case it is possible to express expectation values of many interesting network characteristics in terms of the degree distribution Pr(k); more interestingly, the degree sequence is a sufficient (see e.g. Cox and Hinkley [17]) statistic for uncorrelated net-works. We can straightforwardly calculate the first two moments of the degree distribution in the subnet [5], Pr*(k):
where <...> denotes the sample mean and p the sampling probability. These equations are true whether a network is uncorrelated or not.
As the sampling fraction increases from zero to one the sampeld network will undergo a structural phase transi-tion [18,19] in the limit N →∞. One of the main conse-quences is the emergence of the giant connected component [18]. This is present (for N → ∞) when the average number of next-nearest neighbours, z2 of a
ran-dom node is on average greater than the number of its nearest neighbours z1; i.e.
z2 > z1 (5)
The number of nearest and next-nearest neighbours in a network are given by
z1 ≡ <k> (6)
and
Z2 ≡ <k2> - <k>, (7)
respectively. Substituting Eqns. (3) and (4) yields for con-dition (5) in the subnet
Thus the sampling fraction p for which the subnet does not have a GCC depends in an intuitive and simple man-ner on the properties of the overall network . For the yeast PIN considered here the GCC will cease to exist for p
d 0.041. For classical or Erdös-Rényi random graphs, where the degree distribution is given by a Poisson distri-bution with parameter λ(for large N) equation (8) means
that the sampling fraction must exceed p > for a GCC
to exist.
Subnet structures
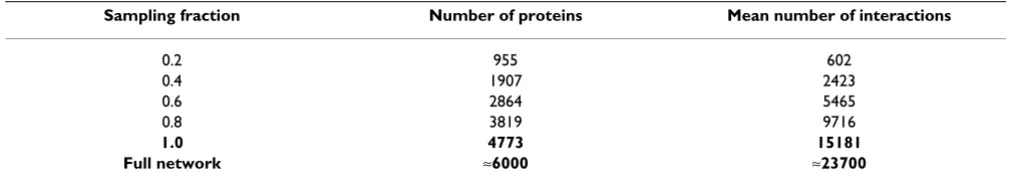
A random subnet comprising e.g. p = 60% of the nodes of the true network differs quite substantially from the true network (here p is the probability of sampling a node; the fraction of nodes included in the subnet is binomially dis-tributed with probability p). The graph induced by the subset of nodes has a substantially smaller number of edges than the sampling fraction, p (see Table 1). For example, for p = 60% slightly more than a third of the interactions will be observed. Trying to predict the size of interactomes by linear extrapolation from present data sets will thus underestimate the true interactome size [20]. For random sampling, however, it is in fact straightfor-ward to predict the number of interactions: if a fraction p of nodes has been sampled, then the fraction of edges that has been sampled is simply the fraction of pairs of nodes, i.e. a random subnet with sampling probability p will have a proportion of p2 of the edges. For S. cerevisiae we have
thus 15,181 out of approximately 15,181/0.802 ≈ 23,800
interactions (which are detectable given current experi-mental technology).
Degree distribution
In Figure 1A, as the sampling fraction decreases statistical weight tends to flow from high degrees to low degrees (we have removed nodes with k = 0 from the degree distribu-tion). Moreover, at low degrees the degree distribution appears to become more power law-like as the sampling fraction decreases; this is a curious point given claims about scale-free properties of so many biological networks that are effectively subnets of the real network. Previous analyses [4,5] show, however, that even the degree distri-butions of subnets are generally qualitatively different from those of the true network; in particular if the degree distribution of the network takes on a power law form, the
N pi
i N
=
( )
=
∑
1
1
p
Ni pi N
=
( )
=
∑
1
2 1
.
p
〈 〉 = 〈 〉k p k
( )
3〈 〉 =k2 p2〈 〉 +k2 p(1− 〈 〉p k) ,
( )
4
p k
k k
z z
> 〈 〉
〈 〉 − 〈 〉 =
( )
2
1 2
8 ,
, .
subnet (as the value of p decreases) will have a qualita-tively different degree distribution and vice versa.
On average a node with degree k in the global network will have degree pk [4,5] in a randomly sampled subnet (with sampling fraction p) and the peaks that are visible in the tail of the subnet degree distributions correspond to the most highly connected nodes in the full network: the maximum degree is 283 and corresponding peaks appear at ≈226, ≈170, ≈113 and at ≈57, for sampling fractions of 80%, 60%, 40% and 20%, respectively, that were gener-ated by random selection of nodes with probability p. Because of the binomial sampling procedure used in gen-erating networks, (where the degree distribution in the subnet is given by Eqn. (10) (see Methods), the
most highly connected nodes will remain the same – as will their rank order and the relative proportion – in the subnets as in the global network, provided, of course, that they are included in the subnet; see Figure 2.
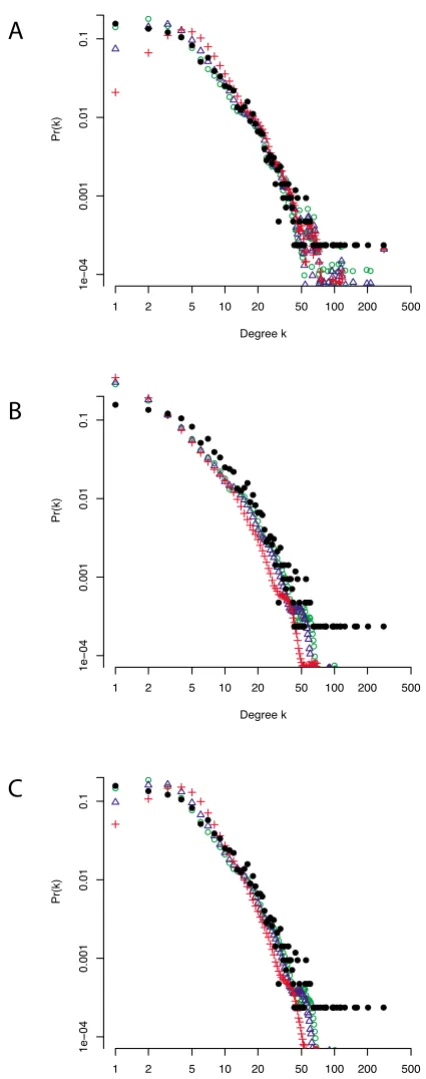
The effects of noise on the network data are shown in Fig-ure 2 where we have added, subtracted and rewired, respectively, a fraction of the interactions among nodes. Qualitatively, we find that the shoulder of the degree dis-tribution (i.e. the shape of the distribution at intermediate values of the degree k) is only little affected. Particularly at low, but also at high degree, the shape of the distribution may also differ quite considerably. Thus noise should gen-erally distort the degree distribution in a different way from the way incomplete network data do.
Clustering coefficients
Figure 1B shows the spread of the average clustering coef-ficient in the four subnet ensembles. The horizontal line shows the empirical clustering coefficient of the full net-work. In the supplementary material [see Additional file 1] we show that for large uncorrelated uniform networks [21] the clustering coefficient does not change at all under random sampling. The systematic decrease in the average
clustering coefficients with decreasing subnet size reflects the presence of degree-degree correlations (previously shown by Agrafioti et al. [22]) in the network data. We also also observe an increase in spread and range with decreasing subnet size. The empirical clustering coeffi-cient (indicated by the horizontal line) is higher than the median, but falls within the distribution of clustering coefficient (C) values obtained for all subnet ensembles, suggesting that correlations in the network are not very strong. This is in contrast to Figure 1A, where the degree distribution is more globally affected. This and the behav-iour of C under sampling in the giant connected compo-nent are discussed further in the supplementary material.
Betweenness
The dependence of betweenness or betweenness-central-ity (BC; see Methods) on the sampling fraction is more subtle than that of the degree or clustering coefficient as it also depends on the global structure of the network. Thus, for example, in different subnet samples the 10 proteins with the highest BC values change much more than the 10 proteins with the highest degrees. However, a very good correlation (Kendall's τ t 0.79 in the true network) between degree and BC is seen for all values of p (data not shown).
Motifs
In this study we pay particular attention to the six motifs defined by four nodes in an undirected graph (illustrated at the bottom of Figure 1C). The observed range of the Z -scores (see Methods) for all motifs considered here decreases with subnet size. For each subnet size we observe considerable spread in the range of Z-scores for the different motifs shown in Figure 1C. Motifs 1,3 and 4 can have both negative and positive Z-scores depending on the sample (motif 4 has positive and negative statisti-cally significant Z-scores even for 80% subnets in the 20 subnets studied here). For motif 6, the most highly con-nected, we observe the biggest spread as well as a general increase in the average Z-score with subnet size. In Figure 1D we observe that the median Z-score for motif 6 is the Pr ( ) k
Table 1: Sampling fraction and sub-network size. In the present context, the true network has been taken to be the available PIN dataset (which contains itself interactions among 4773 out of an estimated 6000 S. cerevisiae proteins). The relationship between
sampling fraction p and number of edges in the subnet is quadratic . The last line shows the extrapolation from the
present network to the true network size assuming random sampling.
Sampling fraction Number of proteins Mean number of interactions
0.2 955 602
0.4 1907 2423
0.6 2864 5465
0.8 3819 9716
1.0 4773 15181
Full network ≈6000 ≈23700
Properties of the yeast protein interaction networks under random sampling
Figure 1
Properties of the yeast protein interaction networks under random sampling. (A) The degree distribution for the full network and the average for the subnets (averaged over the ensemble) generated by sampling 80%, 60%, 40% and 20% of the nodes in the Saccharomyces cerevisiae protein interaction network. Nodes with degree k = 0 have been dropped from the analysis, reflecting the content of interaction databases. (B) The horizontal line shows the clustering coefficient of the full net-work. From the boxplots it is apparent that with decreasing subnet size the clustering coefficient will tend to decrease, reflect-ing the increasreflect-ingly sparse network with a correlated structure. (C) Z-scores for the six 4-motifs in the true network and 20 random subnets for sampling fractions p = 80%, 60%, 40% and 20%. (D) Median Z-scores for each motif in each of the subnet ensembles and the Z-score of the motif in the full network. In (C) and (D) a positive Z-score indicates that the motif is over-represented in the true network compared with randomly rewired versions of the true network; a negative Z-score indicates under-representation.
Median Z Score
20% subnet 40% subnet 60% subnet 80% subnet full network
Z Score
Z Score
Z Score
Z Score
0
100
150
200
50
1 2 3 4 5 6
200
300
400
100
500
600
0
200
300
400
100
500
600
0
200
300
400
100
500
600
0
200
300
400
100
500
600
0
Motifs
Pr(k)
Degree k 1e-5
1e-4 5e-4 0.002
0.01 0.05 0.2
1 2 5 10 20 50 10 0
20% 40% 60% 80%
0.04 0.06 0.08 0.10
A
B
C
Clustering Coef
ficient
Legend
Sampling Fraction
1 2 3 4 5 6
D
Degree distribution of noisy yeast protein interaction networks
Figure 2
Degree distribution of noisy yeast protein interaction networks. Degree distributions for "noisy" networks with 10% (green), 20% (blue) and 40% (red) false-positives (A), false negatives (B) and rewired edges (C). In each case the degree distri-bution of the true network is shown in black. Shown are averages obtained from 1000 independent instances. The 95% CIs of the degree distributions overlap the symbols used to indicate the mean, i.e. the variance of Pr(k) at degree k is relatively small.
Degree k
Pr(k)
1 2 5 10 20 50 100 200 500
1e−04
0.001
0.01
0.1
Degree k
Pr(k)
1 2 5 10 20 50 100 200 500
1e−04
0.001
0.01
0.1
Degree k
Pr(k)
1 2 5 10 20 50 100 200 500
1e−04
0.001
0.01
0.1
A
B
same in both the 20% and 40% subnets, and the 60% and 80% subnets, respectively. This is, however, entirely due to chance and to the high variance of motif Z-scores in random subnets as is shown by further analyses (see sup-plementary material [See Additional file 1]). The impor-tance of network data integrity and completeness is further exemplified by comparing the results in figure 1C with those in the original papers by Milo et al. [11,12]; here effects of the choice of data set also come into play [8].
Non-random ascertainment schemes
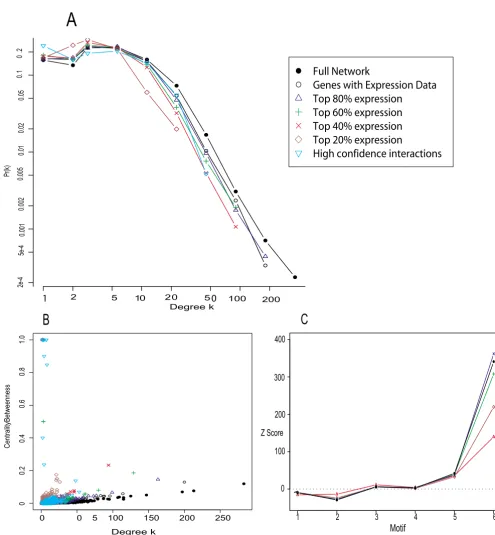
The degree distributions differ quite considerably between the different sampling schemes (see Figure 3A). It is par-ticularly interesting to note that the high-confidence data network has the degree distribution which is most similar to the degree distribution of the complete data-set. BC is shown in part B of the same figure which confirms the results outlined above: there is a systematic increase with decreasing sampling fraction p or subnet size. There are some nodes which appear to be on the shortest paths between all (or almost all) pairs of nodes. These do not, however, correspond to the most highly connected nodes, but rather occur for low degrees (k = 2).
For the subnets constructed on the basis of protein expres-sion data, we determined the 4-motif Z-scores. In Figure 3C it can be seen that all the motifs have similar Z-scores in the different data sets except for the fully connected 4-motif. The Z-scores of this motif do not exhibit a simple ordering, e.g. the subnet comprising the 80% of nodes with the highest expression levels exhibits higher Z-scores than the subnet consisting of all nodes where expression level data is available. Finally, this network has a Z-score for motif 6 that is twice as high as that obtained for the full network. We also detect some systematic differences for motifs 1, 3 and 4. These had Z-scores ≈ 0 in the true net-work and all randomly generated subnets (Figure 3C), but have negative Z-scores in the networks which are based on expression level. This suggests that experimental bias in designing interactome mapping studies will lead to sys-tematic differences in motif spectra for different sampling schemes.
Incomplete data and functional and evolutionary inferences
So far, we have considered only structural properties of networks. The interest in molecular networks lies, how-ever, in the hope that they can explain the mechanisms underlying complex biological processes. Their impact on the evolutionary properties of molecules has also been studied and here we seek to understand how informative inferences from subnets are about the properties of larger networks.
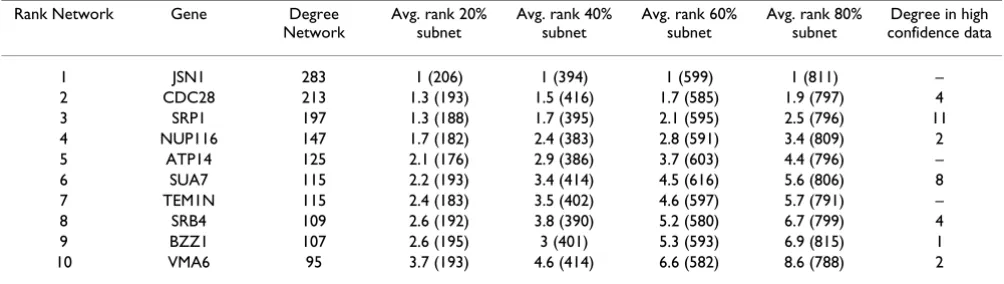
Figure 4A shows the correlation and partial correlation (correcting for expression level variation) coefficients between evolutionary rate and degree for the 20%, 40%, 60% and 80% subnetworks; correlations and partial cor-relations are measured using Kendall's rank correlation coefficient, τ. The evolutionary rate is obtained from com-parisons with six other yeast species [22], based on recon-structed phylogenies. There is a weak anti-correlation between evolutionary rate and degree and this anti-corre-lation is further weakened when expression level is taken into account in the partial correlation coefficients (blue boxplots in Figure 4). This anti-correlation strengthens somewhat in the larger subnets. There is a stronger anti-correlation (see Figure 4B) between evolutionary rate and expression level. These results suggest that the qualitative results of the work of, for example, Agrafioti et al. [22] – at least those referring to single nodes – remain valid in the ensembles of random subnets. Quite generally, under ran-dom sampling of nodes, single-node properties or any qualities that depend on a protein's degree should also be observable in the subnet. For example, under random sampling the most common proteins will remain the same, provided, of course, that they are included in the subnet (Table 2). Because of random sampling, a node which has rank m in the list of nodes ordered by degree in the full network will have rank l < m in a subnet with probability
conditional on it being included in the subnet. Eqn. (9) reflects the obvious point that the average rank of a node decreases with decreasing sampling fraction p. But because of Eqn. (9), single node properties in the true network – e.g. frequency of protein domains [23] or correlation between degree and expression level [22] – will be statis-tically conserved in the subnets. We note that these results are qualitatively unaffected by the reported "stickiness" of some of the proteins in table 2 (Sticky proteins will, of course also be sticky in smaller yeast two-hybrid studies). In the table we also provide the number of interactions observed in the high-confidence Database of Interacting Proteins (DIP) [24] data set. We find that the number of interactions reported for these proteins decreases dramat-ically (more quickly than would be expected given the rel-ative size of these datasets) but that overall we find a reasonable level correlation between the degrees of pro-teins which are included in both data sets (Kendall's τ≈ 0.53; p < 10-10). Discovering potential relationships
between, for example, motifs and evolutionary and func-tional properties, as previously suggested [25], is subject to the more disruptive effects of network sampling on such structures (several studies have found other reasons why the functional interpretation of motifs may be
diffi-πm l l m l
m
l p p
, = ( )
− ⎛ ⎝
⎜ ⎞
⎠
⎟ − − − +
( )
1 1 9
Properties of the yeast protein interaction networks under non-random sampling
Figure 3
Properties of the yeast protein interaction networks under non-random sampling. (A) Degree distributions for proteins with different expression levels and a subnet generated from interactions which have previously been assigned as more reliable. (B) Betweenness-centrality for the same subnets. (C) Z-score of each of six different 4-motifs for the full net-work and each subnet sampled according to expression level, as well as the netnet-work consisting of high-confidence interaction data.
Degree k
Pr(k)
2 5 100 200
2e-4
5e-4
0.001
0.002
0.005
0.01
0.02
0.05
0.
1
0
.2
Full Network
Genes with Expression Data
Top 80% expression
Top 60% expression
Top 40% expression
Top 20% expression
High confidence interactions
0 0 5 100 150 200 250
CentralityBetweenness
0 100 200 300 400
Z Score
1 2 3 4 5 6
Motif
A
B
C
10 20 5
0
0.2
0.4
0.6
0.8
1.0
Degree k
cult in many instances, see, for example, [26,27]). Given the results shown for motifs (discussed above in relation to Figures 1C,D and 2C), such analyses may need to be carefully re-evaluated in light of the sampling nature of present network data.
Discussion
We have explored effects of sampling on statistical meas-ures of protein interaction structure for different sampling schemes. Our comparison with the effects of noisy inter-action data (see figure 2) suggests that sampling and noise affect network statistics in different ways and we have therefore concentrated on the sampling effects as noise has received considerable attention previously (see, for example, [28,13,29]). Previous studies of network sam-pling properties focused on the degree distribution [4,30,6]. In our analysis we confirmed the results of these earlier studies, but one aspect of this study deserves closer scrutiny: with decreasing sampling fraction the degree dis-tribution of the randomly sampled subnets becomes straighter and the slope of the best-fit line becomes steeper. More interestingly, we find that for a data set which had previously [28] been classified as consisting of more reliable interactions, the degree distribution appears to be reasonably similar to the degree distribution of the overall network (this can be also quantified statistically [5]), especially when compared with the randomly gener-ated subnetwork ensemble.
Not surprisingly, we find that the effects of sampling on other statistical measures such as clustering coefficient, betweenness and motifs are more intricate (average path-lengths and diameter [1] have similarly diverse sampling properties). As statistical measures become less local, the effects of sampling become increasingly subtle. For exam-ple, BC is a non-local property and the effects of sampling act locally as well as globally as the system undergoes a structural phase transition with the giant connected com-ponent [19,31] breaking up as p decrease. Thus the frac-tion of pairs of nodes which are connected (belong to the same component) decreases and an increasing fraction of nodes has a BC value of 0. On the other hand, the fraction of shortest paths passing through the connected nodes increases systematically.
Motifs are local objects [11,12,32] but Z-scores are con-structed using a global network-rewiring approach [33,34]. Therefore their sampling properties are more intricate than those of subgraphs that are defined differ-ently [35]. This dual nature of motifs – they are local objects but their significance is assessed against a globally randomized network ensemble – explains the qualitative differences in their behaviour under different sampling regimes.
In addition to the sampling properties, one result which becomes obvious from the present analysis is that subnets of the same size can differ quite considerably; and, in par-ticular, the more complex measures of network structure such as motif spectra can exhibit variances that over-whelm the mean or median statistics. This becomes par-ticularly apparent in Figure 1C. It is partially for this reason that we have not emphasised the non-random sampling schemes more: a single instance of a network statistic represents only an instance of a sample drawn from an ensemble; for networks sampling of nodes leads to very broad distributions of sample statistics as would be expected for such highly correlated and structured data sets [1]. Sampling and noise affect these network statistics differently, with incomplete data introducing variability as well as systematic bias, and noise affecting almost exclusively the variance in, for example, the Z-scores of motifs.
For random subnets we also compared evolutionary results previously obtained for the "complete network" for the randomly generated networks. In Agrafioti et al. [22] only the effects of local structure (i.e. degree) were used and in light of the previous discussion it is therefore not surprising that the central results are generally con-firmed in the subnets: in particular protein expression level correlates better than degree with protein evolution-ary/substitution rate. For the non-random sampling schemes the data are biased in favour of protein abun-dance and results are also confirmed, but potentially biased somewhat against degree. In general, single-node properties of proteins are statistically conserved in the subnet, e.g. the protein with the highest degree will, pro-vided it is being included in the sample, tend to have the highest degree also in the subnet. As far as biological and functional inferences are concerned, the effects of network sampling properties appear to be not very different from statistical missing data problems. Thus the biological studies, which investigate, for example, the interplay between protein domain structure and protein interac-tions [23] are probably not affected. Investigating such properties across a network [36], however, may be subject to bias because of the intricacies displayed by the network sampling behaviour discussed here.
Conclusion
Correlation between evolutionary rate and degree and expression level
Figure 4
Correlation between evolutionary rate and degree and expression level. (A) The boxplots of Kendall's rank correla-tion coefficient (red) show a weak anti-correlacorrela-tion between evolucorrela-tionary rate and degree, which increases with subnet size. The corresponding partial correlation coefficients (blue) indicate a weaker anti-correlation when protein expression level is controlled for. (B) Correlation coefficients (red) between evolutionary rate and protein expression level and partial correlation coefficients (blue) which account for differences in protein degree. The anti-correlations found here are stronger than those shown in part A of this figure. The horizontal dot-dashed lines represent the correlation coefficients of the full network.
20% 20% 40% 40% 60% 60% 80% 80%
-0.20 -0.15 -0.10 -0.05
20% 20% 40% 40% 60% 60% 80% 80%
-0.35 -0.25
-0.30
A
sampling and their importance are well understood. The same is not true for the fledgling field of systems biology.
Noise and incompleteness affect network data in subtly different ways. As we have shown here, a subnet is much less than a part of the whole network and failure to account for this will bias inferences.
Methods
Yeast protein interaction data
Protein-protein interactions of Saccharomyces cerevisiae are obtained from the DIP database which lists 4773 proteins ('nodes' in network parlance) and the 15,461 interactions observed between these proteins. It is a manually curated catalogue of protein complexes and the interactions are obtained, inter alia, from yeast two-hybrid experiments and literature extraction. It is estimated that S. cerevisiae has around 6000 genes, so that which we call the full net-work is really a subnetnet-work itself. We have removed interactions leaving 15,181 interacting protein pairs; self-interactions are removed so that we can describe the PIN in terms of a simple graph [18]. It should be noted that in PINs the rates for false-positive and false-negative results are estimated [13,39] to be around 40%, with many inter-actions endorsed by only one experimental observation. This dataset then constitutes our assumed "real" or com-plete network.
Generating subnets
We randomly sampled (without replacement) the real network to produce 1000 subnets comprising 20%, 40%, 60% and 80% of the total number of nodes, respectively (Table 1). The random sampling scheme is the most par-simonious model for the choice of nodes which make up the subnets. In reality, however, experimentalists
design-ing e.g. yeast two-hybrid experiments will be guided by prior knowledge and/or a particular biological question in mind. While it is difficult to model the precise ascertain-ment process we have some additional information which allows us to study the effects of two other ascertainment schemes: first we consider the networks generated by tak-ing all proteins which were included in the expression analysis of Cho et al. [40] as well as the 20%, 40%, 60% and 80% of proteins with the highest expression levels. The second ascertainment scheme we consider is the sub-net of protein interactions which have been deemed to be reliable in the analysis of Gavin et al. [28] (referred to in the main text as high-quality/high-confidence data).
Generating noisy networks
The present S. cerevisiae PIN is, of course, not free from false-positive interactions; equally, false-negatives will have lead to missing interactions. Here we have used the PIN data as if it were the true network to study the effects of incomplete network data under different sampling schemes discussed above. In order to study the effects of noise, we follow the approach of Yook et al. [29] and add 10%, 20% and 40% of false interactions to study the effects of false-positives; we delete 10%, 20% and 40% of interactions to model the effect of false-negative; and we rewire (which corresponds to adding and deleting equal proportions of interactions) 10%, 20% and 40% of inter-actions to study the joint effects of positive and false-negative interactions. In this way we can qualitatively compare the effects of noise in the data with those of incomplete network data on network statistics.
Degree distribution
The degree distribution, Pr(k), is the probability that a node has k interaction partners. In uncorrelated networks
Table 2: Proteins with maximal degree-rank. The rank of a protein in the list of proteins ordered by degree, gene name, and number of connections of the top-ten most connected proteins in the full network are listed, followed by their corresponding mean rankings from the ensemble of 1000 20%, 40%, 60% and 80% subnetworks. Value in brackets are the number of subnets (out of 1000) in which the protein was present. The final column shows the degree in the high-confidence DIP data set; the correspondence between the degrees of a protein in both datasets appears to be poor. Overall, however, there is significant correlation between a protein's degree in the two data sets (τ≈ 0.53).
Rank Network Gene Degree
Network
Avg. rank 20% subnet
Avg. rank 40% subnet
Avg. rank 60% subnet
Avg. rank 80% subnet
Degree in high confidence data
1 JSN1 283 1 (206) 1 (394) 1 (599) 1 (811) –
2 CDC28 213 1.3 (193) 1.5 (416) 1.7 (585) 1.9 (797) 4
3 SRP1 197 1.3 (188) 1.7 (395) 2.1 (595) 2.5 (796) 11
4 NUP116 147 1.7 (182) 2.4 (383) 2.8 (591) 3.4 (809) 2
5 ATP14 125 2.1 (176) 2.9 (386) 3.7 (603) 4.4 (796) –
6 SUA7 115 2.2 (193) 3.4 (414) 4.5 (616) 5.6 (806) 8
7 TEM1N 115 2.4 (183) 3.5 (402) 4.6 (597) 5.7 (791) –
8 SRB4 109 2.6 (192) 3.8 (390) 5.2 (580) 6.7 (799) 4
9 BZZ1 107 2.6 (195) 3 (401) 5.3 (593) 6.9 (815) 1
[41,16], other properties depend only on the degree distri-bution and the degree sequence is a sufficient statistic. The expected degree distribution in the subnet is given by
or by
if nodes of degree 0 in the subnet are ignored.
Clustering coefficient
The clustering coefficient C is a measure of the average local neighbourhood in a network [42]. It is defined as the probability that two nodes j and k which are connected to node i are themselves connected to each other, and its value is restricted to the unit interval, 0 ≤C ≤ 1. It is aver-aged over all nodes in the network:
where ki is the degree of node i. It is a measure which describes the average local structure in a network [1]. When C is calculated only for the giant connected compo-nent the behaviour will differ slightly (Supplementary material [See Additional file 1]).
Betweenness
The betweenness of a node is the number of shortest paths in a network which includes this node [43]. Betweenness-centrality (BC) is the fraction of shortest paths which runs through a node. Here we focus on BC and its change under sampling. BC is highly correlated with degree in an obvious way with hubs having higher centrality than lower-degree nodes.
Motifs
Motifs are recurring patterns of connected subgraphs. It has been speculated that motifs may represent modules that are used repeatedly in similar biological processes, just as transistors are reused in larger electronic circuits [11,12].
Motifs and their statistical significance were determined using the mfinder package [11,12] which randomizes the edges in the true network (in this case the S. cerevisiae full-or sub-netwfull-ork) among the nodes (keeping the number of nodes and the degree of each node the same as that in the true network). The frequencies of the various 4-motifs are then determined for the randomized network. This is repeated a sufficiently large number of times to give a fre-quency distribution for each 4-motif pattern in the
ensem-ble of randomized networks, from which a Z-score for each motif can be determined [33,34]; this is defined [44] by
here n is the number of times the motif is found in the true network is the average number of times it is found in
the B replicate networks, and σB is the standard deviation across the replicate networks. The fact that the Z-score is approximately normally distributed allows us to define p -values. Thus a Z-score of 4 already corresponds to p ≈ 3.2 × 10⁻⁵ and would suggest significant overrepresentation of
the motif compared with the ensemble of randomized networks. It is therefore misleading to consider only the very highest Z-score as indicative of overrepresentation. Some authors [45] have argued that mere counting is suf-ficient to estimate the relative importance of a motif in a network. From a statistical perspective, such a notion can-not be upheld. We can-note, however, that the Z-score of a motif depends on an assumed probability model for net-work re-wiring, which may bias the Z-score.
Authors' contributions
EdeS, JS., CW. and MPHS designed the study; EdeS, TT., PJI, IA, JS and MPHS analyzed the data; CW and MPHS performed the mathematical analysis; the manuscript was written jointly by EdeS, JS, CW and MPHS. All authors read and approved the final manuscript.
Additional material
Acknowledgements
EdeS, TT, PJI, IA and MPHS acknowledge financial support from the Well-come Trust. CW and MPHS are grateful to the Carlsberg Foundation and the Royal Society, UK, for their generous support. CW is supported by the Danish Cancer Society. MPHS receives further support through an EMBO Young Investigator Award.
References
1. de Silva E, Stumpf M: Complex networks and simple models in biology. J Roy Soc Interface 2005, 2(5):419-30.
2. Stelzl U, Worm U, Lalowski M, Haenig C, Brembeck F, Goehler H, Stroedicke M, Zenkner M, Schoenherr A, Koeppen S, Timm J, Mint-Pr ( ) k l ( ) Pr ( ),
k p p l
l k
k l k
= ⎛ ⎝ ⎜ ⎞ ⎠ ⎟ −
( )
≥ −∑
1 10Pr ( )
( ) Pr ( )
( ) Pr ( ), k p l l
k p p l
l
l l k
k l k = − − ⎛ ⎝ ⎜ ⎞ ⎠ ⎟ − = ∞ ≥ −
∑
∑
1 1 1 1 11 0 (( )C= 2 Number of neighbours of node which are themselves neiighbours× i
k ki
i N
(1 )
1 1
12
− ( )
= ∑
Additional File 1
Variability in the degree distributions of subnets; Predicting the clustering coefficient of the overall network; Sampling properties of network compo-nents; Inferences from Motif-spectra
Click here for file
[http://www.biomedcentral.com/content/supplementary/1741-7007-4-39-S1.pdf]
Z n nB
B
−score= −
( )
σ ; 13
Publish with BioMed Central and every scientist can read your work free of charge
"BioMed Central will be the most significant development for disseminating the results of biomedical researc h in our lifetime."
Sir Paul Nurse, Cancer Research UK
Your research papers will be:
available free of charge to the entire biomedical community
peer reviewed and published immediately upon acceptance
cited in PubMed and archived on PubMed Central
yours — you keep the copyright
Submit your manuscript here:
http://www.biomedcentral.com/info/publishing_adv.asp
BioMedcentral
zlaff S, Abraham C, Bock N, Kietzmann S, Goedde A, Toks?z E, Droege A, Krobitsch S, Korn B, Birchmeier W, Lehrach H, Wanker E: A human protein-protein interaction network: a resource for annotating the proteome. Cell 2005, 122(6):957-68. 3. Rual J, Venkatesan K, Hao T, Hirozane-Kishikawa T, Dricot A, Li N,
Berriz G, Gibbons F, Dreze M, Ayivi-Guedehoussou N, Klitgord N, Simon C, Boxem M, Milstein S, Rosenberg J, Goldberg D, Zhang L, Wong S, Franklin G, Li S, Albala J, Lim J, Fraughton C, Llamosas E, Cevik S, Bex C, Lamesch P, Sikorski R, Vandenhaute J, Zoghbi H, Smo-lyar A, Bosak S, Sequerra R, Doucette-Stamm L, Cusick M, Hill D, Roth F, Vidal M: Towards a proteome-scale map of the human
protein-protein interaction network. Nature 2005,
437(7062):1173-8.
4. Stumpf M, Wiuf C, May R: Subnets of scale-free networks are not scale-free: the sampling properties of networks. Proc Natl Acad Sci USA 2005, 102:4221-4224.
5. Stumpf M, Wiuf C: Sampling properties of random graphs: the degree distribution. Phys Rev E 2005, 72:036118.
6. Han J, Dupuy D, Bertin N, Cusick M, Vidal M: Effect of sampling on topology predictions of protein-protein interaction net-works. Nature Biotechnol 2005, 23:839-844.
7. Lee S, Kim P, Jeong H: Statistical properties of sampled net-works. Phys Rev E 2006, 73:016102.
8. Hakes L, Robertson D, Oliver S: Effect of dataset selection on the topological interpretation of protein interaction net-works. BMC Genomics 2005, 6:131.
9. Evans T: Complex Networks. Contemporary Physics 2004,
45(6):455-474.
10. Wiuf C, Stumpf M: Binomial sampling. Proc Royal Soc A 2006,
462:1181-1195.
11. Milo R, Shen-Orr S, Itzkovitz S, Kashtan N, Chklovskii D, Alon U:
Network motifs: Simple building blocks of complex net-works. Science 2002, 298(5594):824-827.
12. Milo R, Itzkovitz S, Kashtan N, Levitt R, Shen-Orr S, Ayzenshtat I, Sheffer M, Alon U: Superfamilies of evolved and designed net-works. Science 2004, 303(5663):1538-1542.
13. Bader JS, Chaudhuri A, Rothberg JM, Chant J: Gaining confidence in high-throughput protein interaction networks. Nat Biotech-nol 2004, 22:78-85.
14. Lappe M, Holm L: Unraveling protein interaction networks with near-optimal efficiency. Nat Biotechnol 2004, 22:98-103. 15. Berg J, Lässig M: Correlated random networks. Phys Rev Lett
2002, 89:228701.
16. Burda Z, Krzywicki A: Uncorrelated Random Networks. Phys Rev E 2004, 67:046118.
17. Cox D, Hinkley D: Theoretical Statistics New York: Chapman&Hall/ CRC; 1974.
18. Bollobás B: Random Graphs Academic Press; 1998.
19. Newman M, Strogatz S, Watts D: Random graphs with arbitrary degree distributions and their applications. Phys Rev E 2001,
64:026118.
20. von Mering C, Krause R, Snel B, Cornell M, Oliver SG, Fields S, Bork P: Comparative assessment of large-scale data of protein-protein interactions. Nature 2002, 417(6887):399-403. 21. Ebel H, Mielsch L, Bornholdt S: Scale-free topology of e-mail
net-works. Phys Rev E 2002, 66(035103):.
22. Agrafioti I, Swire J, Abbott I, Huntley D, Butcher S, Stumpf M: Com-parative analysis of the Saccaromyces cerevisiae and Caenorhabditis elegans protein interaction networks. BMC Evolutionary Biology 2005, 5:23.
23. Nye T, Berzuini C, Gilks W, Babu M, Teichmann S: Statistical anal-ysis of domains in interacting protein pairs. Bioinformatics 2005,
21:993-1001.
24. Database of Interacting Proteins (DIP) [http://dip.doe-mbi.ucla.edu]
25. Wuchty S, Oltvai Z, Barabsi AL: Evolutionary conservation of motif constituents in the yeast protein interaction network.
Nat Genet 2003, 35(2):176-9.
26. Mazurie A, Bottani S, Vergassola M: An evolutionary and func-tional assessment of regulatory network motifs. Genome Biol-ogy 2005, 6:R35.
27. Ingram P, Stumpf M, Stark J: Network motifs: structure does not determine function. BMC Genomics 2006, 7:108.
28. Gavin M, Bosche M, Krause R, Grandi P, Marzioch M, Schultz J, Rick J, Michon A, Cruciat C, Remor M, Hofert C, Schelder M, Brajenovic M, Ruffner H, Merino A, Hudak M, Dickson D, Rudi T, Ganu V, Bauch
A, Bastuck S, Huhse B, Leutwein C, Heurtier M, Copley R, Edelmann A, Querfurth E, V R, Drewes G, Raida M, Bouwmeester T, Bork P, Seraphin B, Kuster B, Neubauer G, G SF: Functional organization of the yeast proteome by systematic analysis of protein com-plexes. Nature 2002, 415:141-147.
29. Yook SH, Oltvai ZN, Barabsi AL: Functional and topological characterization of protein interaction networks. Proteomics
2004, 4(4):928-42.
30. Stumpf M, Ingram P: Probability models for degree distribu-tions of protein interaction networks. Europhys Lett 2005,
71:152-158.
31. Newman M: The structure and function of complex networks.
SIAM Review 2003, 45(2):167-256.
32. Kashtan N, Itzkovitz S, Milo R, Alon U: Topological generaliza-tions of network motifs. Physical Review E 2004, 70(3):. art. no.-031909.
33. Maslov S, Sneppen K, Alon U: Correlation profiles and motifs in complex networks. In Handbook of Graphs and Networks Wiley-VCH; 2003.
34. Kashtan N, Itzkovitz S, Milo R, Alon U: Efficient sampling algo-rithm for estimating subgraph concentrations and detecting network motifs. Bioinformatics 2004, 20(11):1746-1758. 35. Kuramochi M, Karypis G: An efficient algorithm for discovering
frequent subgraphs. IEEE Transactions in Knowledge Discovery and Engineering 2002.
36. Luscombe N, Babu M, Yu H, Snyder M, Teichmann S, Gerstein M:
Genomic analysis of regulatory network dynamics reveals large topological change. Nature 2004, 431:308-312.
37. Fraser HB, Hirsh AE, Steinmetz LM, Scharfe C, Feldman MW: Evolu-tionary rate in the protein interaction network. Science 2002,
296(5568):750-2.
38. Ewens W: Mathematical Population Genetics 2nd edition. New York: Springer; 2004.
39. Tong AHY, Lesage G, Bader GD, Ding H, Xu H, Xin X, Young J, Berriz GF, Brost RL, Chang M, Chen Y, Cheng X, Chua G, Friesen H, Gold-berg DS, Haynes J, Humphries C, He G, Hussein S, Ke L, Krogan N, Li Z, Levinson JN, Lu H, Mnard P, Munyana C, Parsons AB, Ryan O, Tonikian R, Roberts T, Sdicu AM, Shapiro J, Sheikh B, Suter B, Wong SL, Zhang LV, Zhu H, Burd CG, Munro S, Sander C, Rine J, Greenblatt J, Peter M, Bretscher A, Bell G, Roth FP, Brown GW, Andrews B, Bus-sey H, Boone C: Global mapping of the yeast genetic interac-tion network. Science 2004, 303(5659):808-13.
40. Cho R, Campbell M, Winzeler E, Steinmetz L, Conway A, Wodicka L, Wolfsberg T, Gabrielian A, Landsman D, Lockhart D, Davies R: A genome-wide transcriptional analysis of the mitotic cell cycle. Mol Cell 1998, 2:65-73.
41. Dorogovtsev S, Mendes J: Evolution of Networks Oxford University Press; 2003.
42. Watts D, Strogatz S: Collective dynamics of small-world net-works. Nature 1998, 393:440-442.
43. Goh KI, Oh E, Jeong H, Kahng B, Kim D: Classification of scale-free networks. Proc Natl Acad Sci USA 2002, 99(20):12583-8. 44. Ewens W, Grant G: Statistical Methods in Bioinformatics New York:
Springer; 2001.
45. Wuchty S, Stadler PF: Centers of complex networks. J Theor Biol