Open Access
Research article
Real-time phase-contrast x-ray imaging: a new technique for the
study of animal form and function
John J Socha*
1, Mark W Westneat
2, Jon F Harrison
3, James S Waters
3and
Wah-Keat Lee
1Address: 1Advanced Photon Source, Argonne National Laboratory, 9700 S. Cass Ave., Argonne, IL 60439, USA, 2Department of Zoology, Field Museum of Natural History, 1400 S. Lake Shore Dr., Chicago, IL, 60605, USA and 3Section of Organismal, Integrative, and Systems Biology, School of Life Sciences, Arizona State University, PO Box 874501, Tempe, AZ, 85287-4501, USA
Email: John J Socha* - [email protected]; Mark W Westneat - [email protected]; Jon F Harrison - [email protected]; James S Waters - [email protected]; Wah-Keat Lee - [email protected]
* Corresponding author
Abstract
Background: Despite advances in imaging techniques, real-time visualization of the structure and dynamics of tissues and organs inside small living animals has remained elusive. Recently, we have been using synchrotron x-rays to visualize the internal anatomy of millimeter-sized opaque, living animals. This technique takes advantage of partially-coherent x-rays and diffraction to enable clear visualization of internal soft tissue not viewable via conventional absorption radiography. However, because higher quality images require greater x-ray fluxes, there exists an inherent tradeoff between image quality and tissue damage.
Results: We evaluated the tradeoff between image quality and harm to the animal by determining the impact of targeted synchrotron x-rays on insect physiology, behavior and survival. Using 25 keV x-rays at a flux density of 80 µW/mm-2, high quality video-rate images can be obtained without
major detrimental effects on the insects for multiple minutes, a duration sufficient for many physiological studies. At this setting, insects do not heat up. Additionally, we demonstrate the range of uses of synchrotron phase-contrast imaging by showing high-resolution images of internal anatomy and observations of labeled food movement during ingestion and digestion.
Conclusion: Synchrotron x-ray phase contrast imaging has the potential to revolutionize the study of physiology and internal biomechanics in small animals. This is the only generally applicable technique that has the necessary spatial and temporal resolutions, penetrating power, and sensitivity to soft tissue that is required to visualize the internal physiology of living animals on the scale from millimeters to microns.
Background
The ability to visualize the internal anatomy of living ani-mals is fundamental to our understanding of biology and medicine. Although imaging systems for respiratory, cir-culatory and musculoskeletal systems are available for
large animals, real-time visualization of the internal proc-esses of small animals has been limited by scaling factors and imaging technology. In order to visualize internal physiological mechanisms of millimeter-sized animals in real-time, a probe must have the following features: (1)
Published: 1 March 2007
BMC Biology 2007, 5:6 doi:10.1186/1741-7007-5-6
Received: 28 January 2007 Accepted: 1 March 2007
This article is available from: http://www.biomedcentral.com/1741-7007/5/6
© 2007 Socha et al; licensee BioMed Central Ltd.
ability to penetrate the opaque exterior, (2) spatial resolu-tion in the 1–10 µm range, (2) temporal resolution below 100 ms, and (4) sensitivity to soft tissue. Visible light microscopy (conventional or confocal) is not broadly applicable for intact, live animals due to animal opacity and size limitations. Near-infrared (NIR) microscopy has been tried, but with limited success due to poor spatial resolution [1]. Magnetic resonance imaging (MRI) has been used to image insects [2], but the best resolution obtained so far is about 50 µm, and images must be aver-aged over seconds to minutes. For sufficient penetration, spatial resolution of ultrasound imaging is wavelength-limited [3] to about 100 µm. Conventional x-ray imaging relies on absorption as the contrast mechanism, which is ineffective at visualizing soft tissue. For example, at 25 keV, the maximum absorption contrast of a 100-µm diameter air-filled trachea in water is only 0.3%, smaller than the Poisson noise for a high-end 16-bit CCD camera (0.4%).
Compared to these other techniques, synchrotron x-ray phase-contrast imaging [4,5] is ideal for visualizing well-defined internal structures that have different mass densi-ties. Tracheal tubes, in particular, show up extremely well (Figure 1a–d; see also Additional file 1), with edge con-trast in a 100-µm diameter trachea that can be more than 50%. For example, this technique has been recently used to observe directly tracheal compression dynamics in opaque insects [6]. This research, which examined detailed networks of tracheal tubes down to tubes of 10 µm in diameter in living specimens, has revealed a mech-anism of breathing that was previously identified with only a single species of translucent flea [7]. Such studies demonstrate the ability of synchrotron imaging to open up whole new avenues of scientific inquiry in biology.
The basis of the x-ray phase-contrast imaging described here is Fresnel diffraction. For samples with minimal absorption, true for insects at the x-ray energies used here, the intensity of an image at a distance d downstream of the sample can be approximated by Equation 1 (see also [8]):
I(x, y) = Iinc (1 + 1.3 × 10⁻⁶ × d × λ2 × ∇2 [∫ρ(x, y, z)dz]) * R(x, y) (1)
where Iinc is the incident beam intensity, λ(in Å) is the x-ray wavelength, ρ(in g cm-3) is the sample density, R(x, y) is the effective detector resolution, x-y is the image plane,
z is the beam direction, and * denotes a convolution. R(x,
y) depends on the detector properties (scintillator, lens
and pixel size) and the projected source size, , where
σs is the source size, d is the sample-detector distance, and
L is the source-sample distance (Figure 2). Increasing either the x-ray wavelength (lowering x-ray photon energy) or the sample-detector distance increases contrast (Figure 3). However, using longer x-ray wavelengths results in higher absorption, which is detrimental to the living animal. Similarly, increasing the sample-detector distance results in a loss of spatial resolution due to the increase in projected source size. Higher incident beam intensities give brighter and less noisy images (Figure 4b), but cause more harm to the insect. Given the complex interplay of these physical and biological factors, there is no a priori prescription for how best to optimize synchro-tron phase-contrast imaging for organismal studies. Thus, one of the objectives of this study is to examine multiple experimental parameters to provide biologists a frame-work for using synchrotron phase-contrast imaging.
A major concern in using synchrotron x-rays to study physiological processes in small animals is the effect of the x-rays on the animal. Radiation causes molecular damage, including protein and lipid oxidation and gene transmutation; however, the effects depend on dose [9]. Previous studies show that fruit flies (Drosophila mela-nogaster) [10] and wasps (Habrobracon and Bracon hebetor) [11,12] temporarily lose motor control after a dose of about 1–2 kGy, but recover to normal behavior within minutes [9] or hours [12]. At exposures greater than 2.5 kGy, insects do not recover, although it is unclear when death actually occurs [12]. Feeding patterns are affected after 600 (D. melanogaster) [13] to 1000 Gy (Bracon hebetor
Say) [11]. In one study of D. melanogaster receiving doses of 600 Gy, metabolic rates were unaffected one day after
irradiation [13]. In summary, the literature suggests that there are no observable physiological effects at doses less than 500 Gy, a temporary loss of motor control is observed after ~1.5 kGy, and a more permanent loss of motor control occurs at doses greater than 2.5 kGy. How-ever, in most prior studies of radiation effects on insects (concerned primarily with insect control [14] and ageing [15]), animals have been subjected to full body irradia-tion; the few studies that examined localized x-rays have used low levels of radiation [16-19]. Thus it is unknown how insects are affected by intense, targeted radiation – such as in a synchrotron x-ray beam – on specific parts of the body. Furthermore, previous studies focused primarily on effects that occur on a relatively long time scale, usually days after irradiation, and few studies have examined immediate radiation effects. This study strives to answer two questions: what combination of x-ray beam parame-ters optimizes image quality while minimizing damage to the animal? And under these conditions, how much time is available before the insect is negatively impacted? We varied x-ray parameters and used both CO2 emission pat-σsd
Full-field 2-D projection images created using phase-contrast synchrotron x-rays
Figure 1
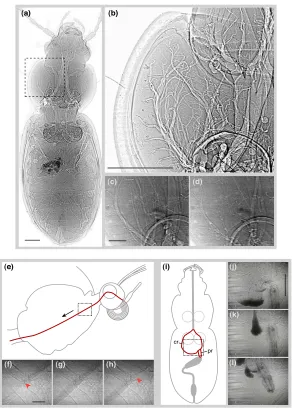
Full-field 2-D projection images created using phase-contrast synchrotron x-rays. Images were chosen to highlight the highest quality imagery currently obtainable (a, b) and corresponding stills from live video (c-l). (a) Carabid beetle ( Pteros-tichus stygicus) in dorsoventral view with legs removed and sacrificed prior to imaging. Image is a high-resolution composite of multiple images. The air-filled tubes of the tracheal system can be prominently seen. The dark spots on the left side, mid-body are soil particles on the outer surface of the elytra. (b) Close-in view of one section of the prothorax, showing the branching pattern of tracheae. (c, d) One half-cycle of rhythmic tracheal collapse in a live carabid beetle (Platynus decentis) in dorsoventral view. Images are frame grabs from a video recording (See Additional file 1); time interval is 0.5 s. Total time of collapse and reinflation of the tubes is 1.0 s. (e-l) Visualization of internal food movement using labeled markers. (e) Schematic of the head and thorax of a butterfly (Pieris rapae) in lateral view. The foregut is shown in red; the square highlights the region of video stills in (f-h), and black arrow indicates the direction of food movement. (f-h) Video stills of passage of a food bolus posteriorly through the esophagus, moving through the frame from upper right to lower left (see Additional file 2). Red arrows indicate the leading (f) and trailing (h) edges of the bolus. Interval between frames is 0.5 s. Food is sugar water/iodine mixture. X-ray energy (33.2 keV) was tuned to just above the K-edge absorption band for iodine. (i) Schematic of a carabid beetle (Pterostichus stygicus) in dorsoventral view (legs removed). Circular structures in mid-body represent coxae; the gut is represented in gray and red. Square highlights video in (j-l), visualization of cadmium-laced food in the foregut (see additional file 3). Video stills (j-l) show movement of gut including anterior-posterior translation and squeezing of the crop (cr) and translation and rotation of the proventriculus (pr). The proventriculus is a valve that leads to the midgut [41]; here, it is closed. Note that only parts of the gut with contrast agent can be seen. Interval between frames: j-k, 2 s; k-l, 6 s. X-ray energy, 25 keV. Scale bars: a,b, 1 mm; c,d, 200 µm; f-h, 200 µm; j-l, 1 mm.
(b) (a)
(c) (d)
(j)
(k)
(l)
cr
pr (i)
(f)
(e)
terns and motor behaviors as proxy indicators to assess physiological damage in four insect species. In addition, we demonstrate the range of studies that can be addressed using this technique by showing examples of high-resolu-tion still imagery and real-time movement of food during ingestion and digestion.
Results
There is a trade-off between image quality and survivor-ship: higher quality images require greater exposures to radiation, which result in greater harm to the animal. With our video camera and beamline configurations, we found a satisfactory comprise between image quality and
survivorship by using 25 keV x-rays at 80 µW/mm2 flux density (2 × 10¹⁰ ph/s/mm2) and 1 m sample-detector dis-tance (hereafter referred as 'nominal' settings). With these settings, insects exhibited no negative behavioral effects for a period of about 5 minutes. X-rays on the insect's head or thorax caused major changes to the respiratory pattern by about 17 minutes (2.4 kGy). With the beam on the abdomen, no significant changes were observed on the respiratory pattern throughout the full 2-hr trials (17.3 kGy), or even in two trials that were extended to 4 hrs (34.5 kGy). No thermal effects of the x-rays were observed. Food transport and gut structures could be clearly seen using labeled food (Figure 1e–l). In cases
Experimental setup
Figure 2
Experimental setup. (a) Schematic of phase-contrast imaging setup at the Advanced Photon Source. X-rays are produced by an undulator and monochromatized by a Si (111) double crystal monochromator. The partially coherent, monochromatic x-ray beam passes through an ion chamber and then the sample. The x-rays are converted to visible light by a scintillator screen, and the resulting image is recorded by a CCD image sensor. (b) Schematic of respirometry setup. MFC, mass flow valve and elec-tronics control unit; S, CO2 scrubber; RC, respirometry chamber; CO2, CO2 analyzer; MFM, mass flow meter. (c) Typical
plex-iglass respirometry chamber. Yellow material is Kapton, used to provide an x-ray transparent window to the animal. Internal chamber volume is 0.25 ml.
Source
Slits
Ion
chamber
Scintillator
Mirror
Objective lens
Undulator
Insect
X-ray beam
Visible light
CCD
videocamera
Double chrystal
monochromator
Si (111)
Source-sample distance, L
Sample-detector
distance, d
X-ray beam
S
RC
MFC
Pump
CO
2MFM
(b)
(a)
where tracking food transport was more important than maximizing the clarity of internal anatomy, 33.2 keV x-rays were successfully used to visualize iodine-laced food. Although not explicitly tested, the shorter wavelength of the x-rays at this setting results in lower absorption and therefore lower impact on the animals. We observed insect feeding under irradiation for more than 30 min-utes, depending on species and location of the x-rays on the insect.
Image quality
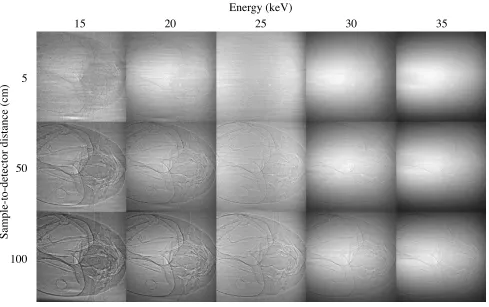
Figure 3 demonstrates the advantage of phase-contrast imaging over conventional absorption-based imaging. At
d = 5 cm, where the phase effects are minimal, image con-trast is poor for all energies, consistent with the fact that the absorption is small. For d = 5 cm and E = 15 keV, although some differences due to absorption can be seen, it is the small phase-contrast edge enhancements that make the features easily discernible. At a fixed energy, increasing d clearly increases the image contrast, as pre-dicted by Equation 1. A careful comparison of the image at d = 100 cm with d = 5 or 50 cm shows that the spatial
resolution of the d = 100 cm image is poorer: the line widths at the edges of the air sacs are broader in the d = 100 cm image.
Thermal effects due to x-ray irradiation
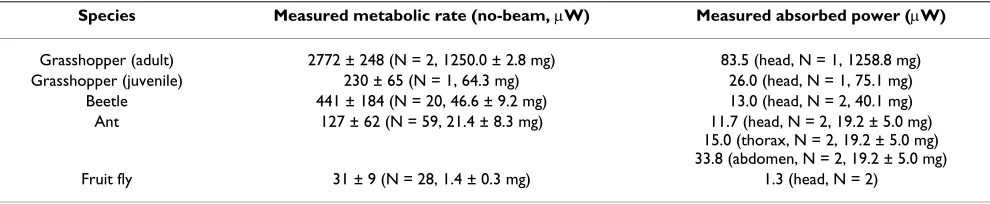
Measurements from both the thermocouple and the infra-red camera showed no change in temperature to the irra-diated insect. This is not surprising, because the nominal power absorbed by the insect is, in the most extreme case, only about 20% of its unirradiated metabolic rate (Table 1).
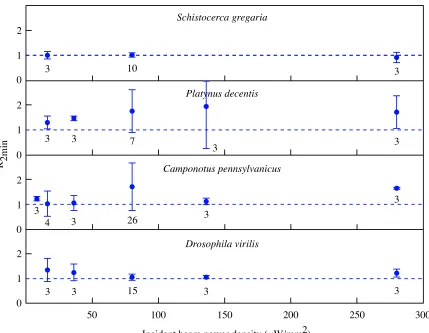
X-ray irradiation effects on CO2 emission patterns The effect of x-ray radiation dosage on metabolic rates was quantified by examining the effect of incident beam flux density on the ratio of mean CO2 emission rate during the 2 minutes after 'beam on' divided by the mean CO2 emis-sion rate during the 2 minutes before 'beam on' (R2 min) (all
measurements at 25 keV; Figure 5). Except for grasshop-pers, the data show a slight but significant increase in aver-age CO2 emission immediately after 'beam on'. This small increase is probably the result of movement of the insect
Video image quality as a function of x-ray energy and sample-detector distance
Figure 3
Video image quality as a function of x-ray energy and sample-detector distance. Data are from an ant head ( Cam-ponotus pennsylvanicus) using a Cohu 4950 video camera. Within each column, the absorbed x-ray dose on the insect is con-stant. For all images, the photon flux was kept at approximately 2 × 10¹⁰ ph/s/mm2.
Energy (keV)
15
20
25
30
35
5
100
50
(seen in the x-ray videos) as it tried to move away from the beam. However, increasing beam intensity to four-times nominal values had little effect on R2 min, suggesting that, although insects appear to sense the beam, there is a con-siderable safety margin in the capacity to absorb x-rays before major physiological damage occurs during the ini-tial minutes of exposure.
Although CO2 emission patterns during the first minutes after 'beam on' are similar to those prior to irradiation (Figure 6), a major change in the CO2 emission pattern (respiratory signal, RS) was observed in all species after 1000–1500 s of irradiation. The RS was correlated with dorsoventral head-shaking in the ants and beetles, and a quivering proboscis in fruit flies, but was not correlated with any observable behavior in grasshoppers. We note
that for ants, the RS is qualitatively similar to the 'mortal fall' signature observed for ants under thermal stress [20], even though in our case there were no measurable temper-ature changes (0.1 K resolution) in the animal. Shortly after the RS, the CO2 emission pattern became periodic for all ant samples, and for most of the beetle (12 of 15) and grasshopper (9 of 16) samples. For ants, these periodic patterns resemble discontinuous gas exchange (DGC) reported in decapitated ants [21], so we interpret the RS as indicating major brain damage.
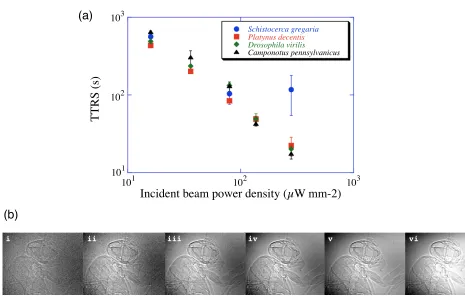
Time to respiratory signal (TTRS) varied strongly with incident beam power density (Figure 4a); higher power densities resulted in lower TTRS for all species. The one exception was grasshoppers at the highest power density, which showed a higher TTRS than the other species.
Fig-Image quality versus TTRS
Figure 4
Image quality versus TTRS. (a) Plot of TTRS ('time to respiratory signal', which indicates major respiratory damage; see Figure 6) as a function of incident power density for all four species. At least three trials were performed per data point. A power law fit to the data gives: TTRS (s) = 90484 x-1.02, R = 0.97 where × is the incident beam power density in µW/mm2.
TTRS measurements as a function of animal mass showed no correlation for the mass range 8.4–53.7 mg and 13.3–1473.5 mg for ants and grasshoppers, respectively. (b) Still images taken from video (16.6 ms exposure) footage of a dead fruit fly ( Dro-sophila melanogaster) as a function of incident beam power density, which are, respectively from i-vi: 4, 8, 16, 36, 80, 103 µW/ mm2. X-ray energy is 25 keV. At 80 µW/mm2, the photon density is 2 × 10¹⁰ ph/s/mm2. Field of view is 1.0 × 1.3 mm using a 5×
objective lens. Head and thoracic air sacs and leg trachea can be clearly seen. These images are taken with our new camera (Cohu 2700), which is twice as sensitive as the camera used in the major part of this study. Although we subjectively consider (iv) to be a high quality image, usable images can be obtained using lower beam intensities.
iv v
iii
i ii vi
(a)
(b)
Incident beam power density (µW mm-2)
TTRS (s)
101 102 103
101 102 103
Schistocerca gregaria
Platynus decentis Drosophila virilis
ure 4b shows still images taken from the video corre-sponding to the different incident power densities. Together, Figures 4a and 4b provide a guide for an exper-imenter to gauge the compromise between image quality and physiological impact.
TTRS dependence on insect mass
Measurements at the nominal beam intensity showed no mass dependence on the TTRS for grasshoppers (N = 9, 13.3–1473.5 mg, Spearman ρ = 0.23, p = 0.51) and ants (N = 14, 8.4–53.7 mg, Spearman ρ = -0.24, p = 0.38). One possible explanation for this lack of pattern is that, in all cases, major portions of the brain were irradiated.
TTRS dependence on x-ray beam location on the insect body
From CO2 emission measurements in ants, there is no sig-nificant difference (Student's t-test, p = 0.4) in TTRS between having the nominal x-ray beam incident on the head (N = 3, TTRS = 1299 ± 177 s) or the thorax (N = 3, TTRS = 1092 ± 249 s) of the animal. In contrast, no change in CO2 emission pattern was observed with the x-ray beam incident on the abdomen (N = 3, Figure 7a), even after 4 hrs of exposure at the nominal beam intensity. These results are consistent with the fact that in ants, and most insects, most ventilatory activity is controlled by major ganglia of the central nervous system in the head and tho-rax [22].
X-ray irradiation effects on motor function
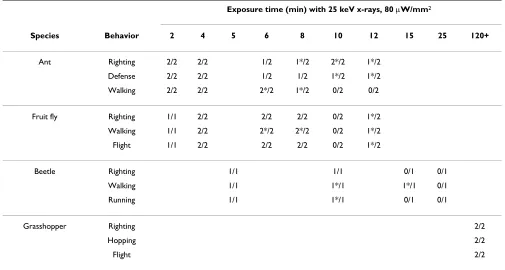
Using simple behavioral assays, we tested for the pres-ence/absence of righting behavior, defensive behavior, and locomotor ability after a fixed duration of x-ray expo-sure on the head using nominal beam settings (Table 2). No changes in behavior were observed within the first 5 minutes of exposure. During 6–25 minutes of x-ray expo-sure, ants, beetles and flies progressively lost motor abili-ties, starting with leg twitches and ranging to full immobility. By contrast, after 2 hrs of exposure, the
grass-hoppers could still right themselves, hop, feed and fly (and were later observed to mate and lay eggs). One major difference between the grasshoppers and all other insects studied is that, because of their large size, only a part of the grasshopper's head was irradiated as opposed to the entire head in the other taxa. We note that, consistent with other studies [11,12,23], the loss of locomotor abilities observed in the insects at lower dosages was temporary, indicating radiation-induced lethargy. In many individu-als, we observed recovery minutes to hours later, suggest-ing that radiation damage was at least partially repairable.
Discussion
Our measurements show that a major change in CO2 emission pattern, probably indicating major damage to the central nervous system, occurred after about 2.4 kGy when the insect was exposed on the head or thorax. No change in CO2 emission was observed if the x-ray beam was incident on the abdomen. The TTRS was independent of mass and species. In ants, beetles and juvenile grass-hoppers whose entire heads were irradiated, a cyclic or discontinuous gas exchange (DGC) CO2 emission pattern [24] occurred after the RS. Ants have also been shown to exhibit DGC after they are physically decapitated [25,26], supporting the hypothesis that the x-ray treatment caused major brain damage. In cases where the RS was observed in this study, it is likely that the very high, acute dose of radiation caused profound tissue damage, causing such problems as potassium leakage [27,28] and leading to effects akin to the 'central nervous system syndrome' known from mammals [29]. One puzzling result is that although grasshoppers were no different in TTRS at some power densities, they showed a surprising degree of behavioral control after long periods of irradiation, sug-gesting a greater tolerance of x-rays to the head. For these animals, whose heads were larger than the size of the x-ray beam, the positioning of the x-ray beam may have missed or only partially damaged parts of the central nervous sys-tem, including the major ganglia controlling respiratory
Table 1: Measured no-beam metabolic rates and absorbed powers under x-ray irradiation (25 keV, 80 µW/mm2) for the four species
studied.
Species Measured metabolic rate (no-beam, µW) Measured absorbed power (µW)
Grasshopper (adult) 2772 ± 248 (N = 2, 1250.0 ± 2.8 mg) 83.5 (head, N = 1, 1258.8 mg)
Grasshopper (juvenile) 230 ± 65 (N = 1, 64.3 mg) 26.0 (head, N = 1, 75.1 mg)
Beetle 441 ± 184 (N = 20, 46.6 ± 9.2 mg) 13.0 (head, N = 2, 40.1 mg)
Ant 127 ± 62 (N = 59, 21.4 ± 8.3 mg) 11.7 (head, N = 2, 19.2 ± 5.0 mg)
15.0 (thorax, N = 2, 19.2 ± 5.0 mg) 33.8 (abdomen, N = 2, 19.2 ± 5.0 mg)
Fruit fly 31 ± 9 (N = 28, 1.4 ± 0.3 mg) 1.3 (head, N = 2)
and motor function. In particular, partial control of motor behaviors such as walking occur in ganglia in the thorax [30-32]. Many of the smaller insects received incidental radiation on the thorax due to geometry during nominal 'head only' trials and exhibited motor loss, lending further weight to this hypothesis.
Due to the many factors that contribute to the question of image quality versus survivorship, there is no single set of x-ray parameters that provide an optimal setting. Gener-ally, one would like a very small source size to minimize image blur, and an efficient detector system so that a less intense x-ray beam can be used to maximize survivorship. In practice, for insect physiology, the first question is
whether the particular internal dynamic or morphology can be visualized by this technique. Given the particular source and detector that is available, one usually starts with parameters that give superior image quality. Based on our experience with insects, this is usually with an x-ray energy of 10–20 keV and a sample-detector distance of 10–100 cm. After the desired feature is visualized, the experimenter can optimize the system based on the rela-tive importance of image contrast, spatial resolution, and survivorship.
With our commercially available standard NTSC inter-laced video camera (30 fps, Cohu 4920) and nominal incident fluxes of 2 × 10¹⁰ ph/s/mm2 at 25 keV, a 16.6 ms
R2 min as a function of incident beam power density
Figure 5
R2 min as a function of incident beam power density. R2 min is the ratio of mean CO2 emission rate during the 2 minutes
after 'beam on' divided by the mean CO2 emission rate during the 2 minutes before 'beam on'. Error bars denote standard
devi-ation; numbers below each data point correspond to sample sizes. The 25 keV x-ray beam was incident on the head.
1 2
0 1 2
0 1 2
0 1 2
0
50 100 150 200 250 300
Incident beam power density (µW/mm2) R 2min
Schistocerca gregaria
Platynus decentis
Camponotus pennsylvanicus
Drosophila virilis
3 3 15
26 3
4
3 3
3 3
3 3 3
3 7
10 3
(1/60 s) exposure time is sufficient to produce a quality image and record many physiological functions. For body functions that require shorter exposure times (e.g., flight), higher incident beam fluxes are necessary (and are availa-ble), in which case insect survivorship will be correspond-ingly reduced. However, in many cases the total time needed to record such rapid phenomena will be lower. Nonetheless, because the current overall detection effi-ciency is still very low (< 10%) [33], there is ample room for technological improvement with the development of better detectors. In fact, during the course of this manu-script preparation, we acquired a new video camera with the same pixel numbers and sizes, but with twice the
sen-sitivity; thus, we can now obtain high-quality images with only 1 × 10¹⁰ ph/s/mm2 incident beam flux (Figure 4b). This improvement should double the working time (from 5 to 10 minutes) before any x-ray related effect is observed.
Finally, although this study was targeted specifically at insects, these species were chosen primarily as exemplars to introduce the technique to the biological community. Synchrotron x-ray phase contrast imaging is broadly applicable to any organism with features on the micron scale and above. However, we urge caution when explor-ing new systems with this technique; it is crucial to
under-Representative CO2 emission traces for the four species used in this study Figure 6
Representative CO2 emission traces for the four species used in this study. The x-ray beam (25 keV, 80 µW/mm2) was incident on the insect's head. No qualitative changes are seen immediately after beam on. A major change in CO2 emission
pattern after 1000–1500 s of x-ray exposure is marked by RS (respiratory signature). The RS was based on CO2 emission pat-terns and was corroborated with x-ray video behavioral data; the RS is a major change in CO2 release pattern associated with shaking of the head or mouthparts. For the grasshoppers (Schistocerca gregaria), no behavioral change was observed at RS.
Schistocerca gregaria
Platynus decentis
Camponotus pennsylvanicus
Drosophila virilis
0 200 400
0 500 1000 1500 2000 2500
CO
2 emission (µl/hr)
Time (s) Beam on
RS RS
RS
RS 0
50 100
0 20 40
stand the effects of the radiation on the organism when making biological interpretations.
Conclusion
Synchrotron x-ray phase contrast imaging shows great promise as a powerful new tool for internal visualization in biological and medical research. This is the only gener-ally applicable technique that has the necessary spatial and temporal resolutions, penetrating power, and sensi-tivity to soft tissue that is required to visualize the internal physiology of small living animals on a scale from millim-eters to microns. The impact of this technique is just beginning to be seen as it is applied to some of the more easily arranged experiments such as those on the respira-tory systems of insects, where it has already had a major impact. The discovery of rhythmic tracheal compressive movements in taxa in which it was previously unknown [6] has opened whole new areas of research, for example
those aimed at determining morphological mechanisms of compression and the role of associated convection in insect physiology and evolution. Another exciting possi-bility is the visualization of previously unknown, complex circulatory patterns within insects that have only been inferred before from changes in body surface temperature [34].
Current uses of the technique include the analysis of the rapidly moving internal mouthparts of biting insects and the visualization of fluid motion in the pumping organs of fluid feeding insects such as flies and butterflies. The ability to see inside the animal, including the internal workings of jaws, legs, and wing hinges, may be of signif-icant utility in the exploration of functional diversity. Although more challenging due to lower density differ-ences, this approach has also yielded impressive x-ray video of insect digestive (Figure 1e–l; see also Additional
Comparison of x-ray impact on two different regions of the insect body
Figure 7
Comparison of x-ray impact on two different regions of the insect body. Representative CO2 traces are from two different ant specimens (Camponotus pennsylvanicus) with the x-ray beam targeted on the abdomen (a) and the head (b). Even though the abdomen-irradiated ant (a) received a higher x-ray flux (80 vs. 36 µW/mm2), it showed no discernible changes in
CO2 emission pattern. In contrast, the head-irradiated ant (b) showed dramatic changes in CO2 emission, including a decrease
in variance leading up to the RS (at which point the head stopped moving) and a cyclic pattern of release (similar to DGC in decapitated ants [25, 26]) thereafter.
0 10 20 30 40 50 60
0 10 20 30 40 50 60 70
0 20 40 60 80 100 120 140 160 180
CO
2 emission (µl/hr)
Time (min) Abdomen
Head Beam on
RS (a)
files 2 and 3) and circulatory system function, including the pumping of the tiny pulsatile organs that maintain the internal pressure of the antennae of ants. The first syn-chrotron research on living vertebrate musculoskeletal systems has recently begun with successful video of the interior bones of the pharynx and skull during fish respi-ratory pumping. The potential for investigation of model systems in genetics and medicine such as fly, zebrafish, and mouse is considerable, as the natural and normal mechanisms of heart, circulatory, digestive, and locomo-tor systems can be analyzed in new ways and compared to mutants or disease models that may be used to study human health concerns. Ultimately, the ability to clearly visualize internal functions in small animals will have a large impact in both biology and medicine.
Methods
Synchrotron x-ray phase-contrast imaging
Experiments were performed at the 1ID and XOR-32ID undulator beamlines at the Advanced Photon Source (Figure 2). Synchrotron x-rays are produced here by a source with full-width half maximum dimensions of 35 µm (vertical) by 560 µm (horizontal) and source-to-sample distances of 60 m and 40 m, respectively. A Si (111) double crystal monochromator was used to select the x-ray wavelength. The incident beam flux (photons/s/ mm2) was changed by varying the undulator magnetic gap and was monitored with an upstream ion chamber. Insects were mounted on top of a remotely controlled stage that enabled precise positioning in the x-ray beam. After passing through the insect, the x-rays were converted to visible light via a cerium doped yttrium aluminum gar-net scintillator. The sample-to-scintillator distance was approximately 1 m; a distance of this magnitude is neces-sary for obtaining the phase-contrast effect. The visible light created by the scintillator was imaged onto a video camera (Cohu 4920 or Cohu 2700, Cohu, San Diego, CA, USA) or higher resolution CCD camera (SensiCam QE, Cooke, Romulus, MI, USA) using a 2× or 5× microscope objective. The field of view was 2.4 mm × 3.2 mm and 1.0 mm × 1.3 mm for the 2× and 5× objectives, respectively. Unlike most prior studies, the size of the x-ray beam was comparable to the size of the insect, and we only exposed parts of the insect to radiation.
Animals
We conducted the majority of our experiments on carpen-ter ant workers (Camponotus pennsylvanicus, n = 59), but also explored taxonomic diversity by examining beetles (Platynus decentis, n = 20), fruit flies (Drosophila virilis, n = 28), and grasshoppers (Schistocerca gregaria, n = 19). Ants and fruit flies were purchased from Carolina Biological Supply Company (NC, USA). Beetles were collected in the woods at Argonne National Laboratory, and grasshoppers were reared at one of the author's laboratory (JH). Insects
were housed with free access to food and water prior to experimentation.
Survivorship and behavior
To determine the length of time that insects could with-stand radiation on a particular part of the body (head, thorax, or abdomen), insects were monitored for CO2 release using flow-through respirometry while being observed with x-rays (Figure 2b). Insects were cold anaes-thetized and placed individually in custom plexiglass respirometry chambers (volumes: 0.03, 0.25, 1.0, and 9.5 ml) with Kapton (Dupont, DE, USA) windows for x-ray transmission (Figure 2c). Because some insects actively moved away from the beam upon contact, cotton was used to fill in gaps within the chamber to constrain the insect within the field of view. The chambers were ori-ented such that the long axis of the body lay perpendicular to the beam path, providing either lateral or dorsoventral views.
CO2 emission was monitored by a flow-through respirometry system from Sable Systems International (SSI, Las Vegas, NV, USA). Room air was scrubbed of CO2 and H2O using a Drierite/Ascarite/Drierite column and pushed through the system using a pump (TR-SS3, SSI). Flow rate (100 ml/min for all species except D. virilis, 50 ml/min) was maintained via a mass flow controller (SSI MFC-2 using a Sierra Instruments mass flow control valve). CO2 exiting the insect chamber was measured by a gas analyzer (LI-7000, Li-Cor, Lincoln, NE, USA). Cham-ber washout times were on the order of 6–12 s. CO2 data were output to a computer via UI-2 (SSI) and recorded using ExpeData software (SSI). Pre-beam CO2 emission was typically recorded for 5–10 minutes before opening the x-ray shutter. For survivorship trials, insects were exposed to x-rays on the head, thorax, or abdomen until they clearly showed a respiratory signature that we infer to be respiratory function damage; otherwise, trials were ended after 2 hrs. CO2 emission was also monitored post-beam for up to 30 minutes. For behavioral trials, the insects were exposed for a fixed amount of time, then removed from the chamber and tested for the presence/ absence of righting behavior, defensive behavior, and locomotor ability. All trials were conducted at room tem-perature (21–22°C). Data were analyzed using ExpeData and LabAnalyst X (Mark Chappell, University of Califor-nia Riverside, CA, USA) software packages.
Feeding
place by securing the body to a microscope cover slip (beetles) or by a mounted clamp attached to the wings (butterflies). These examples illustrate the use of contrast agents to visualize internal food transport. The fine parti-cles of CdWO4 had a significantly higher absorption over the entire x-ray energy range used in this study and appeared darker than the surrounding soft tissue. In the case of the iodine solution, differences in x-ray absorption at the nominal setting (25 keV) were minimal. To maxi-mize contrast between the iodine and the surrounding anatomy, we used an energy just above the K-absorption edge (33.2 keV for iodine), where absorption increased dramatically. Because in general the use of higher energy x-rays results in an overall lower contrast for soft tissue (Figure 3), this technique is most applicable for cases where it is more important to track internal movements of food than to visualize clearly the surrounding insect anat-omy. The use of simultaneous x-ray images above and below the K-edge to improve visualization of the contrast agent is possible, but would require a more complicated set of x-ray optics. Furthermore, it would imply a dou-bling of the x-ray dose to the animal.
For contrast agents, iodine is more suitable for fluids whereas CdWO4 is more suitable for solids. Although we have not investigated the toxicity of iodine versus CdWO4 in insects, we speculate that iodine is less harmful because Isovue is used for human medical diagnosis, and it is well known that cadmium is toxic [35]. We chose a cadmium compound for its convenience, but other high electron density materials in powder form (such as silica or lead) can be used to provide radio-opacity with lower toxicity.
Temperature
Possible change in temperature in the insect due to the absorption of x-rays was measured separately with two methods. First, an implanted 0.01 mm copper-constantan thermocouple and thermocouple thermometer (0.1 K res-olution, Physitemp Instruments, Inc., NY, USA) were used to measure internal abdominal temperature in an adult grasshopper (Schistocerca gregaria) while it was irradiated for up to 10 minutes on the thorax. To test if local heating occurred at the site of irradiation, an infrared camera (Inframetrics 760, 0.1 K resolution, American Infrared, NY, USA) was used to visualize temperature change in the head of three beetles (Platynus decentis) and one grasshop-per (Schistocerca gregaria).
Data analysis
We used two metrics to quantify the effect of the x-rays on the CO2 emission patterns. To assess immediate effects of the beam, we compared CO2 emission rates in the 2 min-utes before 'beam on' to those 2 minmin-utes after 'beam on' (Equation 2). We defined the ratio (R2 min) as:
where 冬Epre-beam冭2 min and 冬Ebeam-on冭2 min are, respectively, the
CO2 emission rates (µl/hr) averaged over the 2 minutes immediately prior and after the x-rays (25 keV) were turned on. Second, to assess the duration required for damage to occur due to x-rays, we identified a major change in the CO2 emission pattern within each species, which we refer to as the respiratory signature (RS; Figure 6). The RS was chosen for its repeatability; by the time of the RS, major (and likely irreversible) damage has occurred. This time interval, between when the beam first hit the insect and the RS, is the time to respiratory signa-ture (TTRS).
Image quality and the corresponding photon fluxes and average power densities for 25 keV x-rays used in this study are shown in Figure 4. The incident photon fluxes were chosen for an approximate factor of two change in intensity between each setting. At 25 keV, a 1-mm thick water sample (over the entire beam area) would absorb about 3% of the incident beam energy [36]. Absorbed power for a volume of insect that is irradiated can thus be estimated by Equation 3:
Absorbed power = 0.03 × D × V (3)
where D is the incident beam power density (µW/mm2) and V is the irradiated volume in mm3. Assuming an inci-dent power density of 80 µW/mm2 and an ant head of vol-ume 3 mm3, the estimated absorbed power is 7.2 µW and the absorbed dose rate (absorbed power per unit mass) is 2.4 Gy/s. X-ray absorbed powers were measured for each species (Table 1); these values are consistent with the the-oretical estimates.
Metabolic rate calculations were based on averages of all available prebeam CO2 recordings for each of the four spe-cies. Conversion from CO2 output to metabolic rate assumed respiratory quotients (RQ) of 1.0, 0.8, 0.7, and 1.0 and energy equivalences of 20.1, 24.5, 27.6 and 21.2 J/ml of CO2 for grasshoppers [37], beetles [38], ants [39], and fruit flies [40], respectively.
Abbreviations
DGC, discontinuous gas exchange
D, incident beam power density
d, sample-detector distance
E, x-ray energy
R E
E
beam on
pre beam
2 2
2
2
min min
min
= −
( )
Iinc, incident beam intensity
L, source-sample distance
λ, x-ray wavelength
ρ, sample density
RQ, respiratory quotient
RS, respiratory signal
R(x,y), effective detector resolution
σs, source size
TTRS, time to respiratory signal
V, volume
x-y, image plane
z, beam direction
Competing interests
The authors declare that they have no competing interests.
Authors' contributions
The scope of this paper was conceived by all authors. JS and JW collected most of the data. JS and WKL performed the analyses. JS and WKL drafted the manuscript, and JH and MW contributed to the writing. All authors read and approved the final manuscript.
Additional material
Additional File 1
Rhythmic compressive movements in the tracheal system in the cara-bid beetle Platynus decentis, demonstrating the utility of phase-con-trast synchrotron imaging for studies of respiratory dynamics in small animals. View (1.3 × 1.0 mm) is a dorsoventral projection through pro-thorax of a beetle (mass ~ 45 mg) using monochromatic x-rays (25 keV). The midline of the beetle lies on the right side of the video between the two coxae (large circular structures, bottom right). Collapse and reinflation of the air-filled tracheal tubes can be seen in the majority of the tubes in view. The smallest tracheal tubes that can be seen are about 10 µm in diameter; tracheoles (<1 µm diameter) are too small to be resolved. The circle and dark opaque spots the upper right are an air bubble and particles in the esophagus, respectively; note that they move anteriorly and posteri-orly during the compression of the tracheal tubes. The white and dark spots that do not move with the beetle movement are artifacts due to the inci-dent beam and detector system.
Click here for file
[http://www.biomedcentral.com/content/supplementary/1741-7007-5-6-S1.mov]
Table 2: Effect of duration of x-ray exposure to head on motor control abilities. m/n denotes m animals behaving normally out of n animal trials. Asterisks denote partially limited response (e.g., slow response).
Exposure time (min) with 25 keV x-rays, 80 µW/mm2
Species Behavior 2 4 5 6 8 10 12 15 25 120+
Ant Righting 2/2 2/2 1/2 1*/2 2*/2 1*/2
Defense 2/2 2/2 1/2 1/2 1*/2 1*/2
Walking 2/2 2/2 2*/2 1*/2 0/2 0/2
Fruit fly Righting 1/1 2/2 2/2 2/2 0/2 1*/2
Walking 1/1 2/2 2*/2 2*/2 0/2 1*/2
Flight 1/1 2/2 2/2 2/2 0/2 1*/2
Beetle Righting 1/1 1/1 0/1 0/1
Walking 1/1 1*/1 1*/1 0/1
Running 1/1 1*/1 0/1 0/1
Grasshopper Righting 2/2
Hopping 2/2
Acknowledgements
We thank Kamel Fezzaa and Aaron Rice with help in collecting data, John Lighton, Barbara Joos, and Robbin Turner of Sable Systems International (SSI) for assistance with respirometry equipment, Kendra Greenlee for help with the thermocouple thermometry, and Jim Liebherr for help with iden-tification of beetle internal anatomy. Use of the Advanced Photon Source was supported by the U. S. Department of Energy, Office of Science, Office of Basic Energy Sciences, under Contract No. W-31-109-ENG-38. Harri-son's work at ANL was supported by NSF IBN-9985857 and IBN 0419704.
References
1. Ridgway C, Chambers J: Detection of insects inside wheat ker-nels by NIR imaging. J Near Infrared Spectroscopy 1998, 6:115-119. 2. Hart AG, Bowtell RW, Kockenberger W, Wenseleers T, Ratnieks FLW: Magnetic resonance imaging in entomology: a critical review. J Insect Sci 2003, 3:5.
3. Harris RA, Follett DH, Halliwell M, Wells PNT: Ultimate limits in ultrasonic imaging resolution. Ultrasound Med Biol 1991,
17:547-558.
4. Cloetens P, Barrett R, Baruchel J, Guigay JP, Schlenker M: Phase objects in synchrotron radiation hard x-ray imaging. J Phys D: App Phys 1996, 29:133-146.
5. Snigirev A, Snigireva I, Kohn V, Kuznetsov S, Schelokov I: On the possibilities of x-ray phase contrast microimaging by coher-ent high-energy synchrotron radiation. Rev Sci Inst 1995,
66:5486-5492.
6. Westneat MW, Betz O, Blob RW, Fezzaa K, Cooper WJ, Lee WK:
Tracheal respiration in insects visualized with synchrotron x-ray imaging. Science 2003, 299:558-560.
7. Herford GM: Tracheal pulsation in the flea. J Exp Biol 1938,
15:327-338.
8. Cowley JM: Diffraction Physics Third edition. Amsterdam: Elsevier; 1995.
9. Grosch DS: Entomological aspects of radiation as related to genetics and physiology. Ann Rev Entomol 1962, 7:81-106. 10. Megumi T, Gamo S, Ohonishi T, Tanaka Y: Induction of
leg-shak-ing, knock-down and killing responses by gamma-ray irradi-ation in Shaker mutants of Drosophila melanogaster. J Rad Res
1995, 36:134-142.
11. Grosch DS: Induced lethargy and the radiation control of insects. J Econ Entomol 1956, 49:629-631.
12. Heidenthal G: The occurrence of x-ray induced dominant lethal mutations in Habrobracon. Genetics 1945, 30:197-205. 13. King RC, Wilson LP: Studies of the radiation syndrome in
Dro-sophila melanogaster. Rad Res 1955, 2:544-555.
14. Bakri A, Heather N, Hendrichs J, Ferris I: Fifty years of radiation biology in entomology: Lessons learned from IDIDAS. Ann Entomol Soc Am 2005, 98:1-12.
15. Allen RG, Sohal RS: Life-lengthening effects of gamma radia-tion on the adult housefly, Musca domestica. Mech Age Dev
1982, 20:369-375.
16. Baldwin WF, Salthouse TN: Latent radiation damage and syn-chronous cell division in the epidermis of an insect. I. Nonre-versible effects leading to local radiation burns. Rad Res 1959,
10:387-396.
17. Baldwin WF, Sutherland JB: Extreme sensitivity to low-level X-rays in the eye of the cockroach Blaberus. Rad Res 1965,
24:513-518.
18. Lee WR: Partial body radiation of queen honeybee. J Apic Res
1964, 3:113-116.
19. Pijnacker LP: Effects of X-rays on different meiotic stages of oocytes in the parthenogenetic stick insect Carausius moro-sus Br. Mut Res 1971, 13:251-262.
20. Lighton JRB, Turner RJ: Thermolimit respirometry: an objec-tive assessment of critical thermal maxima in two sympatric desert harvester ants, Pogonomyrmex rugosus and P. californi-cus. J Exp Biol 2004, 207:1903-1913.
21. Lighton JRB: Discontinuous gas exchange in insects. Ann Rev Entomol 1996, 41:309-324.
22. Miller PL: The regulation of breathing in insects. In Advances in Insect PhysiologyVolume 3. Edited by: Beament JWL, Treherne JE, Wig-glesworth VB. London and New York: Academic Press; 1966:279-354.
23. Cheng CC, Ducoff HS: High-dose mode of death in Tribolium. Entomol Exp App 1989, 51:189-197.
24. Marais E, Klok CJ, Terblanche JS, Chown SL: Insect gas exchange patterns: a phylogenetic perspective. J Exp Biol 2005,
208:4495-4507.
25. Lighton JRB: Direct measurement of mass loss during discon-tinuous ventilation in two species of ants. J Exp Biol 1992,
173:289-293.
26. Lighton JRB, Fukushi T, Wehner R: Ventilation in Cataglyphis bicolor : regulation of carbon dioxide release from the tho-racic and abdominal spiracles. J Insect Phys 1993, 39:687-699. 27. Ducoff HS: Causes of death in irradiated adult insects. Biol Rev
Cam Phil Soc 1972, 47:211-240.
28. Pribush A, Agam G, Yermiahu T, Dvilansky A, Meyerstein D, Meyer-stein N: Radiation damage to the erythrocyte membrane – the effects of medium and cell concentrations. Free Rad Res
1994, 21:135-146.
29. Edwards AA, Lloyd DC: Risks from ionising radiation: deter-ministic effects. J Rad Protn 1998, 18:175-183.
30. Gal R, Libersat F: New vistas on the initiation and maintenance of insect motor behaviors revealed by specific lesions of the head ganglia. J Comp Phys A: Neur Sens Neur Behav Phys 2006,
192:1003-1020.
31. Ridgel AL, Ritzmann RE: Effects of neck and circumoesophageal connective lesions on posture and locomotion in the cock-roach. J Comp Phys A: Neur Sens Neur Behav Phys 2005, 191:559-573. 32. Burrows M: The Neurobiology of an Insect Brain New York: Oxford
University Press; 1996.
Additional file 2
Passage of food bolus through the esophagus of the butterfly Pieris rapae. View (1.3 × 1.0 mm) is a lateral projection through the thorax of the butterfly (mass ~50 mg), with food moving from anterior (upper right) to posterior (lower left). The butterfly was feeding on a mixture of sugar water and iodine compound (Isovue). X-ray energy (33.2 keV) was tuned just above the K-edge for iodine, making the food bolus appear dark. This clip demonstrates how synchrotron imaging can be used to visualize internal food transport during feeding in small animals. Note that the esophagus is collapsed until the bolus passes through; the light structure running along the same diagonal axis is a tracheal tube. From this clip, it can be seen that the bolus is tapered at both ends and is transported at a speed of ~1.5 mm/s.
Click here for file
[http://www.biomedcentral.com/content/supplementary/1741-7007-5-6-S2.mov]
Additional file 3
Movements of the foregut and gut contents of the carabid beetle Pter-ostichus stygicus. View (3.3 × 2.5 mm) is a dorsoventral projection through the pterothorax, posterior to the mesocoxae (circular structures seen at top of image). The beetle (mass ~210 mg) was fed macerated larva sprinkled with cadmium powder to increase x-ray (25 keV) absorption contrast; the gut boundaries and food movement can only be seen in places with cadmium powder. In this sequence, the crop (bag-like structure, center left) is squeezed anteriorly and then slowly settles back into its ini-tial orientation. Mixing movements and peristalsis of the proventriculus (cylindrical structure, right side) can also be seen. Note that the proven-triculus is closed, preventing food from moving posteriorly into the midgut. Dark bands on the left side of the video are artifacts from the incident beam.
Click here for file
Publish with BioMed Central and every scientist can read your work free of charge
"BioMed Central will be the most significant development for disseminating the results of biomedical researc h in our lifetime."
Sir Paul Nurse, Cancer Research UK
Your research papers will be:
available free of charge to the entire biomedical community
peer reviewed and published immediately upon acceptance
cited in PubMed and archived on PubMed Central
yours — you keep the copyright
Submit your manuscript here:
http://www.biomedcentral.com/info/publishing_adv.asp
BioMedcentral
33. Gruner SM, Tate MW, Eikenberry EF: Charge-coupled device area x-ray detectors. Rev Sci Inst 2002, 73:2815-2842.
34. Wasserthal LT: Interaction of circulation and tracheal ventila-tion in holometabolous insects. In Advances in Insect Physiology
Edited by: Evans PD. San Diego: Academic Press; 1996:298-351. 35. Occupational Safety and Health Administration 1996 [http://
www.osha.gov/].
36. Hubbel JH, Seltzer SM: Tables of X-ray Mass Attenuation Coef-ficients and Mass Energy-Absorption CoefCoef-ficients 1 keV to 20 MeV for Elements Z = 1 to 92 and 48 Additional Substances of Dosimetric Interest. Nat Inst Stand 1995. NISTIR 5632. 37. Greenlee KJ, Harrison JF: Development of respiratory function
in the American locust Schistocerca americana I. Across-instar effects. J Exp Biol 2004, 207:497-508.
38. Schmidt-Nielsen K: Animal Physiology: Adaptation and Environment 2nd edition. Cambridge: Cambridge University Press; 1980.
39. Lighton JRB, Wehner R: Ventilation and respiratory metabo-lism in the thermophilic desert ant, Cataglyphis bicolor (Hymenoptera, Formicidae). J Comp Phys B: Biochem Syst Env Phys
1993, 163:11-17.
40. Van Voorhies WA, Khazaeli AA, Curtsinger JW: Long-lived Dro-sophila melanogaster lines exhibit normal metabolic rates. J App Phys 2003, 95:2605-2613.