ScholarWorks@UNO
ScholarWorks@UNO
University of New Orleans Theses and
Dissertations Dissertations and Theses
Spring 5-13-2016
The origin and expansion of the eastern red fox
The origin and expansion of the eastern red fox
Adrienne Egge Kasprowicz
University of New Orleans, New Orleans, [email protected]
Follow this and additional works at: https://scholarworks.uno.edu/td
Part of the Animal Studies Commons, Biodiversity Commons, Evolution Commons, Geographic Information Sciences Commons, Other Ecology and Evolutionary Biology Commons, Population Biology Commons, and the Zoology Commons
Recommended Citation Recommended Citation
Kasprowicz, Adrienne Egge, "The origin and expansion of the eastern red fox" (2016). University of New Orleans Theses and Dissertations. 2143.
https://scholarworks.uno.edu/td/2143
This Dissertation-Restricted is protected by copyright and/or related rights. It has been brought to you by ScholarWorks@UNO with permission from the rights-holder(s). You are free to use this Dissertation-Restricted in any way that is permitted by the copyright and related rights legislation that applies to your use. For other uses you need to obtain permission from the rights-holder(s) directly, unless additional rights are indicated by a Creative Commons license in the record and/or on the work itself.
This Dissertation-Restricted has been accepted for inclusion in University of New Orleans Theses and Dissertations by an authorized administrator of ScholarWorks@UNO. For more information, please contact
A Dissertation
Submitted to the Graduate Faculty of the University of New Orleans
in partial fulfillment of the requirements for the degree of
Doctor of Philosophy in
Conservation Biology
by
Adrienne Egge Kasprowicz B.S. University of Virginia, 2008
ii
I wish to recognize and thank several people without whom this road would have been much more difficult. First and foremost, I’d like to thank my family who have been a source of encouragement, insight, and occasionally manual labor. To Eric, you have helped form the person I have become, and I am infinitely better for it.
I would also like to thank my committee member, Dr. Ben Sacks, and his entire lab, especially Dr. Mark Statham. Thank you for giving me your insight, experience, lab space, significant edits, and most of all your patience.
There would not have been samples to analyze if not for all of the trappers and wildlife officials who contributed to this study, especially C. Bernier of the Vermont Department of Fish and Wildlife and Scott Smith at the New York Department of Environmental Conservation, and TrapperMan.com.
Thank you to the members of my committee, each of whom has ensured a well-rounded education in conservation. Dr. Howard taught me ecology, behavior, and an infinite pool of fun animal facts. Dr. Anthony introduced the techniques of population genetics and theories of conservation management, the foundations for a conservationist. Dr. Bell completely changed my attitude and understanding of phylogenetics and
iii
List of Tables ... vi
Abstract ... vii
Chapter One – Introduction ...1
Invasive species ...2
Population growth and expansion ...3
Introductions and invasions ...4
Natural range expansion ...4
Hybridization and admixture ...5
Molecular markers ...6
Red foxes in North America ...9
Research goals and questions...11
Literature Cited ...13
Chapter Two – Fate of the other redcoat: remnants of colonial British foxes in the Eastern United States ...19
Abstract ...20
Introduction ...21
Materials and Methods ...24
Study area and sample collection ...24
Data Analyses ...27
Results ...30
Origins of eastern red fox lineages ...30
Geographic patterns ...33
Discussion ...39
Acknowledgements ...43
Literature Cited ...44
Appendix ...48
Chapter Three – History of the native red fox in the eastern United States: identifying the impacts of spatial expansion and translocation on the structure of a mobile generalist ...49
Abstract ...50
Introduction ...51
Methods ...54
Sample Collection and markers ...54
Population differentiation ...56
Expansion ...58
Impact of the Appalachian Mountain Range ...58
Landscape Resistance ...59
Results ...59
Summary Statistics...59
Population Structure...60
iv
Expansion and Admixture ...70
The Appalachian Mountains ...71
Conclusions ...75
Acknowledgements ...75
Literature cited ...76
Appendix ...80
Chapter Four – The extent of European introgression in native red fox populations based on nuclear markers ...81
Introduction ...82
Methods ...84
Sampling ...84
Genotyping ...85
Population statistics ...85
Source of nuclear genome ...86
Introduced admixture ...86
Results ...87
Summary statistics ...87
Genetic structure and differentiation ...88
Discussion ...94
Literature Cited ...97
Chapter Five – Conclusions ...100
Literature Cited ...108
Appendix ...110
v
Figure 2.1 Map of the study area and locations of red fox samples ...25
Figure 2.2Maximum likelihood tree of 697-bp concatenated cytochrome-b and control-region sequences from red foxes of the Eastern United States ...30
Figure 2.3 Median-joining network of 19 haplotypes composed of microsatellite loci linked on the Y chromosome ...33 Figure 2.4 Geographic distribution of mitochondrial haplotypes of 569 modern red foxes (top left) and 14 historically sampled red foxes (top right) Lower left: Median-joining network of 697-bp mitochondrial sequences ...37
Figure 3.1 Map of sample locations in study area ...55 Figure 3.2 Graphs of ln P(D) and ΔK ...61
Figure 3.3 Bar plots from Structure analysis for K = 2 – 10 with and without location priors ...62
Figure 3.4 Colored SAMOVA table ...63 Figure 3.5 Principal Coordinates Analysis of individuals by population ...66
Figure 3.6 Graphs of relationship between genetic distance and geographic distance and allelic richness versus Euclidean distance from VT ...68
Figure 3.7 Graph of genetic distance versus resistance distance ...69 Figure 3.8 Bar plot of microsatellite population assignment and mitochondrial haplotype assignment...74 Figure 4.1 Bar plot of population assignment with source populations at K = 2 and K = 3 ...90 Figure 4.2 Graphs of ln P(D) and ΔK ...92
vi
Table 2.1 Distribution of mitochondrial haplotypes across modern and historical
sampling locations ...31
Table 2.2 Haplotype diversity and distribution of Y-chromosome haplotypes ...35
Table 2.3 Indices of genetic diversity based on mtDNA in sample locations ...36
Table 2.4 Results of SAMOVA based on K = 1 – 6 ...38
Table 2.5 Pairwise population comparisons using ΦST and FST ...38
Table 3.1 Summary statistics of μsat diversity across sampling locations ...60
Table 3.2 Results of AMOVA’s based on a priori information ...64
Table 3.3 Pairwise genetic distance between locations based on Nei’s DA and FST ...65
Table 4.1 Population statistics for pooled sample locations and source locations ...88
Table 4.2 Pairwise population comparisons between pooled sample locations and source locations ...88
Table 4.3 Pairwise population comparisons between individual sample locations and source locations ...89
Table 4.4 Results of AMOVA’s based on a priori hypotheses ...91
vii
When new populations are first identified in a region there are multiple potential sources:
introduction of a non-native species, extra-range expansion of a nearby population, or demographic growth of a previously unnoticed species. Red foxes were absent or rare in the
mid-eastern portion United States until the late 1800s. Their origins potentially include natural population increase/expansion, translocations from Europe, and, eventually, 20th century fur farming. In this study I attempt to identify the relative impact of native expansion versus human
mediated introductions of both colonial era European foxes and early 20th century fur-farm foxes on the establishment of red foxes in the mid-Atlantic region of the United States. I subsequently
address the potential impacts of hybridization and nuclear introgression between previously separate sister taxa. Through analysis of mitochondrial DNA, I identified indigenous haplotypes, two European haplotypes, and fur-farm haplotypes; another set of haplotypes were potentially
indigenous or native. In addition, I found European Y-chromosome haplotypes. Most European and fur-farm haplotypes were found near the densely human-populated coastal plain and Hudson
River lowlands; most red foxes of the Appalachians and Piedmont had native eastern haplotypes. However, nuclear data does not support this division showing low genetic structure despite the broad geographic scale of our study area, attributable both to range expansion and admixture.
Admixture has not had the same impact on the nuclear genome as it has in mitochondrial haplotypes leading to mito-nuclear discordance across the region. I also found evidence for
differential patterns of expansion related to habitat. Specifically, the Appalachian Mountains acted as a corridor for gene flow from the northern native source into the southern Mid-Atlantic region.
1
Chapter 1
2 Invasive species
Humans have affected the environment in various ways. Among the most impactful of
these is the redistribution of species. Species that have spread into novel environments either from an introduction site or a nearby habitat are considered “invasive alien species” (IAS) and
can severely threaten native flora and fauna (Richardson et al 2011). The establishment of these species is cited as a leading cause of biodiversity decline (Genton et al 2005; Ricciardi 2007; Kirk et al 2011; LeRoux et al 2011). In addition, a 2005 study estimated IAS cause $120 billion
in annual losses in the United States (Pimental et al 2005). Though this estimate could be considered spurious and does not include the benefits of certain IAS (i.e. European honeybees),
it demonstrates the magnitude of the impact (Pejar and Mooney, 2009). In addition to
transcontinental introductions, humans have affected the distribution of native species through habitat conversion resulting in range expansions. Spatial expansion is the extension of a
population into an area that was previously uninhabited by that population. Expansions can occur naturally along an environmental gradient or follow the artificial introductions of
individuals into new habitats (Estoup et al 2004). For some species, particularly vertebrates, successful range expansion is strongly associated with humans (Sakei et al 2001).
Although biological invasions and expansions are not uniquely caused by humans,
modern rates of each are several orders of magnitude greater than prehistoric rates (Allendorf and Lundquist 2003; Ricciardi 2007; Wilson et al 2009; Richardson et al 2011). Whereas
historical invasions are the result of infrequent, long-distance dispersal, human globalization has increased frequency and effectively decreased the difficulty imposed by long distance dispersal. International commerce has facilitated the spread and distribution of millions of individuals
3
purposes or unintentional such as through ballast water in marine transport. The result is the buildup of invasive potential that can increase the likelihood of an introduction turning into an
invasion. European colonization of the Americas brought with it massive changes in the land, which in turn altered the relative abundances and community composition of species (Pimm et al
1995).
New populations of species, whether they are from introductions or natural expansions, can significantly impact the evolutionary pathway of native species through competitive
exclusion, niche displacement, hybridization, introgression, predation, and extinction (Mooney and Cleland 2001). While the unprecedented rate of invasion poses threats to native biota, it also
creates opportunities to study ecological and evolutionary theories (Allendorf and Lundquist 2003). Molecular analyses of IAS allow researchers to understand mechanisms of growth and population dynamics (Richardson et al 2011). We can study the relationship between genetic
diversity at onset of introductions versus performance. In addition, we can examine molecular evolution in the face of hybridization. Finally, comparing introduction histories and success can
yield biogeographical insights important for understanding impacts of climate change (LeRoux et al 2011; Moran and Alexander 2014).
Population growth and expansion
When populations expand, either from a source population or from introduced colonies,
they face genetic bottlenecks because a limited sampling of the population is relocating
(Allendorf and Lundquist 2003). This, in turn, is expected to create patches of lower diversity. However, low diversity is rarely a characteristic of successful invaders (Parker et al 2013). Strict
4
structure (Ray et al 2003, Excoffier 2004). These consequences vary from the creation of sectors of lower genetic diversity to high frequency of random alleles due to genetic surfing (Excoffier
et al 2009). Both carry different genetic signatures that make it possible to distinguish between them.
In successful invaders, reduced genetic variability due to low heterozygosity is often overcome by repeat introductions from different source populations (Sakei et al 2001; Kowarik 2003; Allendorf and Lundquist 2003; Le Roux et al 2011). This can often times cause higher
diversity in newly founded populations than in the source populations and strong differentiation if independent introductions occur across a landscape. Newly founded populations with higher
genetic diversity are less likely to go extinct because they are more able to evolve adaptive traits necessary to survive in the new environment (Agash et al 2011). Furthermore, bottlenecks can purge deleterious recessive alleles thus reducing inbreeding depression (Moran and Alexander
2014). Invasive populations also benefit from low population density allowing for exponential growth. The effects of drift and selection are likely to vary between colonies and while
long-distance dispersal events across the landscape can facilitate gene flow between colonies, strong differentiation between colonies with high heterozygosity and gene diversity is expected.
Natural range expansions most often occur in a stepwise pattern with genetic
differentiation increasing from the source (Schrey et al 2014). The result then is a series of founder effects along the expansion front and reduction in average heterozygosity (Slatkin and
Excoffier 2012). Genetic drift in these colonies reduces overall allelic diversity along the axis of the expansion front, but also increases the frequency of some rare alleles, a process dubbed ‘gene
surfing’ (Excoffier and Ray 2008; Hallatschek and Nelson 2008). Essentially, alleles on the
5
size allows genetic drift to drive some alleles that were rare in the original population to high frequencies. Reduced intraspecific competition from low population density then allows these
few individuals to increase exponentially, also increasing the frequencies of those alleles. When colonization is the result of long distance dispersal events, gene surfing can cause increasing
genetic differentiation of populations along the expansion front from the source population (Hallatschek and Nelson 2008). The result is still clinal variation with increasing differentiation from the source population. While strong gene flow between the colonies can erase some of the
differentiation, reduced gene flow to and from the source population will maintain discrete differentiation between the source and new portion of the range (Hagen et al 2015; Norén et al
2015).
Hybridization and admixture
As populations expand and previously isolated lineages come into contact with one another, hybridization and admixture can occur. This type of genetic restructuring can have
positive and negative effects. The extinction of native genotypes and disruption of local adaptations can limit a species ability to thrive in its habitat or tolerate environmental shifts. If the introduced population is the result of human breeding, it may introduce traits that were bred
for anthropogenic existence and be detrimental in the wild (Kidd et al 2009; Dierking et al 2014). Indeed, human induced hybridizations have contributed to the decline and extinction of many
plant and animal species (Kovach et al 2015). Additionally, the global redistribution of species and subsequent admixture of genes continues the homogenization of Earth’s biota.
However, hybridization and admixture can benefit populations. The introduction of new
6
the existing population. Hybridization may contribute to speciation by creating new hybrid taxa, or promoting adaptive divergence thereby facilitating speciation (Abbott et al 2013). It is also
important to consider the extent to which hybridization and introgression occurs naturally. It is estimated 10-30% of multicellular plant and animal species regularly hybridize (Mallet, 2005).
The impacts of hybridization and subsequent admixture are varied and investigation into the degree to which sister taxa do interbreed furthers our evolutionary understanding and provides insights for management.
Molecular markers
Because range expansion and non-native introductions can generate distinct geographic patterns of genetic diversity, use of multiple genetic markers can help to differentiate these demographic processes (Hagen et al 2015; Norén et al 2015). Additionally, advances in
population genetics now allow better resolution of taxonomic issues, elucidate geographic origins of invaders, track dispersal, and detect admixture (Kirk et al 2011). Furthermore,
improvements in technology result in more efficient and cheaper techniques (Geraldes et al 2008; Peres-Espona et al 2010; Chang et al 2011; Sastre et al 2011). It is particularly important when studying populations that are either recently derived or have a likelihood of admixture to
perform a comprehensive, multiple gene analysis that includes mitochondrial and nuclear loci (Geraldes et al 2008).
Mitochondrial DNA has been used for determining historical patterns of population structure and population origins since Avise and Ellis (1986) introduced it as a molecular marker. Since then it has revolutionized phylogeography by allowing examination of
7
which makes it ideal for phylogenetic analysis. First, it rapidly evolves through base
substitutions making it easy to track changes through lineages (Avise et al 1989). Despite its
rapid evolution it is highly conserved in size, content and arrangement allowing inter and intraspecific comparison (Avise and Ellis, 1986). Mitochondrial DNA is maternally inherited
meaning it is effectively haploid, non-recombining, and can trace a single maternal lineage (Avise and Ellis, 1986; Avise et al 1987). Several successful phylogenetic studies have been performed on red foxes using mitochondrial DNA. The two markers most frequently used are
the cytochrome b gene and the D-loop control region (Frati et al 1998; Inoue et al 2007; Aubry et al 2009, Statham et al 2012, 2014; Teacher et al 2011)). Given their nearly global distribution
red foxes provide an interesting model for phylogeographic analysis. .
The Y-chromosome is somewhat unexplored in population studies outside of model organisms. This is because it can be very difficult to isolate markers (Petit et al 2002; Greminger
et al 2010). However, it has the potential to be as significant in population studies as
mitochondrial DNA. The mammalian non-recombining Y region (NRY) on the Y-chromosome
is analogous to mtDNA in that is present as a single copy within the cell and lacks recombination (Greminger et al 2010). While this creates a potentially useful marker for studying paternal lineages, there are several road blocks limiting its’ use. During analysis, Y-markers tend to have
lower genetic diversity because they are haploid and have a smaller expected effective
population size (Wandeler and Camensich 2011). Mutation rates are higher than in the rest of
the genome because of the accumulation or replication errors during gametogenesis (Greminger et al 2010). Higher mutation rates mean that the Y-chromosome is faster evolving and since it does not recombine it provides a paternal measure of gene flow (Clare 2011). In most
8
comprehensive view of demographic history. Since the focus of this project is on the recent history of red foxes in North America, Y-chromosomal data is expected to be more informative
than mitochondrial data.
Several types of markers can be isolated from the Y-chromosome including single
nucleotide polymorphisms (SNPs) and microsatellite repeat motifs. Each of these markers can give different information regarding population histories. However, microsatellites are better for identifying intra-species variation and Y-microsatellites can be incorporated to existing
genotyping for autosomal microsatellites (Wandeler and Camensich 2011). While these markers may be more difficult to isolate than their autosomal counterparts, fewer are necessary to
describe paternal genetic diversity (Greminger et al 2010). For example, only two diagnostics SNPs were necessary to show the extent of admixture between two subspecies of rabbits (Geraldes et al 2008).
The most popular marker for population genetics analyses are microsatellites because they are multi-allelic, co-dominant, abundant, reproducible, have a characteristic mutational
behavior, and can be used in high-throughput genotyping (Kelkar et al 2010; Guichoux et al 2011). Traditionally microsatellites have been used to study contemporary admixture but because of recombination it is difficult to use them to look at historical admixture.
Microsatellites are still a popular marker in population analyses and are useful for looking at current gene flow (Kelkar et al 2010). They promote detection of low levels of introgression and
9 Red Foxes in North America
In North America there are at least nine subspecies of Vulpes vulpes, eight of which are
endemic: V.v. alascensis, V.v. abietorum, V.v. regalis, V.v.rubricosa, V.v. macroura, V.v. cascadensis, V.v. necator, and V.v. patwin (Churcher 1959; Aubry 1983; Kamler & Ballard
2002, Aubry et al 2009, Sacks et al 2010). Vulpes v. macrura, cascadensis and necator are found in the western mountains of the United States, namely the Rocky, Cascade, and Sierra Nevada Mountains, respectively (Aubry 1983, Kamler and Ballard 2002). The Sacramento
Valley red fox, V.v.patwin, was recently identified as distinct (Sacks, 2010). The remaining four are found in the boreal forests of Alaska and Canada with V.v rubriscosa found in Central and
Eastern Canada (Kamler and Ballard, 2002).
Red foxes initially colonized North America during the Illinoian Glaciation via the Bering Land Bridge between 300,000 and 100,000 years before present. They expanded during
the Sangamon interglacial period throughout the western United States and Canada but were isolated during the Wisconsin glacial period (Aubry et al 2009). At the time of European
colonization red foxes were primarily a boreo-montane species found in the western mountains of the United States, in Alaska, and in Central and Eastern Canada (Churcher, 1959; Kamler and Ballard, 2002; Aubry et al 2009; Statham et al 2012). They were believed to occur above
40-45oN latitude and were “scarce or absent from the unbroken mixed hardwood” where grey foxes occurred (Churcher, 1959). However, discoveries of late-Holocene faunal sites along the
10
The spread of agriculture and habitat change coincided with the appearance of red foxes south of Pennsylvania (Audubon and Bachman 1849; Rhodes 1908; Churcher 1959). The
changing habitat allowed the red fox to partially displace the native grey fox in the southern portion of the continent (Churcher 1959). Concurrently, red foxes were reported to have been
introduced into the colonies from Europe for sport hunting with the earliest introductions into New York, Pennsylvania and Virginia in the mid-18th century from Scandinavia, France, and Great Britain. (Kamler and Ballard 2002). They were said to have been introduced specifically
due to the paucity of natural populations (Churcher 1959). From then on it was assumed that the red foxes now seen in the former southern colonies were European in origin, or at the most “a mongrel species” (Rhoads, 1903). However, the sources of these reports were second hand
hearsay with no scientific evidence supporting the claim (Frey 2013).
Beginning in the 19th century red fox populations appeared in central and western states such that by the 1920’s red foxes were present in Texas, Oklahoma, Kansas and Nebraska. This
expansion continued until red foxes reached California towards the end of the twentieth century
(Kamler and Ballard, 2002). Prior to this range expansion, red foxes from the East were being transported to California, Washington, and areas of the Midwest through the fur farm trade (Aubry, 1983; Lewis et al 1999; Statham et al 2012). As is common with fur farms, individuals
escaped from captivity and formed feral populations (Aubry, 1983; Lewis et al 1999; Zalewski et al 2011; Statham et al 2012). Currently red foxes are prevalent throughout the United States and
most of Canada.
11
source of the Eastern red fox was by Churcher in 1959. He performed a comprehensive morphological analysis of red foxes from Europe, Asia, Alaska and Eastern Canada and
determined they were the same species. Since his samples were from Eastern Canada, in the historically native range of North American red foxes, this did not address the status of the
south-eastern red fox. More recently, a study by Statham et al (2012) sampled individuals from Georgia, West Virginia, Arkansas, North Carolina, Oklahoma, and Texas and found no evidence of European matrilineal ancestry, refuting the claim that red foxes in the United States are
European invasives. However, their study did not include a thorough sampling of the mid-Atlantic region which was the primary region for introductions. Thus, the status of the Eastern
red fox remains unknown.
Goals and Questions
The global decline in biodiversity has numerous causes, invasive species being among the most severe with significant resources spent on managing their impacts (Genovesi et al
2015). However, the establishment of new populations or species is not exclusively attributable to introductions and invasions. Range expansions of nearby native species reflect healthy biotic functioning, a necessary feature in a time of rapid climate change (Hewitt 2000). For the sake of
scientific resource management, it behooves researchers to differentiate between potentially harmful invasive populations and naturally established native ones, something which can be
difficult for cryptic or interbreeding species (Devillard et al 2014).
Even if invasive species are introduced, this does not guarantee their success (Parker et al 2013). Typically, a successful invasion requires multiple introductions from multiple source
12
Specifically, the questions addressed in the framework if this dissertation are: 1. What are the origins of the red fox in eastern United States?
2. What is the geographic extent of introduced European foxes?
3. Has native range expansion or human-mediated introduction played a bigger part in
the establishment of red foxes in eastern United States?
4. How has the landscape, specifically the Appalachian Mountain Range, impacted the distribution of red foxes in eastern United States?
5. What is the extent of nuclear introgression from British red foxes?
My dissertation uses multiple molecular approaches to answering these questions in three
chapters. In the second chapter I identify the origins of red foxes in different regions throughout eastern United States. I use mitochondrial markers and Y-chromosome markers to trace
maternal and paternal lineages and incorporate historical and international samples to identify the
sources. Chapter three focuses on the connectivity red foxes in eastern North America. I use population genetics to discriminate between natural range expansion and human mediated
population growth as the cause of red fox persistence in the region. Additionally, I incorporate resistance modeling and landscape genetics to explore the impacts of the Appalachian Mountains on dispersal and distribution. In chapter four I explore the degree of influence introduced red
foxes have had on the nuclear genome and the level of introgression that has occurred. Finally, in chapter five I address all of the questions in light of the results and acceptance of the
13 LITERATURE CITED
ABBOTT,R.,ALBACH,D.,ANSELL,S.,ARNTZEN,J.W.,BAIRD,S.J.E.,BIERNE,N.,BOUGHMAN, J.,BRELSFORD,A.,BUERKLE,C.A.,BUGGS,R.,BUTLIN,R.K.,DIECKMANN,U.,
EROUKHMANOFF,F.,GRILL,A.,CAHAN,S.H.,HERMANSEN,J.S.,HEWITT,G.,HUDSON,A.
G.,JIGGINS,C.,JONES,J.,KELLER,B.,MARCZEWSKI,T.,MALLET,J.,MARTINEZ
-RODRIGUEZ,P.,MÖST,M.,MULLEN,S.,NICHOLS,R.,NOLTE,A.W.,PARISOD,C.,PFENNIG,
K.,RICE,A.M.,RITCHIE,M.G.,SEIFERT,B.,SMADJA,C.M.,STELKENS,R.,SZYMURA,J.
M.,VÄINÖLÄ,R.,WOLF,J.B.W. AND D. ZINNER.2013. Hybridization and speciation.
Journal of Evolutionary Biology, 26: 229–246.
AGASH,D.,FALK,J.J., AND D.I. BOLNICK.2011. Effects of founding genetic variation on
adaptation to a novel resource. Evolution, 65: 2481-2491.
ALLENDORF,F.W. AND L.L.LUNDQUIST. 2003. Population biology, evolution, and control of
invasive species. Conservation Biology, 17: 24-30.
AUBRY,K.B. 1983. The cascade red fox: distribution, morphology, zoogeography and ecology.
Ph.D. dissertation. University of Washington, Seattle.
AUBRY,K.B.,M.J.STATHAM,B.N.SACKS,J.D.PERRINE, AND S.M.WISELY. 2009.
Phylogeography of the North American red fox: vicariance in Pleistocene forest refugia.
Molecular Ecology 18: 2668–86.
AUDUBON,J.J., AND J.BACHMAN. 1849. The viviparous quadrupeds of North America.
Privately published by J.J. Audubon, New York. Vol. 2.
AVISE,J.C,ARNOLD,J.,BALL,M.,BERMINGHAM,E.,LAMB,T.,NEIGEL,J.E.,REEB,C.A., AND
N.C.SAUNDERS. 1987. Intraspecific Phylogeography: Mitochondrial DNA bridge between
population genetics and systematics. Annual Review of Ecology and Systematics, 18: 489– 522.
AVISE,J.C. AND D.ELLIS. 1986. Mitochondrial DNA and the evolutionary genetics of higher animals. Philosophical Transactions of the Royal Society B, 312: 325–342.
AVISE,J.C.1989. Gene trees and organismal histories: A phylogenetic approach to population
biology. Evolution, 43: 1192-1208.
CHANG,S.-W.,OSHIDA,T.,ENDO,H.,NGUYEN,S.T.,DANG,C.N.,NGUYEN,D.X.,JIANG,X.,LI,
Z.-J. AND L.-K.LIN. 2011, Ancient hybridization and underestimated species diversity in Asian striped squirrels (genus Tamiops): inference from paternal, maternal and biparental markers. Journal of Zoology, 285: 128–138.
CHURCHER,C.S., 1959. The Specific Status of the New World Red Fox. Journal of Mammology
14
CLARE,E.L. 2011. Cryptic species? Patterns of maternal and paternal gene flow in eight
neotropical bats. PLoS ONE, 6: e21460
DEVILLARD,S.,T.JOMBART,F. LÉGER,D.PONTIER.,L.SAY, AND S.RUETTE. 2014. How reliable
are morphological and anatomical characters to distinguish European wildcats, domestic cats and their hybrids in France? Journal of Zoological Systematics and Evolutionary Research, 52:154–162.
DIERKING,J.,PHELPS,L.,PRÆBEL,K.,RAMM,G.,PRIGGE,E.,BORCHERDING,J.,BRUNKE,M. AND
C. EIZAGUIRRE.2014. Anthropogenic hybridization between endangered migratory and
commercially harvested stationary whitefish taxa (Coregonus spp.). Evolutionary Applications, 7: 1068–1083.
ESTOUP,A.,BEAUMONT,M.,SENNEDOT,F.,MORITZ,C. AND J.-M. CORNUET.2004. Genetic
analysis of complex demographic scenarios: spatially expanding populations of the Cane toad, Bufo marinus.Evolution, 58: 2021–2036.
EXCOFFIER,L. 2004. Patterns of DNA sequence diversity and genetic structure after a range expansion: lessons from the infinite-island model. Molecular Ecology, 13: 853-864. EXCOFFIER,L AND N.RAY. 2008. Surfing during population expansions promotes genetic
revolutions and structuration. Ecology and Evolution, 23: 347-351.
EXCOFFIER,L.,HOFER,R. AND M.FOLL. 2009. Detecting loci under selection in a hierarchically
structured population. Heredity, 103: 285-298.
F.FRATI,G.B.HARTL,S.LOVARI,M.DELIBES AND G.MARKOV. 1998. Quaternary radiation and
genetic structure of the red fox Vulpes vulpes in the Mediterranean Basin, as revealed by allozymes and mitochondrial DNA. Journal of Zoology, 245, pp 43-51.
FREY,J.K. 2013. Re-evaluation of the evidence for the importation of red foxes from Europe to
colonial America: Origins of the southeastern red fox (Vulpes vulpes fulva). Biological Conservation 158:74-79.
GENOVESI,P.,CARBONERAS,C.,VILÁ,M., AND P.WALTON. 2015. EU adopts innovative legislation on invasive species: a step towards a global response to biological invasions?
Biological Invasions, 17:1307-1311.
GENTON,B.J.,J.A.SHYKOFF, AND T.GIRAUD. 2005. High genetic diversity in French invasive populations of common ragweed, Ambrosia artemisiifolia, as a result of multiple sources of introduction. Molecular Ecology, 14:4275-4285.
GERALDES,A.,BASSET,P.,GIBSON,B.,SMITH,K.,L.,HARR B.,YU,H.-T.,BULATOVA,N.,ZIV,
Y. AND M.W. NACHMAN.2008. Inferring the history of speciation in house mice from
15
GREMINGER,M.P.,KRÜTZEN,M.,SCHELLING,C.,PIENKOWSKA-SCHELLING,A. AND P.
WANDELER.2010. The quest for Y-chromosomal markers – methodological strategies for
mammalian non-model organisms. Molecular Ecology Resources, 10: 409–420.
GUICHOUX, E., LAGACHE, L., WAGNER, S., CHAUMEIL, P., LÉGER, P., LEPAIS, O., AND R.J. PETIT. 2011. Current trends in microsatellite genotyping. Molecular Ecology Resources, 11: 591-611.
HAGEN,S.B.,KOPATZ,A.,ASPI,J.,KOJOLA,I., AND H.G.EIKEN. 2015. Evidence of rapid
change in genetic structure and diversity during range expansion in a recovering large terrestrial carnivore. Proceedings of the Royal Society B – Biol Sci, 282
HALLATSCHECK,O. AND D. NELSON.2008. Gene surfing in expanding populations. Theoretical
Population Biology, 73: 158-170.
HEWITT,G. 2000. The genetic legacy of the Quaternary Ages. Nature, 405: 907-913.
INOUE,T.,NONAKA,N.,MIZUNO,A.,MORISHIMA,Y.,SATO,H.,KATAKURA,K., AND Y. OKU. 2007. Mitochondrial DNA phylogeography of the red fox (Vulpes vulpes) in northern Japan. Zoological science, 24: 1178-1186.
KAMLER,J.F., AND W.B.BALLARD. 2002. A review of native and nonnative red foxes in
America. Wildlife Society Bulletin, 30:370–379.
KELKAR, Y. D., STRUBCZEWSKI, N., HILE, S. E., CHIAROMONTE, F., ECKERT, K. A., AND K.D. MAKOVA. 2010. What is a microsatellite: a computational and experimental definition based upon repeat mutational behavior at A/T and GT/AC repeats. Genome Biology and Evolution, 2: 620-635
KIDD,A.G.,J.BOWMAN,D.LESBARRERES, AND A.I.SCHULTE-HOSTEDDE. 2009. Hybridization
between escaped domestic and wild American mink (Neovison vison). Molecular Ecology,
18:1175-1186.
KIRK,H.,J.PAUL,J.STRAKA, AND J.R.FREELAND. 2011. Long-distance dispersal and high genetic diversity are implicated in the invasive spread of the common reed, Phragmites australis (Poaceae) in northeastern North America. American Journal of Botany, 98:1180-1190.
KOVACH, R. P., MUHLFELD, C. C., BOYER, M. C., LOWE, W. H., ALLENDORF, F. W., AND G. LUIKART. 2015. Dispersal and selection mediate hybridization between a native and invasive species. Proceedings of the Royal Society of London B: Biological Sciences, 282: 20142454
16
LE ROUX,J.J.,G.K.BROWN,M.BYRNE,J.NDLOVU,D.M.RICHARDSON,G.D.THOMPSON, AND
J.R.U.WILSON. 2011. Phylogeographic consequences of different introduction histories of
invasive Australian Acacia species and Paraserianthes lophantha (Fabaceae) in South Africa. Diversity and Distributions, 17:861-871.
LEWIS,J.C.,SALLEE,K.L. AND R.T. GOLIGHTLY.1999. Introduction and range expansion of
nonnative red foxes (Vulpes vulpes) in California. The American Midland Naturalist, 142(2): 372-381.
MALLET,J. 2005. Hybridization as an invasion of the genome. Trends in Ecology &
Evolution, 20: 229-237.
MOONEY, H. A. AND E. E. CLELAND. 2001. The evolutionary impact of invasive species. Proceedings of the National Academy of Sciences, 98: 5446-5451.
MORAN, E. V., AND J. M. ALEXANDER. 2014. Evolutionary responses to global change: lessons from invasive species. Ecology Letters, 17: 637-649.
NORÉN, K., STATHAM, M.J., ÅGREN, E.O., ISOMURSU, M., FLAGSTAD, Ø., EIDE, N.E., BERG, T.B.G., BECH‐SANDERHOFF, L. AND B.N. SACKS. 2015. Genetic footprints reveal
geographic patterns of expansion in Fennoscandian red foxes. Global Change Biology, 21: 3299-3312.
PARKER, J. D., TORCHIN, M. E., HUFBAUER, R. A., LEMOINE, N. P., ALBA, C., BLUMENTHAL, D. M., BOSSDORF O., et al 2013. Do invasive species perform better in their new ranges? Ecology 94: 985-994.
PÉREZ-ESPONA, S., F. J. PÉREZ-BARBERÍA, C. D. JIGGINS, I. J. GORDON, AND J. M. PEMBERTON. 2010. Variable extent of sex‐biased dispersal in a strongly polygynous mammal. Molecular Ecology, 15: 3101-3113.
PETIT, E., BALLOUX, F. AND L. EXCOFFIER. 2002. Mammalian population genetics: why not Y? Trends in Ecology & Evolution, 17: 28-33.
PIMENTEL, D., ZUNIGA, R. AND D. MORRISON. 2005. Update on the environmental and economic costs associated with alien-invasive species in the United States. Ecological Economics 52: 273-288.
PIMM,S.L.,RUSSELL,G.J.,GITTLEMAN,J.L. AND T.M.BROOKS. 1995. The future of
biodiversity. Science, 269: 347-350.
17
RHODES,S.N. 1908. The mammals of Pennsylvania and New Jersey. Privately Published,
Philadelphia.
RICCIARDI,A. 2007. Are modern biological invasions an unprecedented form of global change?
Conservation Biology, 21:329-336.
RICHARDSON, D. M., AND M. REJMÁNEK. 2011. Trees and shrubs as invasive alien species–a global review. Diversity and Distributions, 17: 788-809.
SACKS,B.N.,M.J.STATHAM,J.D.PERRINE,S.M.WISELY, AND K.B.AUBRY. 2010. North
American montane red foxes: expansion, fragmentation, and the origin of the Sacramento Valley red fox. Conservation Genetics, 11:1523–1539.
SAKAI, A. K., ALLENDORF, F. W., HOLT, J. S., LODGE, D. M., MOLOFSKY, J., WITH, K. A. AND D.E. MCCAULEY. 2001. The population biology of invasive species. Annu Rev Ecol Syst, 305-332.
SASTRE, N., VILÀ, C., SALINAS, M., BOLOGOV, V. V., URIOS, V., SÁNCHEZ, A., FRANCINO, O. AND O. RAMÍREZ. 2011. Signatures of demographic bottlenecks in European wolf
populations. Conservation Genetics, 12: 701-712.
SCHREY, A. W., LIEBL, A. L., RICHARDS, C. L., AND L.B. MARTIN. 2014. Range expansion of house sparrows (Passer domesticus) in Kenya: evidence of genetic admixture and human-mediated dispersal. Journal of Heredity, 105: 60-69.
SLATKIN, M., AND L. EXCOFFIER. 2012. Serial founder effects during range expansion: a spatial analog of genetic drift. Genetics 191: 171-181.
STATHAM,M.J.,B.N.SACKS,K.B.AUBRY,J.D.PERRINE, AND S.M.WISELY. 2012. The origin of recently established red fox populations in the United States: translocations or natural range expansions? Journal of Mammalogy, 93:52–65.
STATHAM,M.J.,J.MURDOCH,J.JANECKA,K.B.AUBRY,C.EDWARDS,C.D.SOULSBURY,O.
BERRY,Z.WANG,D.HARRISON,M.PEARCH,L.TOMSETT,J.CHUPASKO, AND B.N.SACKS.
2014. Range-wide multilocus phylogeography of the red fox reveals ancient continental divergence, minimal genomic exchange and distinct demographic histories. Molecular Ecology, 23:4813-4830.
TEACHER, A. G., THOMAS, J. A. AND I. BARNES. 2011. Modern and ancient red fox (Vulpes vulpes) in Europe show an unusual lack of geographical and temporal structuring, and differing responses within the carnivores to historical climatic change. BMC evolutionary biology, 11: 214.
18
ZALEWSKI, A., MICHALSKA‐PARDA, A., RATKIEWICZ, M., KOZAKIEWICZ, M., BARTOSZEWICZ, M., AND M. BRZEZIŃSKI. 2011. High mitochondrial DNA diversity of an introduced alien carnivore: comparison of feral and ranch American mink Neovison vison in
Poland. Diversity and Distributions, 17: 757-768.
19
Chapter 2
Fate of the other red coat: remnants of colonial British foxes in the
Eastern United States
Published
20 ABSTRACT
Red foxes were absent or rare in the southeastern United States until the late 1800s. Their origins potentially include natural population increase/expansion, translocations from Europe, and, eventually, 20th century fur farming. Previous studies have found no European haplotypes
in North America, but few samples were sourced from the Atlantic coastal plain, closer to the source of putative introductions. Through analysis of mitochondrial DNA in 584 red foxes from
this region, we identified indigenous haplotypes in >35% of foxes, one of two European haplotypes in 17% of foxes, and fur-farm haplotypes in >13% of foxes; another 35% of foxes had haplotypes potentially indigenous or native. In contrast, only 3 of 135 (2%) male foxes
carried a single European Y-chromosome haplotype. Most European and fur-farm haplotypes were found near the densely human-populated coastal plain and Hudson River lowlands; most
red foxes of the Appalachians and Piedmont had native eastern haplotypes. Our findings suggest that the more remote, upland populations primarily reflect indigenous red fox matrilines, whereas
urban-associated populations in and around the mid-Atlantic coastal plain and Hudson lowlands reflect an admixture of native and nonnative maternal sources. Autosomal markers are needed to further elucidate the extent of European and fur-farm introgression in the Appalachians and
further west.
Keywords:
21 INTRODUCTION
Humans affect the distributions of species in a variety of ways, ranging from direct translocations between continents to conversion of habitats, which, in turn, can facilitate range expansions of native species. The establishment of nonnative species from intercontinental
translocations is typically harmful to native communities and has been cited as a leading cause of biodiversity decline (Genton et al 2005; Ricciardi 2007; Kirk et al 2011; LeRoux et al 2011). In
contrast, range expansions of native species, even if prompted by anthropogenic landscape changes, can reflect a healthy level of biotic functioning, which is necessary for the resilience of native communities in the face of changing climates and environments (Hewitt 2000; Valladares
et al 2014; Gimona et al 2015). Differentiating between these sources of origins of recently established species is therefore important and not always obvious, such as when distinctions
between different species are morphologically cryptic or when native and nonnative species can interbreed (Devillard et al 2014).
Red foxes (Vulpes spp.) in the eastern United States represent such a case where origins remain unclear. Early naturalists believed that red foxes did not occur south of New York State at the time of European colonization (Audubon and Bachman 1849; Churcher 1959).
Subsequent discoveries of late-Holocene faunal sites along the Appalachians and adjacent
Piedmont as far south as Georgia, however, suggest that red foxes occurred in these areas prior to
European colonization, after which time they either disappeared or remained scarce and undetected (Statham et al 2012; Frey 2013). It is possible that the range extent of the red fox along the Appalachians (and further north) was dynamic during the late Holocene, e.g.,
depending on climatic fluctuations, and/or that clearing of forests for agriculture encouraged population increase or expansion of native red fox populations in the Atlantic coastal plain
22
Today, red foxes are abundant throughout the Appalachians and eastward continuously to the coast. In addition to uncertainty about the pre-European range and early range expansions of
native red fox, the origins and composition of these modern eastern red foxes are obscured by putative introductions of foxes from Europe in the 1800s to coastal regions, such as Delaware or
New Jersey (Kamler and Ballard 2002; Frey 2013). Complicating the issue further, fox farms composed of individuals derived ultimately from eastern Canadian and Alaskan populations, but selectively bred in captivity, proliferated throughout North America in the early to mid-1900s,
providing yet a third potential source (Statham et al 2011, 2012). We refer to these farm-derived foxes as “feral” to indicate their derivation from captive-bred stock (Sacks et al 2011).
Understanding the contribution of European ancestry to contemporary populations is particularly important in light of recent evidence for species-level divergence between Eurasian and North American red foxes (Statham et al 2014), but the potential contribution of fur-farm foxes to
contemporary wild populations also has implications for their characterization as a natural or anthropogenic population (Sacks et al 2011). For example, interbreeding with escaped mink from
fur farms has been identified as a threat to the viability of wild mink in eastern Canada (Kidd et al 2009).
Hypotheses for the ancestral composition of contemporary eastern red foxes have
spanned the extremes. One review concluded that all modern red foxes in the eastern United States, as well as in the Midwest and Canada, were of European ancestry (Kamler and Ballard
2002). Conversely, a subsequent review suggested the possibility that European red foxes were never imported to the continent in the first place (Frey 2013). More consistent with the latter hypothesis, prior to our study, mitochondrial sequences from many red foxes from throughout
23
2007; Aubry et al 2009; Sacks et al 2010; Statham et al 2012, 2014; Langille et al 2014). However, only a small number of red foxes from the eastern United States had been sequenced
and most of these were from the Appalachians and vicinity, where origination by natural means was most likely (Statham et al 2012; Frey 2013). In particular, the distribution of late-Holocene
faunal remains suggest that red foxes occurred naturally, if episodically, within what Merriam (1898) termed the “Transition zone,” corresponding primarily to the Appalachian Mountains,
and the “upper Austral zone,” corresponding primarily to the Piedmont (Frey 2013). Therefore,
it remains possible that eastern red foxes in lowest-elevation regions, such as the Atlantic coastal plain, contain European ancestry (Aubry et al 2009; Statham et al 2012). Secondly, 1 of 3 red
foxes sequenced from the coastal plain contained an Alaskan haplotype known to be associated with fur farming, indicating at least some contribution of fur farm stock to modern eastern red foxes (Statham et al 2012).
We sought to resolve the origins of red foxes in the eastern United States through analysis of matrilineal and patrilineal markers of 584 individuals collected from several eastern
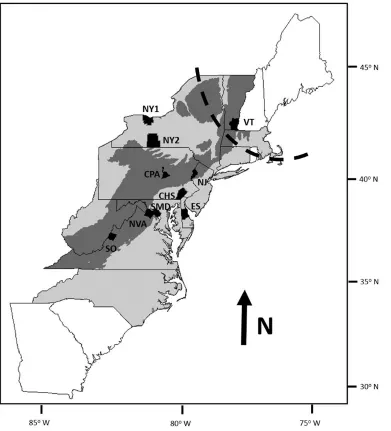
states (Fig. 1). Specifically, we investigated 1) the extent to which red foxes in eastern United States reflected European versus North American ancestry, and 2) the extent to which North American ancestry reflected natural populations versus escape or release of captive-reared
fur-farm foxes. We also investigated population genetic structure with particular attention to whether the populations in the Appalachian and less human-dominated adjacent regions were distinct
from those of the more densely human-dominated coastal plain and Hudson River lowlands (hereafter Hudson lowlands). We sequenced mitochondrial DNA and genotyped 2
microsatellite loci from the Y chromosome, and compared these to published sequences and
24
of maternally and paternally inherited markers also enabled us to directly assess interbreeding between European and North American ancestors and male versus female introgression.
MATERIALS AND METHODS
Study area and sample collection.
The study area encompassed a combination of less human-dominated natural areas
associated with the Appalachians and Piedmont and high human-density regions of the Atlantic coastal plain, particularly along the “I-95 corridor” linking New York and Washington D.C., and
Hudson lowlands (Fig. 1).
We collected a total of 584 tissue samples during 2010–2013, which are currently archived in the sample collection at the Mammalian Ecology and Conservation Unit at the
University of California at Davis. Most samples were contributed by trappers in the form of muscle tissue samples (~2 g preserved in 95% ethanol; n = 69) or dried skin snips (n = 498), but
we also collected muscle samples from 17 carcasses discovered opportunistically (e.g., road kills). Samples were collected from Vermont (n = 26), New York (n = 138), New Jersey (n = 66), Pennsylvania (n = 120), Delaware (n = 48), Maryland (n = 105), Virginia (n = 79), and
North Carolina (n =2). Additionally, we included 17 previously published mtDNA sequences, including 2 collected in New York State in 1856 (before the advent of fur-farming) and 12
collected from Georgia (n = 9, 1931–1933), West Virginia (n = 1, 1938), and Maine (n = 2, 1923), also less likely than modern samples to contain fur-farm ancestry, and 3 modern samples collected from coastal North Carolina (Statham et al 2012). We grouped samples into
25
Figure 1: Map of the study area and locations of red fox samples collected during 2010–2013, along with four sites of previously published historical (1856–1938) samples from the Appalachian (dark grey) and Piedmont (light grey) regions (Statham et al 2012). Sampling locations are abbreviated as Eastern Shore (ES), Chesapeake (CHS), North Pennsylvania (PAN), Central Pennsylvania (PAC), New Jersey (NJ), New York (NY), Southern Virginia and western North Carolina Piedmont (SO), Northern Virginia (NVA), Southern Maryland (SMD), Vermont (VT), Historical Maine (HME), Historical New York (HNY), Historical West Virginia (HWV), Historical Georgia (HGA), and coastal North Carolina (NCC). The samples for the present study emphasized the more densely
26
We extracted DNA from tissue using a DNeasy Blood and Tissue Kit (Qiagen, Inc., Valencia, California) following manufacturers recommendations. We amplified and sequenced
697 base-pairs (bp) of mitochondrial DNA including 354 bp of the cytochrome-b (Cytb) gene using primers RF14724 and RF15149 and a 343 bp of the control region using the primers
VVDL1 and VVDL6 that were previously analyzed in > 1,000 samples from throughout the worldwide range of the red fox (Perrine et al 2007; Aubry et al 2009; Statham et al 2012, 2014). We conducted polymerase chain reaction (PCR) in 25 μl reactions under the following
conditions: 1 μl template DNA, 0.5 μM of forward and reverse primer, and One Taq 2X master mix used according to manufacturer’s instructions (Applied Biosystems, Foster City, California).
The thermocycler profile included an initial denaturation step at 94oC for 30 s, 30 cycles at 94oC for 30 s, 45oC for 60 s, and 68oC for 60 s, and a final extension step at 68oC for 5 min. We sequenced cleaned PCR product from both forward and reverse primers of both fragments using
BigDye Terminator Cycle Sequencing Ready Reaction Kit v 3.1 (Applied Biosystems), cleaned sequences using ExoSAP-IT (Affymetrix, San Diego, California), and electrophoresed them with
an Applied Biosystems 3130XL capillary sequencer.
We PCR-amplified 2 Y-chromosome markers that produced haplotypes directly
comparable to previous ones typed in European, Asian, and North American foxes (Statham et al
2014). We used the primers reported in Statham et al (2014): Y29-Fox (F2:
AGTGCTTAGGCTCAGGATGC, R1: TCCAGGTTTTATTTAGGGTCTT) and Y30-Fox (F2:
27
We electrophoresed PCR products using an ABI 3730 capillary sequencer (Applied Biosystems) and scored alleles relative to an internal size standard, Genescan 500 LIZ (Applied Biosystems),
using STRand software (Toonen and Hughes 2001).
Data analyses
To address our first objective, characterizing matrilines and patrilines as to their continental origins, we compared mtDNA and Y-chromosome haplotypes from this study to
published ones and evaluated origins based on both identity and phylogenetic clustering. The mitochondrial haplotypes could be unambiguously assigned to North America or Europe (Aubry
et al 2009; Statham et al 2014). Although the Y-chromosome haplotypes were based on only two microsatellite loci, continental differences, possibly related to indels in the flanking regions, rendered these loci used in tandem also to be diagnostic. In particular, locus Y30 was
monomorphic in North America (387 bp) and distinct from the size range over most of Europe (393–405 bp); the exception was in Scandinavia (as with Asia), where some haplotypes also had
the 387 bp allele at this locus. However, in such cases, the other locus (Y29) had alleles ranging 156 to 166 in Eurasia and 170 to 178 in North America (Statham et al 2014). Therefore, our basic approach was to construct phylogenetic trees and networks consisting of the haplotypes in
this study and representative reference haplotypes.
For mitochondrial data, we read, aligned, and edited sequences in Geneious v6.0
(Drummond et al 2014). We concatenated Cytb and control-region fragments into composite mtDNA haplotypes for analysis because no recombination occurs on the mtDNA genome. For novel sequences, we used the Basic Local Alignment Search Tool (BLAST) to search the
28
previous studies (e.g., Statham et al 2014), whereby the name of the Cytb fragment (beginning with or consisting of a letter) is followed by a dash and then the control-region fragment (a
number); Y-chromosome haplotypes are named based on the fragment size of the two
microsatellite loci. For mitochondrial data, we estimated maximum likelihood (ML) trees with
nodes assessed from 1,000 bootstrapped trees in Paup* v. 4 (Swofford 2003). We used
JModelTest to determine the best-fit model of evolution for each gene (Darriba et al 2012) and used Akaike information criterion (AIC) to select the model most compatible with PAUP* v. 4.
We only used one individual per haplotype per population from the study sample, along with all previously published haplotypes from North America and a subset from Europe, that
encompassed all haplotypes from Britain, Ireland, Sweden, Norway, and countries of Central Europe (Statham et al 2014), all areas putatively sourcing introductions of red fox to North America (Kamler and Ballard, 2002; Long 2003; Statham et al 2012; Frey 2013). We visualized
the tree in FigTree (Rambaut and Drummond 2012). To test alternative phylogenetic
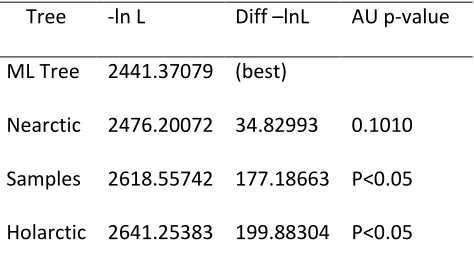
hypotheses, we ran an approximately unbiased (AU) test using PAUP*v.4.0 (Shimodaira 2002;
Swofford 2003).
To explore the phylogenetic affinities of the Y-chromosome markers we combined alleles from the two linked loci into haplotypes and compared these to a global dataset to assess
continental origins (Statham et al 2014). Specifically, we added our new haplotypes to a
haplotype network initially created using Network 6.0 (Bandelt et al 1999) on which haplotypes
were previously clustered into exclusively North American or Eurasian haplogroups (Statham et al 2014).
To address the contributions of fur-farm ancestry in our study area, we relied on two
29
fox populations (Aubry et al 2009) but are common in fur farms and “feral” populations (i.e., populations derived from fur farms) throughout the United States (Perrine et al 2007; Sacks et al
2010, 2011; Statham et al 2011, 2012). Other common fur-farm haplotypes were derived from eastern Canada and were therefore potentially the same ones that could have colonized the
eastern U.S. naturally (Statham et al 2012). Therefore, we considered eastern Canadian haplotypes previously associated with fur farm ancestry to be of ambiguous origin. The only previous study to use the Y-chromosome markers did not include fur-farm derived or sufficient
numbers of native North American foxes to enable us to differentiate paternal ancestry within the continent.
Our final objective was to explore geographic patterns of haplotype distribution to assess the possibility of differentiation among populations corresponding to different historical origins. We estimated haplotype diversity (h) for both mtDNA and Y-chromosome haplotypes and nucleotide diversity (π), Tajima's D, and Fu's Fs for mtDNA in Arlequin v3.5 (Fu 1997, Tajima
1989, Excoffier Lischer 2010). We visualized haplotype relationships using a haplotype network
created with Network 6.0 and bases corresponding to the Cytb portion weighted twice that of the control-region bases (Sacks et al 2010). To assess isolation by distance, we performed a Mantel test in Arlequin (Excoffier and Lischer, 2010). We then used a spatial analysis of molecular
variance (SAMOVA) in the program SAMOVA 2.0 to identify patterns of hierarchical structure corresponding to K = 2 – 6 groupings among 10 spatial units on the basis of pairwise distance
30 RESULTS
Origins of eastern red fox lineages
We successfully amplified both the Cytb and control-region mitochondrial DNA
fragments in 566 individuals. Despite the large number of samples from an extensive region, we
identified only 15 distinct haplotypes. Of these, all but one, A-269 (GenBank Accession No. KP860297), had been previously described. However, these haplotypes reflected multiple
phylogenetically distinct lineages associated with divergent origins (Fig. 2). The Shimodaira AU test supported previous analyses indicating distinct “Nearctic” and “Holarctic” clades, with a
North American subclade (H III Alaskan—Statham et al 2014) nested within the otherwise
Eurasian Holarctic clade (Appendix 1).
31
farms (fur-farm), and non-indigenous haplotypes from Europe. Sampling locations are abbreviated as Eastern Shore (ES), Chesapeake (CHS), North
Pennsylvania (PAN), Central Pennsylvania (PAC), New Jersey (NJ), New York (NY), Southern Virginia and western North Carolina Piedmont (SO), Northern Virginia (NVA), Southern Maryland (SMD), Vermont (VT), Historical Maine (HME), Historical New York (HNY), Historical West Virginia (HWV), Historical Georgia (HGA), and coastal North Carolina (NCC). Spatial units refer to samples used in the SAMOVA. Samples in parentheses were excluded from the SAMOVA due to low sample size.
Sampling Spatial Nativeb Ambiguous nativec
Fur-farm European locationa n unit Regions
A-84 A8-84 A-269 A3-87 F3-9 F4-81
E22
-9 E-9 E-86 F-9 F-12 G-38 N-7 U8-157 U8-227
NY1 7 A Hudson lowlands -- -- 1 -- 1 -- -- -- 1 2 -- -- -- 2 --
NY2 16 A Hudson lowlands -- -- 1 -- 10 -- -- -- 3 -- -- -- -- 2 --
NY3 15 A Hudson lowlands -- -- 5 -- 1 -- -- 2 -- -- -- 1 -- 5 1
NY4 18 A Hudson lowlands -- -- 7 -- 4 -- -- -- 3 1 -- 1 -- 1 1
NY5 51 A Hudson lowlands -- -- 4 -- 6 -- -- 7 24 9 -- 1 -- -- --
NY6 9 A Hudson lowlands -- -- -- -- 2 -- -- 1 4 1 -- 1 -- -- --
NY7 8 A Hudson lowlands -- -- -- -- 1 -- -- 1 5 -- -- -- -- 1 --
NJ1 12 B Atlantic coast plain -- -- -- -- 2 -- -- -- -- -- -- 6 -- 1 3
NJ2 51 B Atlantic coast plain -- -- 1 -- 11 -- -- 1 7 2 -- 18 -- 2 9
ES 48 C Atlantic coast plain -- -- -- -- 18 -- -- -- 1 -- -- 13 -- 16 --
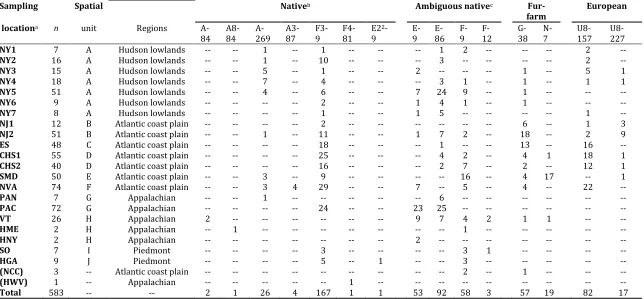
CHS1 55 D Atlantic coast plain -- -- -- -- 25 -- -- -- 4 2 -- 4 1 18 1
CHS2 40 D Atlantic coast plain -- -- -- -- 16 -- -- -- 2 7 -- 2 -- 12 1
SMD 50 E Atlantic coast plain -- -- 3 -- 9 -- -- -- -- 16 -- 4 17 -- 1
NVA 74 F Atlantic coast plain -- -- 3 4 29 -- -- 7 -- 5 -- 4 -- 22 --
PAN 7 G Appalachian -- -- 1 -- -- -- -- -- 6 -- -- -- -- -- --
PAC 72 G Appalachian -- -- -- -- 24 -- -- 23 25 -- -- -- -- -- --
VT 26 H Appalachian 2 -- -- -- -- -- -- 9 7 4 2 1 1 -- --
HME 2 H Appalachian -- 1 -- -- -- -- -- -- -- 1 -- -- -- -- --
HNY 2 H Appalachian -- -- -- -- -- -- -- 2 -- -- -- -- -- -- --
SO 7 I Piedmont -- -- -- -- 3 -- -- -- -- 3 1 -- -- -- --
HGA 9 J Piedmont -- -- -- -- 5 -- 1 -- -- 3 -- -- -- -- --
(NCC) 3 -- Atlantic coast plain -- -- -- -- -- -- -- -- -- 2 -- 1 -- -- --
(HWV) 1 -- Appalachian -- -- -- -- -- 1 -- -- -- -- -- -- -- -- --
Total 583 -- -- 2 1 26 4 167 1 1 53 92 58 3 57 19 82 17
aSampling locations refer to the following counties: Allegany (NY1); Livingston (NY2); Monroe (NY3); Wayne (NY4); Ontario (NY5); Yates (NY6); Steuben
(NY7); Morris (NJ1), Warren (NJ2); Kent Cty, DE (ES); Cecil Cty, MD (CHS1); Lancaster Cty, PA (CHS2); Montgomery (SMD); Fairfax and Prince William (NVA); Bradford (PAN); Northumberland (PAC); Windham (VT); Tazewell Cty, VA and Davidson Cty, NC (SO); Beaufort, Brunswick, and Dare Ctys, NC (NCC); Oxford (HME, 1923);Essex (HNY, 1856); Pendelton (HWV, 1938); Talbot (HGA, 1920-1935).
bTwo singleton haplotypes in the historical samples differed from the nearest verified haplotypes by C-T or A-G changes consistent with post-mortem
degradation. A8-84 was otherwise the same as A-84 and E2-9 was otherwise the same as E-9.
cThe control region portion of haplotype F3-76 and F-76 (i.e., 9) described by Statham et al 2012 (and Langille et al 2014) differed from haplotype 9 by the
32
Most of the haplotypes could be directly assigned to an unambiguous source (Table 1). Previously characterized haplotypes native to eastern Canada and the northeastern United States
composed 70% of the sample. However, the subsets of these haplotypes that had not been previously associated with fur farms (A-84, A8-84, A-269, A3-87, F3-9, F4-81, E2-9) and which
had been used in fur-farming (E-9, E-86, F-9, F-12) each composed 35% of the total sample. These frequencies imply that 35% to 70% of mtDNA haplotypes arose directly from natural populations. Additionally, two haplotypes derived from Europe (U8-157, U8-227), comprised
17% of the sample. These haplotypes belonged to Holarctic subclade IX which predominates in Great Britain and Ireland, while the specific haplotypes each had been found previously only
once, specifically in Ireland (Statham et al 2014). Lastly, 2 haplotypes deriving from Alaskan fur-farm stock (G-38, N-7) composed 13% of the sample. Based on the subset of 377 foxes that carried haplotypes representing unambiguous origins, 54% were native eastern, 26% were
European, and 20% were from fur farms.
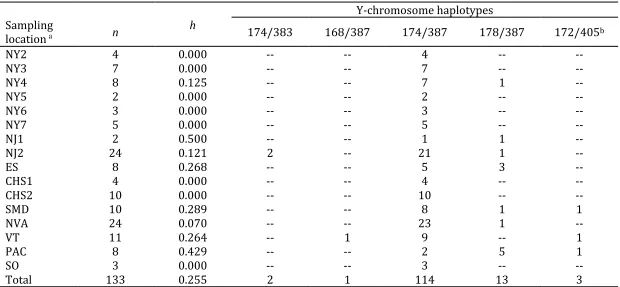
Out of 135 males that amplified both Y29 and Y30 markers, we observed 5 haplotypes
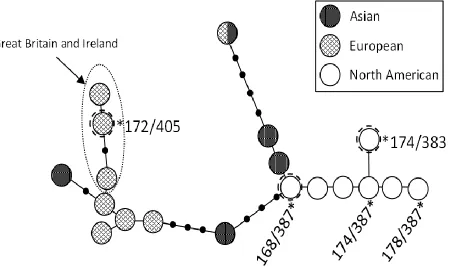
(Table 2). The dominant haplotype, 174/387, composed 83% (n = 114) of the total sample and was previously found only in North America (Table 2; Statham et al 2014). We also observed two previously undefined haplotypes that clustered within the North American haplogroup, and a
third previously undefined haplotype that clustered within the European haplogroup.
Specifically, the European haplotype grouped with others from Great Britain (Fig. 3). In contrast
to the mtDNA, only three individuals (2%) carried the European Y-chromosome haplotype; each of these individuals was sampled from a distinct population: Vermont, Central Pennsylvania, and Southern Maryland. Southern Maryland was the only sampling site with both European mtDNA
33
European mitochondrial haplotypes were prevalent had European Y-chromosome markers. In addition, all three males with European Y chromosomes had eastern North American
mitochondrial haplotypes.
Figure 3. Median-joining network of 19 haplotypes composed of microsatellite loci linked on the Y chromosome, illustrating the phylogenetic placement of the 5 haplotypes found in 133 male red foxes from the Eastern United States relative to 16 previously published haplotypes from red foxes sampled throughout Eurasia and North America (Statham et al 2014). Haplotypes starred and labeled correspond to those found in this study. Three haplotypes newly described in this study are indicated with a dashed ring around the node, and a European haplogroup found previously only in Britain is indicated within the dotted-line ellipse.
Geographic patterns
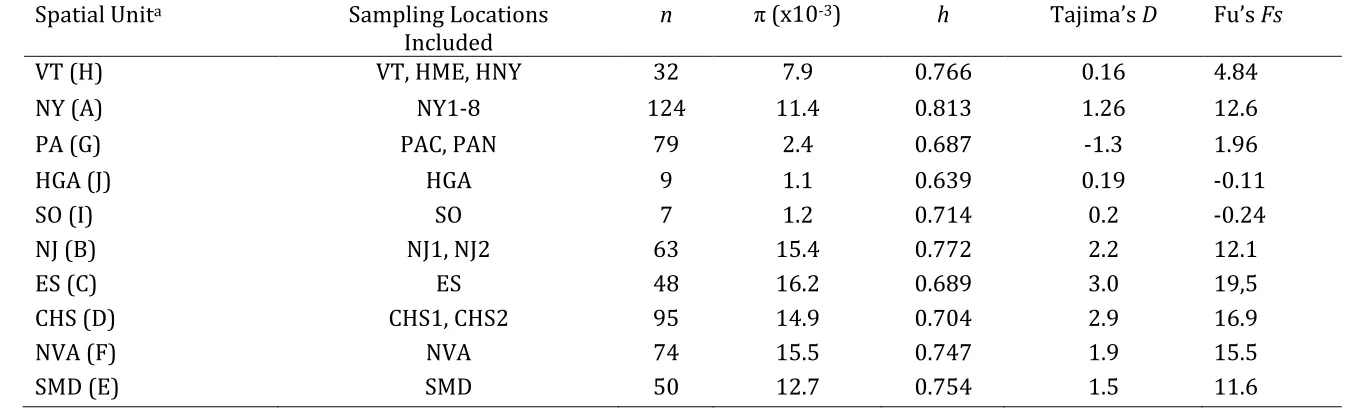
A total of 99 individuals bearing European mtDNA haplotypes was present in 11 of the 18 samples (Table 1). The haplotype and nucleotide diversities were notably higher in the sites
with European ancestry than in those with purely North American ancestry (Table 3). None of the neutrality tests were significant but were generally positive, particularly in sites with
European haplotypes. Most of the European haplotypes occurred in the mid-Atlantic states east
34
lowlands of western New York (Fig. 4). Unambiguous fur-farm haplotypes (i.e., those of
Alaskan ancestry) were distributed similarly to European ones across sampling locations. Native
eastern haplotypes not previously associated with fur farming composed similar portions of all samples. Notably, most (98.4%) of 126 samples from the Appalachians and adjacent Piedmont
had haplotypes indigenous to eastern North America (i.e., native or potentially native samples). We observed no significant relationship between genetic and geographic distance (Mantel test, r = 0.09, P = 0.29). The SAMOVAs indicated statistically significant divisions
corresponding to K = 2–6, but ΦCT values did not increase beyond K = 2, indicating that a single division into two groups was most parsimonious (Table 4). One group was composed of sites in
the mid-Atlantic coastal plain and the other was broadly distributed north to south in or near the Appalachians. Genetic distances among sampling units within these groupings varied but were generally much less than between groups, particularly based on ΦCT, which reflected the
35
Table 2. Haplotype diversity (h) anddistribution of 5 Y-chromosome haplotypes in 133 male red foxes from 16 sampling locations in the Eastern United States.
a Sampling locations refer to the following counties: Livingston (NY2); Monroe (NY3); Wayne (NY4); Ontario (NY5); Yates (NY6); Steuben (NY7); Morris
(NJ1), Warren (NJ2); Kent, DE (ES); Cecil, MD (CHS1); Lancaster, PA (CHS2); Montgomery (SMD); Fairfax and Prince William (NVA); Northumberland (PAC); Windham (VT); Tazewell Cty, VA and Davidson Cty, NC (SO).
bHaplotype 172/405 is presumed to be of European origin.
Y-chromosome haplotypes Sampling
location a n
h
174/383 168/387 174/387 178/387 172/405b
NY2 4 0.000 -- -- 4 -- --
NY3 7 0.000 -- -- 7 -- --
NY4 8 0.125 -- -- 7 1 --
NY5 2 0.000 -- -- 2 -- --
NY6 3 0.000 -- -- 3 -- --
NY7 5 0.000 -- -- 5 -- --
NJ1 2 0.500 -- -- 1 1 --
NJ2 24 0.121 2 -- 21 1 --
ES 8 0.268 -- -- 5 3 --
CHS1 4 0.000 -- -- 4 -- --
CHS2 10 0.000 -- -- 10 -- --
SMD 10 0.289 -- -- 8 1 1
NVA 24 0.070 -- -- 23 1 --
VT 11 0.264 -- 1 9 -- 1
PAC 8 0.429 -- -- 2 5 1
SO 3 0.000 -- -- 3 -- --
36
Table 3. Indices of genetic diversity within spatial red fox sampling units in the Eastern United States: nucleotide diversity (π), haplotype diversity (h), Tajima’s D, and Fu’s Fs. None of the D or Fs estimates differed significantly from zero (P < 0.05).
Spatial Unita Sampling Locations
Included
n π (x10-3) h Tajima’s D Fu’s Fs
VT (H) VT, HME, HNY 32 7.9 0.766 0.16 4.84
NY (A) NY1-8 124 11.4 0.813 1.26 12.6
PA (G) PAC, PAN 79 2.4 0.687 -1.3 1.96
HGA (J) HGA 9 1.1 0.639 0.19 -0.11
SO (I) SO 7 1.2 0.714 0.2 -0.24
NJ (B) NJ1, NJ2 63 15.4 0.772 2.2 12.1
ES (C) ES 48 16.2 0.689 3.0 19,5
CHS (D) CHS1, CHS2 95 14.9 0.704 2.9 16.9
NVA (F) NVA 74 15.5 0.747 1.9 15.5
SMD (E) SMD 50 12.7 0.754 1.5 11.6
a Sampling locations refer to standard state abbreviations except for HGA (Historical Georgia), SO (Tazewell Cty, VA and Davidson Cty, NC), ES (Kent Cty, DE), CHS (Cecil Cty, MD and Lancaster Cty, PA), NVA (Fairfax and Prince William Ctys), SMD
(Montgomery Cty).
37