VOLUME 38, ARTICLE 2, PAGES 37
,
94
PUBLISHED 4 JANUARY 2018
http://www.demographic-research.org/Volumes/Vol38/2/ DOI: 10.4054/DemRes.2018.38.2
Research Article
Historical reproductive patterns in developed
countries: An aggregate-level perspective
Jesús J. Sánchez-Barricarte
© 2018 Jesús J. Sánchez-Barricarte.
This open-access work is published under the terms of the Creative Commons Attribution 3.0 Germany (CC BY 3.0 DE), which permits use, reproduction, and distribution in any medium, provided the original author(s) and source are given credit.
1 Introduction 38
2 Methodology and data s 39
3 Description of the evolution of Ig (index of marital fertility) and Ig
×25p0 (index of net marital reproduction)
44
4 Description of the evolution of the index of net total reproduction (TFR ×25p0): From the ‘three-child pattern’ to the ‘two-child
pattern’
55
5 Quantification of the influence of marital fertility, mortality, and nuptiality on net total reproduction during the demographic transition
58
6 Nonhomogeneous effect of mortality on net total reproduction during the demographic transition
62
7 Conclusions 65
References 66
http://www.demographic-research.org 37
Historical reproductive patterns in developed countries:
An aggregate-level perspective
Jesús J. Sánchez-Barricarte1
Abstract
BACKGROUND
One of the fundamental arguments sustaining the classical demographic transition theory was that couples wanted to have a given number of surviving children, not a specific number of births. However, this cornerstone of transition theory came in for severe criticism in the wake of the results published in many studies linked to the Princeton European Fertility Project (PEFP). In recent years, studies using longitudinal microdata have made important contributions towards clarifying the relationship between mortality and fertility during the transition.
OBJECTIVE
We will show that aggregated data (from both the national and the provincial sphere) can lead to conclusions similar to those obtained at micro-level.
METHODS
Employing information from 25 developed countries, this article analyzes trends in net reproduction (rather than just the intensity of births) over a long period of time. We also quantify in detail the different influences of marital fertility, mortality, and nuptiality on historical developments in net total reproduction.
RESULTS
Our analysis reveals a great diversity in the reproductive patterns followed in different countries in the process of regulating the total number of births. We also detect the existence of a nonhomogeneous effect of mortality on net reproduction during the demographic transition.
CONCLUSIONS
There is little point in analyzing fertility trends if we leave out the mortality scenario that forms the background to these tendencies.
1Carlos III University of Madrid, Department of Social Analysis, Spain.
CONTRIBUTION
The results of this study using aggregated data (covering longer periods of time and larger geographical areas) are fully in line with those of recent projects using microdata from family reconstructions.
1. Introduction
It is generally accepted that before the demographic transition, people’s reproductive behavior was conditioned by cultural and social factors: The total number of births in a given society was regulated by the age of access to marriage or the percentage of young people who could afford to marry. As the transition set in, decisions about reproduction began to have a more individual, family-orientated background. In other words, the decision as to the number of children to have came to be influenced more by the family’s circumstances than by social expectations (Reher and Sandström 2015; Reher et al. 2017).
Until recently it was impossible to test empirically whether couples actively took decisions during the demographic transition, particularly in view of the changes in mortality, which are likely to have had a major impact on reproductive behaviors. It is true that the founding fathers of demographic transition theory always regarded mortality as the key factor that triggered the decline in fertility during the late 19th
century (Notestein 1945; Davis 1963), but this was more of a supposition than a demonstrable fact. One of the fundamental arguments sustaining the classical demographic transition theory was that couples wanted to have a given number of surviving children, not a specific number of births. However, this cornerstone of transition theory came in for severe criticism in the wake of the results published in many studies linked to the Princeton European Fertility Project (PEFP) (Knodel 1974, 1978; Lesthaeghe 1977; Matthiessen and McCann 1978; van de Walle 1986). However, some experts continued to stress the important influence of mortality on the birth rate (Knodel 1988; Kirk 1996; Haines 1998; Galloway, Lee, and Hammel 1998).
http://www.demographic-research.org 39 Knodel 1988; van Bavel 2003, 2004; Reher and Sanz-Gimeno 2007; van Bavel and Kok 2010; Reher et al. 2017).
Information about individuals is certainly richer and more diverse than aggregated data from large geographical areas, but it is subject to considerable restrictions because it is practically impossible to apply these techniques over long periods of time or large geographical areas. Even if the financial, material, and human resources are available to undertake such a colossal task, the doubt always remains as to whether the information obtained for the village (or group of villages) is really representative of the country where that village is situated. In short, it is hard to construct general explanatory theories about demographic behaviors on the basis of the patterns observed in a few villages. To this we must add the fact that it is very difficult to perform family reconstructions for cities, or even for towns. Family reconstitutions have been undertaken only rarely in urban settings due to the high mobility of historical urban populations. However, historically, urban populations exerted an influence on national demographic trends (Davenport 2016). The swift urbanization process in Western countries during the demographic transition cannot be ignored in historical studies of reproductive behavior, and so it is necessary to augment and complement the results of family reconstruction studies by using other analytical approaches that allow us to contrast demographic patterns in urban and rural areas. In other words, the rich data provided over recent decades by microanalyses based on family reconstruction need to be complemented by the results of studies based on aggregated data.
One of the contributions of the present study is precisely its use of a large number of countries over a lengthy historical period. We show that aggregated data (from both the national and the provincial sphere) can lead us to draw conclusions similar to those obtained at micro-level. The structure of this paper is as follows. Section 2 explains our methodology for measuring net reproduction (marital and total). Sections 3 and 4 provide a descriptive analysis of historical developments in net reproduction. In section 5 we quantify the influence on net total reproduction of marital fertility, mortality, and nuptiality in each country. Finally, in section 6 we analyze the changing effect of mortality on net total reproduction over the demographic transition period.
2. Methodology and data
fertility index If,2 etc. Even much recent historical research that analyzes several
countries at a time (Ángeles 2010; Herzer, Strulik, and Vollmer 2012; Murtin 2013) still confines itself to using these indicators. However, historically speaking, the total number of children born in the Western world has depended not only on how many children married couples had on average but also on what percentage of women actually married, since the proportion of illegitimate births was very low. Figure 1 shows that, except in the case of Iceland, the percentage of births outside marriage was hardly ever above 10% before 1980. That is, access to marriage was traditionally a key mechanism in the process of regulating total fertility.
Trends in nuptiality (Im) during the demographic transition differed from one
country to another (for example, Sweden, Denmark, Norway, Canada, and Belgium saw much greater increases than Spain, Italy, Finland, and Austria over the 19th and 20th
centuries). If we want to identify the factors which led couples to have fewer children, using fertility indicators that measure the total birth rate is not the best strategy; rather, we should neutralize the effect of nuptiality by using indices which only measure marital fertility.
However, although important, distinguishing between marital and total fertility is insufficient: merely analyzing the intensity of births, total or marital, is not the most appropriate method. Parents’ main aim as far as reproduction is concerned was, and still is, to attain a number of surviving children who will reach adulthood, not to have a specific number of births. According to classic demographic transition theory, mortality change was a key factor in triggering the fertility decline, “based on the supposition that couples generally desired a given number of surviving children, and that fertility control was, at least originally, an effort to restore the balance in the family size that had been upset by declines in childhood mortality” (van de Poppel et al. 2012: 300).3
2 If is the ratio of the actual number of births to the hypothetical number if women were subject to the married
Hutterite fertility schedule (Coale and Watkins 1986: 153–162).
3 Generally, three different mechanisms are outlined to explain how the drop in childhood mortality may have
http://www.demographic-research.org 41 Figure 1: Percentage of births outside marriage
Source: See Appendix.
mortality and fertility and between nuptiality and mortality may have been adaptation mechanisms used by societies in historical times to regulate population growth. Many studies in historical demography using micro-level data after the Princeton Project have demonstrated replacement of deceased children with individual fertility life-course data (Bengtsson and Dribe 2006; Knodel 1988; van Bavel 2003, 2004; Reher and Sanz-Gimeno 2007; van Bavel and Kok 2010; van Poppel et al. 2012; Reher and Sandström 2015; Reher et al. 2017).
To conduct comparative studies between different countries over long periods of time it is also necessary to cancel out the effect of mortality on fertility, so we need an indicator which measures the number of surviving children in order to discover which factors might have a bearing on the long-term decline in reproductive behavior. It would be pointless to compare the intensity of births in different years or countries where the survival probabilities were very different. The net reproduction rate (NRR) better represents the extent of departure from the long-run historical equilibrium between mortality and fertility (Cleland 2001: 62). The calculation of the NRR affords us an opportunity to consider variations in all three major aspects of demographic behavior: fertility, mortality, and nuptiality.
Some previous studies focus on trends in the NRR in a small number of countries (Lotka 1936; Glass 1940, 1945; Hyrenius 1951; Smith 1972; Wrigley 1985a, 1985b; Wrigley et al. 1997; Chesnais 1998; Cummins 2009; Strulik and Weisdorf 2014; Cervellati and Sunde 2015), but no systematic comparative analysis as yet exists that covers a large number of countries. It is still more difficult to find research that considers NRR levels over a long period of time in several different countries.
We were unable to calculate the NRR for all the countries in our study because most of the historical sources we consulted do not provide the necessary age-specific fertility rates (nFx). Since the NRR is largely a function of marital fertility, nuptiality,
and mortality, the available data can be simply converted into an estimate of the NRR: We propose that the indicators for the intensity of total births (total fertility rate (TFR) and the Princeton overall fertility index (If)) should be weighted by the probability that
children would survive to age 25 (25p0).4 Thus:
TFR ×25p0
If×25p0
The idea of estimating the net reproduction rate by multiplying the gross reproduction rate (GRR) by the probability of survival to an age close to the mean age of childbearing has been known in demography for decades, and is explained in several
4 Wrigley (1985b: 144) makes an estimate very close to our proposal in his historical study of fertility in the
http://www.demographic-research.org 43 text books (Newell 1988: 110; Hinde 1998: 187). What we are doing in the indicators we propose here is assuming 25 years to be the mean age of childbearing, and using all births rather than just female births.
As expected, and as Table 1 shows, the coefficients of correlation between these two indices and the NRR are very close to 1. Various researchers, who are listed in the Appendix, calculated the historical values of the NRR as shown in Table 1. When we correlated these values with those of the indices that we built (TFR×25p0 and If×25p0)
we found extremely high correlations in different countries and at different periods of time. We therefore use the indices proposed here as a reliable approximation of the historical development of the values of the NRR. We shall call these the ‘indices of net total reproduction’ (since they are calculated by taking into account all births, both male and female, this is the main feature that differentiates them from the net reproduction rate).
Table 1: Correlation coefficients between the net reproduction rate (NRR) and the indices TFR ×25p0 and If ×25p0
TFR ×25p0 If×25p0
Denmark (1665–1840) 0.998
Denmark (1906–2009) 0.999 0.990
England (1541–1871) 0.998
England and Wales (1870–2009) 0.990 0.962
France (1901–2009) 0.998 0.968
Germany (1881–2009) 0.996 0.957
Italy (1901–2009) 0.998 0.991
Sweden (1816–2009) 0.998 0.962
USA (1935–2009) 0.991 0.942
Source: See Appendix.
As we pointed out above, it is essential to neutralize the effect of nuptiality on fertility, since the intensity and calendar of marriage in the various countries in this study are very different. If we want to analyze the factors that affect reproductive decisions among married couples, we must confine our analysis to births within marriage. One way of estimating an index of net marital reproduction is to weight the Princeton marital fertility index Ig5 with the probability of surviving to the age of 25
(25p0):
Ig×25p0.
5 Ig is the ratio of the number of births occurring to married women to the number that would occur if married
In this way, with the historical data gathered here, we analyze the evolution of the net reproduction indices (total and marital) over a long period of time in 25 countries.
For the purposes of this study, we collected information on fertility, mortality, and nuptiality in 25 developed countries over a very long period of time: Australia, Austria, Belgium, Canada, Czechoslovakia, Denmark, England and Wales, Finland, France, Germany, Greece, Hungary, Iceland, Ireland, Italy, Japan, the Netherlands, New Zealand, Norway, Portugal, Russia, Spain, Sweden, Switzerland, and the United States.6 The main line of the analysis in this article is based on national data, but we
also include some analyses (tables and graphs) based on provincial data for a much smaller number of countries. In the Appendix we provide a detailed list of the large number of sources that were consulted.
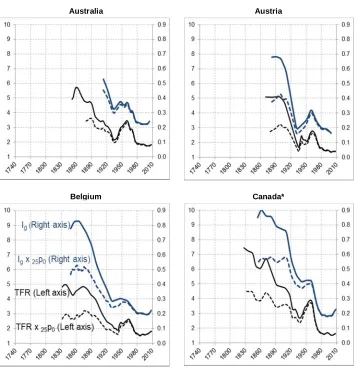
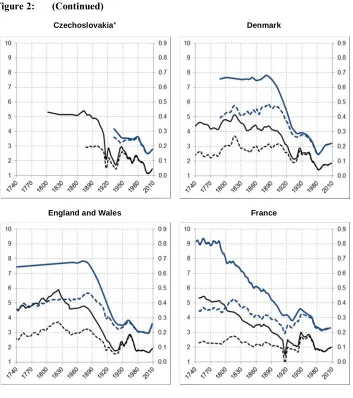
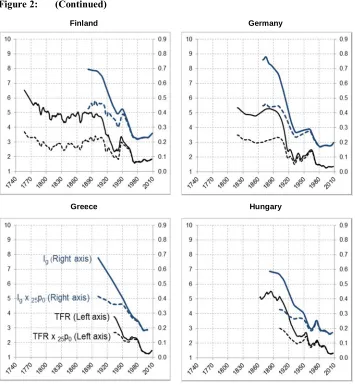
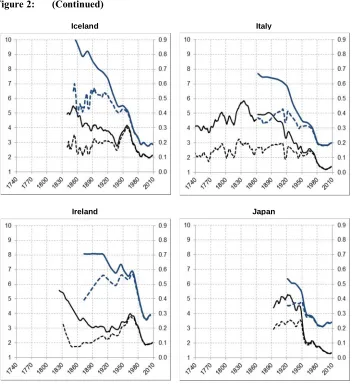
3. Description of the evolution of I
g(index of marital fertility) and
I
g×
25p
0(index of net marital reproduction)
In Figure 2 we can see the major differences between the indices, observing the historical development of the relative number of births (total and marital) with respect to net reproduction (total and marital). The history of the demographic transition is very different depending on which of these figures forms our starting point. For example, if we pay attention exclusively to indicators of the intensity of births, we would have to conclude that between 1800 and 1970 the marital fertility index (Ig) in France fell by
57% and the total fertility rate (TFR) by 46%. However, if we consider net marital or total reproduction (Ig ×25p0 or TFR ×25p0) we will see that the decline is much more
moderate (22% and 1.5%, respectively). Arguably, the latter should be the approach in most research on historical fertility. Although it is no easy task to obtain the information needed to calculate Ig ×25p0 for earlier historical periods, the data that is
available allows us to emphasize certain important aspects.
(a) Before the decline began, the values for Ig×25p0 were generally around 0.4–0.5.
We find higher values (0.5–0.6) in Western offshoot countries7 (Canada, New Zealand,
and probably also Australia and the USA).
(b) Before this index began to fall, there was a period of general growth. Often called the ‘ski–jump’ effect of the historic transition, this turnaround in net marital fertility took place during the second half of the 19th century (except in France, where it
happened in the late 18th and early 19th centuries) (van de Walle 1974: 179; Dyson and
6 We have included the largest number of countries for which we were able to find historical data of proven
reliability.
http://www.demographic-research.org 45 Murphy 1985). This pretransitional8 rise led some countries to reach levels as high as
those found in the Western offshoot countries. This general increase in the index of net marital reproduction was due to a rise in both marital fertility (Ig) and survival (25p0)
(the data from England and Wales, Norway, and Sweden is particularly revealing). (c) Some researchers (Galor 2005a, 2005b, 2012) have repeatedly pointed out that mortality began to fall in most Western countries long before the decline in fertility. As Table 2 shows (column B – A), although the difference between the dates of the fall in mortality and the fall in marital fertility was 17 years on average, there were countries in which both fell at practically the same time, while in others it took more than three decades for the effect to set in.9
(d) In the period of time between the onset of the declines in Ig ×25p0 and mortality
(25q0) (column C – A in Table 2 and Figure 2) we can clearly distinguish two phases. In
the first the initial decline in mortality was accompanied by an increase in the levels of marital fertility (Ig), which was surely due to the reduction of some of the limiting
factors related to ‘natural fertility’ (Henry 1961) as people’s health improved. Later, in a second phase (which in most countries lasted for some decades), couples began to limit their fertility to adapt to the new survival rates. However, it is very important to bear in mind that although the relative number of marital births (Ig) fell, the index of net
marital reproduction (Ig ×25p0) did not; that is, couples reduced their number of births
in order to adapt to the decreasing mortality rates.
When did the Ig and Ig25 × p0 indices begin to fall? To date the onset of the decline
in marital fertility, researchers involved in the PEFP chose to follow the criterion of identifying the year in which the Ig had fallen by 10% with respect to the typical plateau
observed before the fall (as long as the value of Ig did not subsequently return to the
level of the plateau) (Coale and Watkins 1986: 37). We followed the same criterion, but used the index of net marital reproduction (Ig ×25p0). By doing so, what we want to
pinpoint is not the moment at which couples reduced the number of births, but the corresponding figure for the number of children surviving to adulthood.10
8 By ‘pretransitional’ period we mean the period before an uninterrupted decline of 10% in the mortality rate
occurred.
9 In some countries these dates are merely indicative. If we were able to obtain earlier data it is highly likely
that we would have to modify the dates of the decline in some countries (for example, Portugal).
10 Some scholars have dropped the 10% rule (Bryant 2007; Casterline 2001) as a criterion for establishing the
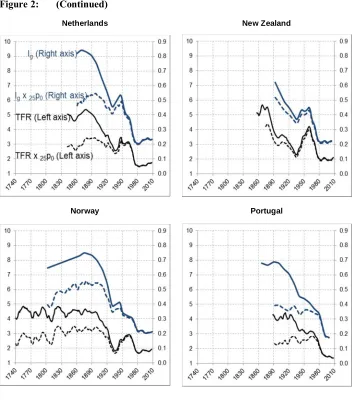
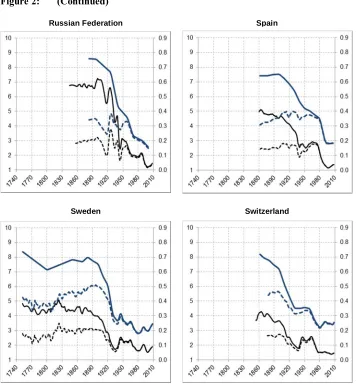
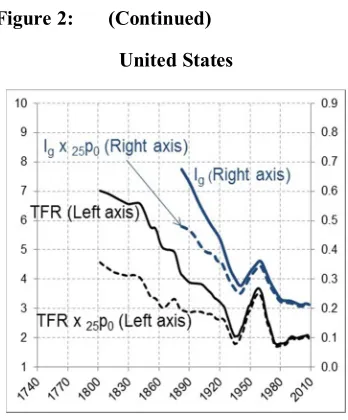
Figure 2: Development of different demographic indicators
Australia Austria
http://www.demographic-research.org 47 Figure 2: (Continued)
Czechoslovakia* Denmark
Figure 2: (Continued)
Finland Germany
http://www.demographic-research.org 49 Figure 2: (Continued)
Iceland Italy
Figure 2: (Continued)
Netherlands New Zealand
http://www.demographic-research.org 51 Figure 2: (Continued)
Russian Federation Spain
Figure 2: (Continued)
United States
Note:* The Canadian data from before 1921 refers only to Quebec. Although Czechoslovakia split into two different countries on 1 January 1993, the data displayed in this figure shows the two countries together. Data from before 1860 is only from the north of Italy.
Source: See Appendix.
The index of net marital reproduction declined in France in 1872, long before the other countries studied. Belgium followed 60 years later. England and Wales and the USA did so in 1897. New Zealand, Switzerland, and Germany followed before 1910. Between 1912 and 1930, 11 more countries joined them. Finally, the later countries followed suit from 1954 onwards: Japan, Greece, Portugal, Spain, and Ireland.
Table 2 shows the dates at which the 10% drop occurred for Ig and Ig ×25p0. The
discrepancies are quite striking (column C – B). On average, there is a difference of 22 years, although in some countries this is less than 10 while in others it is more than 50. That is, there are major time differences concerning the moment when married couples decided to reduce the number of births (Ig) (the criterion followed by the PEFP) and
when the index of net marital reproduction (Ig ×25p0) decreased (our own criterion of
http://www.demographic-research.org 53 Table 2: Dates at which the 10% fall in the different indices took place
A B C B – A C – B C – A
Country 25q0 Ig Ig ×25p0 Time differences
Australia 1893 – – – – –
Austria 1887 1907 1912 20 5 25
Belgium 1866 1880 1888 14 8 22
Canada 1871 1888 1916 17 28 45
Czechoslovakia 1893 – – – – –
Denmark 1852 1889 1913 37 24 61
England and Wales 1871 1892 1897 21 5 26
Finland 1894 1912 1916 18 4 22
France 1797 1797 1827 0 30 30
Germany 1891 1891 1910 0 19 19
Greece – – 1958 – – –
Hungary 1890 – 1917 – – 27
Iceland 1863 1864 1921 1 57 58
Ireland – 1922 1974 – 52 –
Italy 1887 1915 1928 28 13 41
Japan 1928 1943 1954 15 11 26
Netherlands 1874 1898 1915 24 17 41
New Zealand 1870 – 1904 – – 34
Norway 1877 1905 1915 28 10 38
Portugal 1900 1917 1966 17 49 66
Russian Federation – 1921 1930 – 9 –
Spain 1890 1920 1970 30 50 80
Sweden 1867 1904 1913 37 9 46
Switzerland 1882 1889 1908 7 19 26
United States 1869 – 1897 – – 28
Mean 1878 1898 1920 18.5 22.1 38.1
Median 1880 1904 1915 18.0 17.0 32.0
Note: Numbers in italics are reasonable estimates based on the information provided in the Appendix. The cases in which no data from sufficiently far back in time are available to accurately date when the fall began are left blank. The dates in column A were calculated from the information in Figure A-1 in the Appendix. The series published by Wrigley and Schofield (1981) shows an improvement in life expectancy from the first decade of the 19th century onwards for England and Wales, but these gains seem to have been lost between the 1820s and 1870s. Patterns in25q0 values indicate that there was no clear and continuous decline in
mortality until the mid-19th century. We therefore decided to take 1871 as the most appropriate date for the start of the decline in
mortality in England and Wales. Although Hofsten and Lundström (1976) for Sweden and Andersen (1979) for Denmark were able to establish a perceptible improvement in mortality rates from the late 18th century onwards, we preferred to set the start of the
demographic transition in the second half of the 19th century, which was when the decline became permanent and continuous. The
information published by James C. Riley proved very useful for our research (http://www.lifetable.de/RileyBib.htm).
Source: See Appendix.
It would be wrong to suppose that the fall in the number of births is a sign that couples desired to have fewer descendants.11 In most countries, even several years after
the decline in marital fertility (Ig) had set in, Ig ×25p0 did not fall, or even rose
11 Various studies using micro-level data have also reached this conclusion (Knodel 1988; van Bavel 2003,
(Figure 2). The index we choose to use for dating the decline in reproductive patterns may therefore lead us to draw very different assumptions regarding the causes of the demographic transition.
One of the PEFP’s main conclusions was that the vast majority of European provinces (except in France) witnessed a simultaneous decline in the level of marital fertility (Ig) around the year 1900 (Coale and Watkins 1986: 37). The ‘all-at-once’ view
has important implications for causality. As Guinnane (2011) indicates, some researchers maintain that this synchronous fertility transition serves as proof that economics has little to do with the fertility transition. Cleland and Wilson (1987: 18) maintain that “clearly the simultaneity and speed of the European transition makes it highly doubtful that any economic force could be found which was powerful enough to offer a reasonable explanation.”
However, “the key underlying issue in the [adjustment or innovation] debate was the simultaneity of mortality improvement, rather than that of fertility decline” (van Poppel et al. 2012: 303). Married women in the western world reduced their fertility (Ig)
as part of the adjustment process to the generalized drop in the level of mortality. If we look at the dates at which the index of net marital reproduction (Ig ×25p0) fell, we can
see that the variability is much greater than that for Ig (it is almost twice as high), which
means that it is very difficult to maintain the ‘all-at-once’ view which the PEFP defends (Table 3 and Figure 3). This is therefore another of the major disparities in the conclusions obtained when using one or other of these indices to analyze reproductive behavior.
Although in most countries the index Ig ×25p0 began to drop in the early decades
of the 20th century (see column C in Table 2), it is also true that in the 1960s–1970s this
index began to fall more quickly in almost all cases. This might be interpreted as a feature of what has sometimes been called the second demographic transition. Behind this second transition there is a shift in norms toward individualism, which is moving Europeans away from marriage and parenthood. It has been argued that new developments from the 1970s onward can be expected to bring about sustained subreplacement fertility (Lesthaeghe and van de Kaa 1986; Van de Kaa 1987).
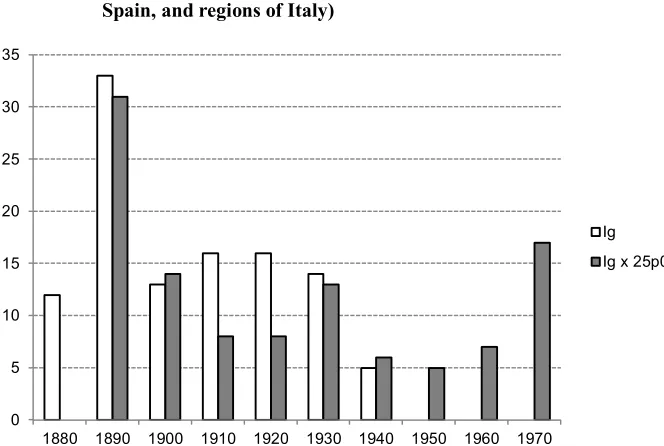
Table 3: Year of the 10% decline for each index (counties of England and Wales, provinces of Spain, and regions of Italy, all taken together)
25q0 Ig Ig×25p0
Mean 1881 1909 1927
Standard deviation 11.50 17.40 29.40 Coefficient of variation (in %) 0.61 0.91 1.53
N 109 109 109
http://www.demographic-research.org 55 Figure 3: Number of provinces according to the decade in which they
experienced a 10% drop in marital fertility and the index of net marital reproduction (counties of England and Wales, provinces of Spain, and regions of Italy)
Note: The same provinces are represented in the histograms measuring Ig and Ig x25p0. Source: See Appendix.
4. Description of the evolution of the index of net total reproduction
(TFR ×
25p
0): From the ‘three-child pattern’ to the ‘two-child
pattern’
In spite of the fact that the social, geographical, economic, cultural, political, and demographic circumstances of the 25 countries that we have analyzed are all different, it is striking that during the pretransitional period almost all of them had a value for the index of net total reproduction (TFR ×25p0) which was around 3 (Figure 2). That is,
although there were major differences in marital fertility, mortality, and nuptiality, the values for TFR ×25p0 were very similar in all the countries. The differences in marital
fertility between countries were balanced out by mortality and nuptiality, resulting in fairly similar values of net total reproduction. In his historical analysis of fertility in France, Wrigley (1985a: 54) found that “the tendency of changes in French nuptiality,
0 5 10 15 20 25 30 35
1880 1890 1900 1910 1920 1930 1940 1950 1960 1970 Ig
fertility and mortality to interact in such a way as to keep the NRR very close to unity […] is of especial interest given the history of mortality in France as the nineteenth century developed.” Although marital fertility, nuptiality, and mortality varied substantially during the pretransitional period, the overall changes in their combined effect were very small. According to Wrigley (1985b: 162), “a strong ‘cancelling out’ effect was evidently at work” between these three variables. “Changes in nuptiality and marital fertility must have been sensitive, so to speak, to each other’s trends, and jointly sensitive to mortality change” (Wrigley 1985b: 165). This same equilibrium (population homeostasis) can be observed in the developments in the index of net total reproduction (TFR ×25p0) in the other countries analyzed before the historical decline
set in (Figure 2). In the long run, mortality and total fertility must be associated, as otherwise a population would either grow explosively or become extinct.
As Figure 4 shows, in the pretransitional period and until the mid-20th century the
coefficient of variation values of the TFR were much higher than those of the TFR ×25p0. That is, when we only consider fertility rates, the differences observed
between countries are considerable. On the other hand, when we take into account the combined effect of fertility, mortality, and nuptiality (net total reproduction), the divergences are not so marked. Nonetheless, we should not minimize the difference between ‘high-pressure’ and ‘low-pressure’ demographic regimes in pretransition societies. It has been known for decades that some pretransitional societies had high fertility and high mortality, whereas others had low fertility and low mortality, even though population growth rates were low everywhere. Societies with high fertility and high mortality were often very different from societies with low fertility and low mortality, both in the social and economic context which gave rise to the demographic regimes, and in the consequences of those regimes for economic development.
In the countries for which we have data that goes back a long way, we can observe great stability in the levels of TFR ×25p0 and an upward trend just before the long-term
decline set in (rather similar to the pattern observed for Ig ×25p0). Although, in general,
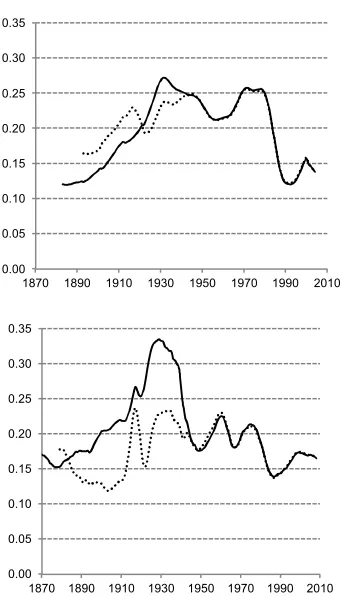
http://www.demographic-research.org 57 Figure 4: Trends in values for coefficient of variation of various demographic
indicators in a group of western countries
Note: N ≥ 21.
Source: See Appendix.
We can also see that in the mid-20th century, decades after the decline set in, there
was a notable rise in the values of the index of net total reproduction (the ‘baby boom’). Increases in the index of net total reproduction (TFR ×25p0) (around 57%) were nearly
three times those of the index of net marital reproduction (Ig ×25p0) (21%) because in
those years a major rise in nuptiality accompanied the increase in marital fertility; that is, the so-called baby boom happened not only because married women took the step of having more children, but above all because a much greater proportion of women actually got married and because the age at marriage fell (‘marriage boom’). As Wrigley (1985a: 40) points out, “the behavior of a measure of general fertility […] is
0.00 0.05 0.10 0.15 0.20 0.25 0.30 0.35
1870 1890 1910 1930 1950 1970 1990 2010
Ig
Ig x 25p0
0.00 0.05 0.10 0.15 0.20 0.25 0.30 0.35
1870 1890 1910 1930 1950 1970 1990 2010
not necessarily a good guide to changes in marital fertility. Changes in the timing and prevalence of marriage may have a powerful influence on general fertility even though marital fertility changes little or not at all.”
The sharp fall in values for TFR ×25p0 that started around 1960 has still not
reached bottom in some countries. Some of them have managed to halt this decline at around two children surviving until adulthood per woman. Japan and the Southern, Eastern and Central European countries (Germany, Switzerland, and Austria) are well below this level.
5. Quantification of the influence of marital fertility, mortality, and
nuptiality on net total reproduction during the demographic
transition
We can estimate the specific weight of Ig (marital fertility), Im (female nuptiality), and 25p0 (survival level) on trends in the values of net total reproduction (measured by
If ×25p0) during the demographic transition. Our objective in this section, therefore, is
to identify the relative importance of any changes in marital fertility, nuptiality, and mortality in influencing the net total reproduction in each country. First, we shall explain how we calculated this.
The Princeton indices relate to each other as follows (Coale and Watkins 1986):
If = [Ig × Im] + [Ih × (1–Im)].
Ih refers to the index of illegitimate births. When these only account for a tiny
fraction of the total number of births, overall fertility can be represented simply as the product of marital fertility and the proportion of women who are married (Im). We refer
to overall fertility, not including illegitimate births, using the notation I’f:
I’f = [Ig × Im].
If we weight the fertility indices by the probability of survival to age 25, as we proposed in the methodological section of this article, we find that:
I’f ×25p0 = Ig ×25p0 × Im.
Taking into account this relationship, column 1 of Table 4 shows the mean differences for the index I’f ×25p0 between the values observed each year with respect
http://www.demographic-research.org 59 (all values expressed in relative terms; value for initial year = 100).12 Column 2 shows
the value which variable I’f ×25p0 would have reached if Ig had been constant with the
same value as that observed in the year when the transition started. Columns 3 and 4 perform the same calculation for variables 25p0 and Im, respectively. Columns 1 to 4
show what the mean differences within countries averaged over a range of years. Let us take the example of Austria to illustrate this approach. In Austria the demographic transition began in 1887. Between then and 1970 the average annual difference between I’f ×25p0 and the value of I’f ×25p0 in 1887 was –21.3% (that is,
over the years 1888–1970, I’f ×25p0 in Austria was on average 21.3% lower than it was
in 1887) (see column 1). We now consider a hypothetical scenario in which the Austrian Ig remained at its 1887 level, and25p0 and Im changed as they actually did in
Austria. In such a scenario, over the years 1888–1970 the I’f ×25p0 in Austria would
have been on average 43.9% higher than it was in 1887 (because of increased survivorship and increased marriage) (see column 2). Now consider a hypothetical scenario in which Austrian mortality remained at its 1887 level, and Ig, and Im changed
as they actually did in Austria. In such a scenario, over the years 1888–1970 the I’f ×25p0 in Austria would have been on average 39.2% lower than it was in 1887
(because of reduced fertility within marriage and changes in nuptiality) (see column 3). Finally, consider a hypothetical scenario in which Austrian nuptiality (Im) remained at
its 1887 level, and the Ig and 25p0 changed as they actually did in Austria. In such a
scenario, over the years 1888–1970 the I’f ×25p0 in Austria would have been on average
24.6% lower than it was in 1887 (because of reduced fertility within marriage and changes in mortality) (see column 4).
Columns 5, 6, and 7 show the estimation of the incidence of the different variables on the long-term development of I’f ×25p0 and are calculated by subtracting the values
in columns 2, 3, and 4 from those in column 1. The difference between the value which would have occurred if one of the variables (Ig, 25p0, or Im) that influenced the
development of I’f ×25p0 had remained constant (columns 2, 3, and 4) and the value of
the mean differences within countries observed for I’f ×25p0 (column 1) allows us to
obtain a reasonable estimate of the specific weight of each of these variables (Ig,25p0,
and Im) over the development of I’f ×25p0 during the demographic transition.
What columns 5, 6, and 7 tell us is that it was the decline in marital fertility (Ig)
that most conditioned the value of net total reproduction (I’f ×25p0). This would have
increased on average by 54.9% if the values of Ig for the first year of the transition had
been maintained. If survival rates (25p0) had remained constant, the value of I’f ×25p0
12 The transition was taken to start in the year when the value of25q0 fell by 10% (as long as the value of25q0
would have fallen by 18.1%. Finally, the marriage index was the variable with the most modest influence on the net total reproduction. If the value of Im in the first year of the
transition had been maintained it would only have reduced the values of I’f ×25p0 by
6.5%. If in the pretransitional stage the control over total fertility was basically exercised by marriage, once the transition had begun, control over fertility came to be exerted within marriage (Wrigley 1985b: 164).
Once again, analysis of the data from each country reveals a considerable degree of heterogeneity in the demographic patterns adopted in the Western world over the demographic transition period. While in Ireland, Spain, New Zealand, Italy, and Portugal the influence of the drop in marital fertility (Ig) was moderate, in Denmark,
Germany, and particularly France and Belgium, it was very high. The increase in survival (25p0) had only a modest effect in New Zealand, England and Wales, the USA,
Norway, and Finland, while in France, the Netherlands, Italy, Spain, Belgium, and, above all, Ireland, it was much more intense. Ireland is the only country where gains in survival (25p0) had an effect on I’f ×25p0 greater than that of the fall in marital fertility
(Ig).
As for marriage, although we have already pointed out that its effect on I’f ×25p0
was much less pronounced than that of the other two variables, there are still noteworthy differences between countries. Whereas in France, Denmark, Canada, and especially Belgium the nuptiality values considerably softened the drop in I’f ×25p0, in
Spain they exacerbated this fall considerably. In most countries Im had practically no
effect (Austria, Finland, and Italy), or only a very minor one.
The figures for each country displayed in the different columns in Table 4 are the average values observed for the whole period of the demographic transition. The use of mean values has the great advantage that one number summarizes the changes in a given variable over a specific period, although these mean values necessarily conceal the variability that occurred in that period. To compensate for this limitation, Figure A-3 in the Appendix shows the annual development of the values in columns 5, 6, and 7 in Table 4. This enables us to see the different impact of variables Ig, 25p0, and Im on
http://www.demographic-research.org 61 Table 4: Estimate of the influence of variables Ig,25p0, and Im on the evolution
of the index of net total reproduction (I’f ×25p0) over the demographic transition period (in percentage)
Demographic transition Mean difference
New value of mean difference of I'f ×25p0
when base value of the following
variable is kept constant
Estimate of incidence of different variables on evolution of I'f ×25p0
I'f ×25p0 Ig 25p0 Im Ig 25p0 Im
Country Start End Length (1) (2) (3) (4) (5)=(2)–(1) (6)=(3)–(1) (7)=(4)–(1) Austria 1887 1970 83 –21.3 43.9 –39.2 –24.6 65.3 –17.9 –3.3 Belgium 1866 1970 104 –13.2 92.8 –34.7 –35.9 106.1 –21.5 –22.6 Canada 1871 1970 99 –2.0 58.9 –20.9 –18.6 60.8 –18.9 –16.7 Denmark 1852 1970 118 –3.0 63.7 –23.8 –19.1 66.7 –20.9 –16.1 England and
Wales
1871 1970 99 –25.2 39.8 –39.6 –29.1 65.0 –14.4 –3.9
Finland 1894 1970 76 –18.9 21.9 –31.6 –17.3 40.7 –12.7 1.5 France 1797 1970 173 –10.9 89.5 –45.0 –23.4 100.5 –34.0 –12.5 Germany 1891 1970 79 –23.4 45.0 –39.4 –29.0 68.4 –16.0 –5.7 Ireland 1873 1970 97 28.4 44.4 –13.7 33.2 16.0 –42.1 4.7 Italy 1887 1970 83 –1.6 35.0 –25.2 0.4 36.6 –23.6 2.0 Netherlands 1874 1970 96 2.0 59.6 –25.5 –8.0 57.6 –27.5 –10.0 New Zealand 1893 1970 77 –13.4 21.4 –20.8 –21.4 34.8 –7.4 –8.0 Norway 1877 1970 93 –10.8 41.2 –23.1 –21.8 52.0 –12.3 –11.0 Portugal 1900 1970 70 –0.6 36.2 –18.7 –7.9 36.8 –18.1 –7.2 Spain 1904 1970 66 –3.8 23.2 –26.7 6.4 26.9 –22.9 10.2 Sweden 1867 1970 103 –10.4 50.7 –28.6 –18.6 61.2 –18.1 –8.2 Switzerland 1882 1970 88 –13.1 36.3 –28.9 –18.8 49.4 –15.8 –5.7 USA 1882 1970 88 –20.7 31.6 –32.8 –26.4 52.3 –12.1 –5.7
Mean * –9.0 46.4 –28.8 –15.6 55.4 –19.8 –6.6
Median –10.9 42.5 –27.6 –19.0 54.9 –18.1 –6.5
* The mean values may be problematic, as they are obtained using unweighted values from all countries (with populations of very different sizes).
Note: See explanations in text. The years of the demographic transition for Ireland, New Zealand, and the United States were set as above because no earlier information was available concerning the Princeton indices.
6. Nonhomogeneous effect of mortality on net total reproduction
during the demographic transition
Considerable confusion persists among demographers regarding the role of reductions in mortality as a driver of fertility transition. One of the PEFP’s main conclusions was that we cannot deduce from the aggregate data gathered for the provinces in Europe that the declines in mortality led to the subsequent fall in fertility (van de Walle 1986: 233). Many other researchers have reached the same conclusion (Watkins 1986: 436; Knodel 1974: 167–185; Lesthaeghe 1977: 171–176; Teitelbaum 1984; Haines 1998). Recent quantitative and empirical evidence (Doepke 2005; Fernández-Villaverde 2001; Murphy 2009) has also shed light on the negligible role of declining mortality in accounting for falling fertility. Nonetheless, many authors have stressed the special role played by mortality in the fertility transition (Mason 1997; Galloway, Lee, and Hammel 1998; Cleland 2001; Reher and Sanz-Gimeno 2007; Dyson 2010; van Poppel et al. 2012; Schellekens and van Poppel 2012; Sánchez-Barricarte 2017a). Recently, Ángeles (2010), Herzer, Strulik, and Vollmer (2012), and Murtin (2013), using panel data analyses covering long time periods, have shown that mortality rates are a statistically significant predictor of total fertility rates.
Reher et al. (2017) address the role of mortality in reproductive decision-making during the demographic transition using microdata on individual reproductive histories from Spain, Sweden, and the Netherlands. They found that couples were continuously regulating their fertility to achieve reproductive goals, thus providing an important contribution to the literature on the role of mortality in reproductive behavior. They show that couples that lost a child had a higher probability of having another child.
Van Bavel and Kok (2010), using three elaborate family reconstructions covering two provinces of the Netherlands in the period 1825–1885, find that pretransition couples indeed spaced their births during roughly the first ten years of marriage. Bengtsson and Dribe (2006), using survival analysis on a longitudinal dataset at the individual level combined with food prices, also find that families in a rural population in Sweden controlled the timing of childbirth before the fertility transition. Van Bavel (2004), using three birth cohorts that lived in 19th century Leuven (Belgium), finds that
birth intervals were not merely a function of natural fertility differences but that families’ strategic spacing behavior also played a role. He finds that the death of the last child more or less doubles the hazard rate of conception.
http://www.demographic-research.org 63 and Sunde 2015; Sánchez-Barricarte 2017a, 2017b), although only Luis Ángeles (2015) analyzes the effect of mortality rates on net total reproduction.
Figures 5 and 6 show the changes in the correlation between mortality (25q0) and
net marital and total reproduction (Ig ×25p0 and If ×25p0, respectively) at the provincial
level in seven European countries.13 We can see that the effect of mortality on net
reproduction was not homogeneous throughout the different phases of the transition. The two figures show that in the pretransitional stage and in the first decades after the onset of the transition the relationship was clearly negative: When mortality was high, women needed to use all their fertile years to have children. The latent demand for children surviving into adulthood was high, and therefore those provinces with the highest mortality were also those with the lowest net reproduction.
As the transition progressed and mortality rates underwent a certain improvement, the effect of mortality on net reproduction became less negative, or even zero. As Ángeles (2015: 13) states, “the effect may even become positive if some additional mechanism is in place, such as hoarding or the quantity – quality tradeoff, which would make net fertility directly a function of mortality rates.” Indeed, in Figures 5 and 6 we can see that in the last decades of the fertility transition the correlations between the two variables have high positive signs.
There is a strong positive relationship between the moment when these correlations changed sign (from negative to positive) and the point at which the drop in mortality rates began in the different countries in question (Table 2): The countries in which the drop in mortality began earlier were also those that first experienced the change in the sign of the correlations set out in Figures 5 and 6 (regarding both net marital and total reproduction).
The time frame over which the relationship changes from negative to positive varies enormously, especially when Ig ×25p0 is plotted (Figure 5) rather than when
If ×25p0 is shown (Figure 6). This is because the values of Ig have greater variability
than those of If. Over a large part of the demographic transition the nuptial system was
very flexible in Western Europe. Age at marriage and the proportion of people who remained single varied greatly. Nuptiality certainly played an important role in regulating the total number of births. As Wrigley (1985a: 46) states, “the most distinctive regulatory mechanism among west European populations of the early modern period was marriage.” Mortality and nuptiality therefore acted together to balance out the major differences between provinces in marital fertility rates, and therefore to produce values of If ×25p0 that were much more similar.14
13 The Appendix provides the sources of the provincial data for the seven countries where we obtained
information about mortality levels (25q0) and fertility levels (If, Ig) within provinces.
14 “Where mortality was unusually high or marital fertility unusually low, nuptiality tended to be high, and
Figure 5: Correlation coefficients between the index of net marital reproduction (Ig x25p0) and mortality (25q0) (provincial level)
Source: See Appendix.
Figure 6: Correlation coefficients between the index of net total reproduction (If x25p0) and mortality (25q0) (provincial level)
Source: See Appendix.
http://www.demographic-research.org 65
7. Conclusions
Our analysis of net reproduction has provided a view of the demographic transition that diverges considerably from that presented in traditional studies based on trends in the fertility rate alone (marital or total). Regardless of whether the ultimate aim is to compare marital fertility patterns in different countries or to undertake a detailed study of a single country over a long time period during which mortality rates have undergone major changes, it is essential to use an index of net marital reproduction. There is little point in analyzing fertility trends if we leave out the mortality scenario that forms the background to these tendencies.
The net total reproduction indicators that we have used in this study have enabled us to show that the differences in the pretransitional era were not as great as those which appear when we look only at fertility: Both nuptiality and mortality play a part in tempering these contrasts.
Our analysis of net marital reproduction has enabled us to challenge the idea, widely accepted in the ambit of the PEFP, that the fertility transition happened at almost the same time across all European provinces. On the contrary, we found major diversity concerning the time point at which couples began to reduce the number of children who actually survived to become adults.
We were also able to quantify the different roles played by marital fertility, mortality, and nuptiality in net total reproduction trends. We found that nuptiality was the variable that had the least impact.
Lastly, we also show the existence of a nonhomogeneous effect of mortality on net reproduction. On the basis of provincial data from seven European countries, we found that mortality had a changing effect over the years of the demographic transition: negative during the pre- and peritransitional phases, and positive during the final stage of the transition.
References
Alter, G. (1988).Family and the female life course: The women of Verviers, Belgium, 1849–1880. Madison: The University of Wisconsin Press.
Andersen, O. (1979). The development of Danish mortality, 1735–1850.Scandinavian Population Studies 5: 9–21.
Anderson, M., Ó Gráda, C., Wrigley, E., and Woods, R. (2001). Las Islas Británicas [The British isles]. In: Bardet, J.P. and Dupâquier, J. (eds.). Historia de las poblaciones de Europa: II. La revolución demográfica, 1750–1914 [History of the populations of Europe: II. The demographic revolution, 1750–1914]. Madrid: Síntesis: 291–308.
Andreev, E., Darskij, L., and Kharkova, T. (1992). L’histoire de la population de l’URSS, 1920–1959.Annales de Demographie Historique 1992(1): 61–150. Ángeles, L. (2010). Demographic transitions: Analyzing the effects of mortality on
fertility. Journal of Population Economics 23(1): 99–120. doi:10.1007/s00148-009-0255-6.
Ángeles, L. (2015). Tracking how mortality affects fertility along the demographic transition. Paper presented at the 11th European Historical Economics Society
Conference 2015, Pisa, Italy, September 4–5, 2015.
Bengtsson, T. and Dribe, M. (2006). Deliberate control in a natural fertility population, Southern Sweden, 1766–1864. Demography 43(4): 727–746.doi:10.1353/dem. 2006.0030.
Blanes, A. (2007). La mortalidad en la España del siglo XX: Análisis demográfico y territorial [Child mortality in Spain in the 20th century: Demographic and
territorial analysis] [PhD thesis]. Barcelona: Universidad Autónoma de Barcelona, Departamento de Geografía.
Blayo, Y. (1975). La mortalité en France de 1740 à 1829 [The mortality in France from 1740 to 1829].Population 30(1): 123–142.doi:10.2307/1530647.
Blum, A. and Troitskaja, I. (1996). La mortalité en Russie aux XVIIIe et XIXe siècles: Estimations locales à partir des Revizii [Mortality in Russia in the 18th and 19th
http://www.demographic-research.org 67 Bogue, D. (1993). Empirical interrelationships among standard fertility measures. In: Bogue, D., Arriaga, E., Anderton, D., and Rumsey, G. (eds.). Readings in population research methodology: Fertility research. Chicago: Social Development Center: 11–53.
Bonneuil, N. (1997). Transformation of the French demographic landscape, 1806– 1906. Oxford: Clarendon Press. http://table_mortalite_bonneuil.site.ined.fr/en/ presentation/.
Bourbeau, R., Légaré, J., and Émond, V. (1997). New birth cohort life tables for Canada and Quebec, 1801–1991. Ottawa: Statistics Canada, Demography Division. http://dsp-psd.pwgsc.gc.ca/Collection/Statcan/91F0015M/91F0015MI E1997003.pdf.
Boyle, P. and Ó Gráda, C. (1986). Fertility trends, excess mortality, and the Great Irish Famine.Demography 23(4): 543–562.
Brunborg, H. (1976). The inverse projection method applied to Norway, 1735–1974 [unpublished manuscript]. Oslo: Statistics Norway.
Bryant, J. (2007). Theories of fertility decline and the evidence from development indicators.Population and Development Review 33(1): 101–127.doi:10.1111/j.1 728-4457.2007.00160.x.
Calot, G., Confesson, A., Sardon, J.P., Baranzini, E., Cotter, S., and Wanner, P. (1998). Two centuries of Swiss demographic history: Graphic album of the 1860–2050 period. Neuenburg: Swiss Federal Statistical Office.
Campbell, H. (1973). Net reproduction-rate in England and Wales. Lancet302(7838): 1143.doi:10.1016/S0140-6736(73)90951-3.
Carrilho, M.J. (1980). Tábuas abreviadas de mortalidade, 1941–1975 [Abridged life tables, 1941–1975]. Lisbon: Imprensa Nacional ‒ Casa da Moeda.
Casterline, J. (2001). The pace of fertility transition: National patterns in the second half of the twentieth century. Population and Development Review 27(Supplement): 17–52.
Centro de Estudos Demográficos (1976). Tábuas abreviadas de mortalidade distritais e regionais, 1959–1962 e 1969–1972 [Abridged life tables by districts and regions, 1959–1962 and 1969–1972]. Lisbon: Instituto Nacional de Estatística.
Chesnais, J.C. (1992). The demographic transition: Stages, patterns, and economic implications. New York: Oxford University Press.
Chesnais, J.C. (1998). Below-replacement fertility in the European Union (EU–15): Facts and policies, 1960–1997. Review of Population and Social Policy 7: 83–101.
Cleland, J. (2001). The effects of improved survival on fertility: A reassessment. Population and Development Review27 (Supplement): 60–92.
Cleland, J. and Wilson, C. (1987). Demand theories of the fertility transition: An iconoclastic view. Population Studies 41(1): 5–30. doi:10.1080/003247203100 0142516.
Coale, A. and Demeny, P. (1983).Regional model life tables and stable populations. New York: Academic Press.doi:10.1016/B978-0-12-177080-8.50007-X. Coale, A. and Watkins, S. (1986). The decline of fertility in Europe. Princeton:
Princeton University Press.http://opr.princeton.edu/archive/pefp/.
Cónin, C., Marques, A., and Pinto, J. (1988). Tábuas abreviadas de mortalidade, distritos e regiões autónomas, 1979–1982 [Abridged life tables, districts and autonomous regions, 1979–1982]. Lisbon: Centro de Estudos Demográficos, Instituto Nacional de Estatística.
Cummins, N. (2009). Why did fertility decline? An analysis of the individual level economic correlates of the nineteenth century fertility transition in England and France [PhD thesis]. London: London School of Economics, Department of Economic History.
Davenport, R. (2016). Urban family reconstitution – a worked example. Local Population Studies 96: 28–49.doi:10.2307/2732014.
Davis, K. (1963). The theory of change and response in modern demographic history. Population Index 29(4): 345–366.
Doepke, M. (2005). Child mortality and fertility decline: Does the Barro–Becker model fit the facts? Journal of Population Economics 18(2): 337–366. doi:10.1007/ s00148-004-0208-z.
http://www.demographic-research.org 69 Dopico, F. and Reher, D. (1998). El declive de la mortalidad en España, 1860–1930 [The decline of mortality in Spain, 1860–1930]. Huesca: Asociación de Demografía Histórica.
Dyson, T. (2010).Population and development: The demographic transition. London: Zed Books.
Dyson, T. and Murphy, M. (1985). The onset of fertility transition. Population and Development Review 11(3): 399–440.doi:10.2307/1973246.
Fernández-Villaverde, J. (2001). Was Malthus right? Economic growth and population dynamics. Pennsylvania: University of Pennsylvania (PIER working paper 01-046).doi:10.2139/ssrn.293800.
Galloway, P. (1994). A reconstruction of the population of North Italy from 1650 to 1881 using annual inverse projection with comparison to England, France, and Sweden. European Journal of Population 10(3): 223–274.
Galloway, P., Lee, R., and Hammel, E. (1998). Infant mortality and the fertility transition. In: Montgomery, M. and Cohen, B. (eds.). From death to birth: Mortality decline and reproductive change. Washington, D.C.: National Academy Press: 182–226.
Galor, O. (2005a). From stagnation to growth: Unified growth theory. In: Aghion, P. and Durlauf, S.N. (eds.).Handbook of economic growth. Amsterdam: Elsevier: 171–293.doi:10.1016/S1574-0684(05)01004-X.
Galor, O. (2005b). The demographic transition and the emergence of sustained economic growth. Journal of the European Economic Association 3(2–3): 494–504.doi:10.1162/jeea.2005.3.2-3.494.
Galor, O. (2012). The demographic transition: Causes and consequences. Cliometrica 6(1): 1–28.doi:10.1007/s11698-011-0062-7.
Glass, D.V. (1940). Population policies and movements in Europe. Economic Journal 50(200): 488–490.doi:10.2307/2226211.
Glass, D.V. (1945). Reproduction rates of France and Spain: A survey of recent literature.Eugenics Review 37(2): 61–64.
Guinnane, T. (2011). The historical fertility transition: A guide for economists.Journal of Economic Literature 49(3): 589–614.doi:10.1257/jel.49.3.589.
Hacker, J. (2010). Decennial life tables for the white population of the United States, 1790–1900.Historical Methods 43(2): 45–79.
Haines, M. (1998). The relationship between infant and child mortality and fertility: Some historical and contemporary evidence for the United States. In: Montgomery, M. and Cohen, B. (eds.).From deaths to births: Mortality decline and reproductive change. Washington, D.C.: National Academy Press: 227–253. Haines, M.R. and Steckel, R.H. (2000). The population history of North America.
Cambridge: Cambridge University Press.
Henripin, J. (1972). Trends and factors of fertility in Canada. Ottawa: Statistics Canada. http://publications.gc.ca/collections/collection_2017/statcan/CS99-541-1972-eng.pdf.
Henry, L. (1961). Some data on natural fertility. Eugenics Quarterly 8(2): 81–92.
doi:10.1080/19485565.1961.9987465.
Herzer, D., Strulik, H., and Vollmer, S. (2012). The long-run determinants of fertility: One century of demographic change, 1900–1999.Journal of Economic Growth 17(4): 357–385.doi:10.1007/s10887-012-9085-6.
Hinde, A. (1998).Demographic methods. London: Arnold.
Hofsten, E. and Lundström, H. (1976).Swedish population history: Main trends from 1750 to 1970. Stockholm: Liber.
Hogben, L. (1938).Political arithmetic: A symposium of population studies. New York: Routledge.
Hungarian Central Statistical Office (1992). Time series of historical statistics, 1867– 1992. Budapest: Hungarian Central Statistical Office.
Hyrenius, H. (1951). Reproduction and replacement. Population Studies 4(4): 421–431.
doi:10.1080/00324728.1951.10416787.
Imhof, A. (1990).Lebenserwartungen in Deutschland vom 17. bis 19. Jahrhundert[Life expectancies in Germany from the 17th to the 19th century]. Weinheim: Acta
Humaniora.
Johansen, H. (2002).Danish population history, 1600–1939. Odense: University Press of Southern Denmark.
http://www.demographic-research.org 71 Kirk, D. (1996). Demographic transition theory. Population Studies 50(3): 361–387.
doi:10.1080/0032472031000149536.
Knodel, J. (1974).The decline of fertility in Germany, 1871–1939. Princeton: Princeton University Press.
Knodel, J. (1978). European populations in the past: Family-level relations. In: Preston, S.H. (ed.). The effects of infant and child mortality on fertility. New York: Academic Press: 21–45.
Knodel, J. (1988). Demographic behavior in the past: A study of fourteen German village populations in the eighteenth and nineteenth centuries. Cambridge: Cambridge University Press.doi:10.1017/CBO9780511523403.
Knodel, J. and Van de Walle, E. (1967). Breast feeding, fertility, and infant mortality: An analysis of some early German data. Population Studies 21(2): 109–131.
doi:10.2307/2172715.
Kollega, T.I. (1996). Magyarország a XX században [Hungary in the 20st century]. Szekszárd: Babits.
Kuczynski, R. (1942). The new population statistics. Cambridge: Cambridge University Press.
Lesthaeghe, R. (1977). The decline of Belgian fertility, 1800–1970. Princeton: Princeton University Press.
Lesthaeghe, R. and Van de Kaa, D. (1986). Twee demografische transities? [Two demographic transitions?] In: Lesthaeghe, R. and Van de Kaa, D. (eds.). Bevolking-groei en krimp, mens en maatschappij [Population growth and shrinkage, people, and society]. Deventer: Van Loghum Slaterus: 9–24.
Livi-Bacci, M. (1968). Fertility and nuptiality changes in Spain from the late 18th to the
early 20th century. Population Studies 22: 83–102 and 211–234. doi:10.1080/
00324728.1968.10405536.
Lotka, A. (1936). Modern trends in the birth rate.Annals of the American Academy of Political and Social Science 188(1): 1–13.doi:10.1177/000271623618800102. Lutz, W. (1987). Finnish fertility since 1722: Lessons from an extended decline.
Helsinki: The Population Research Institute.
Mason, K. (1997). Explaining fertility transitions. Demography 34(4): 443–454.
doi:10.2307/3038299.
Matthiessen, P.C. and McCann, J.C. (1978). The role of mortality in the European fertility transition: Aggregate-level relations. In: Preston, S.H. (ed.). The effects of infant and child mortality on fertility. New York: Academic Press: 47–68. Matthiessen, P.C. (1985). The limitation of family size in Denmark I–II. Copenhagen:
Royal Danish Academy of Science and Letters.
Mitchell, B.R. (2007a). International historical statistics: Africa, Asia, and Oceania, 1750–2005. Houndmills: Palgrave MacMillan.
Mitchell, B.R. (2007b). International historical statistics: The Americas, 1750–2005. Houndmills: Palgrave MacMillan.
Mitchell, B.R. (2007c). International historical statistics: Europe, 1750–2005. Houndmills: Palgrave MacMillan.
Murphy, T. (2009). Old habits die hard (sometimes): What can département heterogeneity tell us about the French fertility decline? Milano: Bocconi University (IGIER working paper 364).
Murtin, F. (2013). The long-term determinants of the demographic transition, 1870– 2000. Review of Economics and Statistics 95(2): 617–631.doi:10.1162/REST_ a_00302.
Nazareth, M. (1977). Tábuas abreviadas de mortalidade globais e regionais: 1929– 1932, 1939–1942 e 1949–1952 [Global and regional abridged life tables: 1929– 1932, 1939–1942, and 1949–1952]. Lisbon: Centro de Estudos Demográficos, Instituto Nacional de Estatística.
Needleman, L. (1986). Canadian fertility trends in perspective. Journal of Biosocial Science 18(1): 43–56.doi:10.1017/S0021932000006489.
Newell, C. (1988).Methods and models in demography. London: Belhaven.
Notestein, F.W. (1945). Population: The long view. In: Schultz, T.W. (ed.). Food for the world. Chicago: University of Chicago Press: 36–57.
Ó Gráda, C. (1979). The population of Ireland, 1700–1900: A survey. Annales de Démographie Historique 1979(1): 281–299.doi:10.3406/adh.1979.1425. Palloni, A. and Rafalimanana, H. (1999). The effects of infant mortality on fertility
revisited: New evidence from Latin America. Demography 36(1): 41–58.
http://www.demographic-research.org 73 Pool, I. (1982). Is New Zealand a healthy country? The centenary of Dr. Alfred Newman’s affirmation ‘that it is yet the healthiest on the face of the globe.’New Zealand Population Review 8(2): 2–27.
Pool, I. (1985). Mortality trends and differentials. New York: United Nations: 209–242 (Country Monograph Series 12).
Pool, I. (1993). New Zealand’s two health transitions: A comparative analysis. In: International Union for the Scientific Study of Population (ed.). International Population Conference / Congres International de la Population, Montreal 1993, 24th August–1st September, Volume 1. Liege: IUSSP: 419–427.
Pool, I. and Cheung, J. (2003). A cohort history of mortality in New Zealand. New Zealand Population Review 29(2): 107–138.
Pool, I. and Cheung, J. (2005). Why were New Zealand levels of life expectancy so high at the dawn of the twentieth century?Genus 61(2): 9–33.
Pouyez, C. and Lavoie, Y. (1983). Les Saguenayens: Introduction à l’histoire des populations du Saguenay XVIe–XXe siècles [Les Saguenayens: Introduction to the history of the populations of Saguenay, 16th–20th century]. Sillery: Presses de
l’Université du Québec.
Quetelet, A. (1851). Nouvelles tables de mortalité pour la Belgique [New life tables for Belgium].Bulletin de la Commission Centrale de Statistique 4: 1–22.
Rédei J. (1960). A születések ás halálozások alakulása a XIX. és XX. szádzadban Ewrópában és Magyarországon [Births and deaths in Europe and Hungary in the 19th and 20th centuries]. Budapest: Közgazdasági és Jogi Kiadó.
Reher, D. and Sandström, G. (2015). Dimensions of rational decision-making during the demographic transition: Aranjuez (Spain) revisited. Historical Life Course Studies 2: 20–36.
Reher, D. and Sanz-Gimeno, A. (2007). Rethinking historical reproductive change: Insights from longitudinal data for a Spanish town.Population and Development Review 33(4): 703–727.doi:10.2307/25487619.
Rodrigues Veiga, T., Guardado Moreira, M., and Fernandes, A. (2004). Social changes and better health conditions of the Portuguese population, 1974–2000. Hygiea Internationalis 4(1): 255–276.
Rothenbacher, F. (2002).The European population, 1850–1945. New York: Palgrave MacMillan.doi:10.1007/9781-137-43366-4.
Sánchez-Barricarte, J.J. (2017a). Mortality–fertility synergies during the demographic transition in the developed world. Population Studies 71(2): 155–170.
doi:10.1080/00324728.2017.1294701.
Sánchez-Barricarte, J.J. (2017b). The long-term determinants of marital fertility in the developed world (19th and 20th centuries): The role of welfare policies. Demographic Research 36(42): 1255–1298.doi:10.4054/DemRes.2017.36.42. Sardon, J.-P. (1991). Generation replacement in Europe since 1900. Population: An
English Selection 3(1991): 15–32.
Sardon, J.-P. (1996). Coale’s indices, comparative indices, mean generation, total fertility rate, and components. Population: An English Selection 8(1996): 252–257.
Schellekens, J. and Van Poppel, F. (2012). Marital fertility decline in the Netherlands: Child mortality, real wages, and unemployment, 1860–1939. Demography 49(3): 965–988.doi:10.1007/s13524-012-0112-1.
Siampos, G. (1989).Mortality decline and longevity in Greece. Athens: Epiloyi. Smith, D. (1972). The demographic history of colonial New England. Journal of
Economic History 32(1): 165–183.doi:10.1017/S0022050700075458.
Srb, V. (1962). Population development and population policy in Czechoslovakia. Population Studies 16(2): 147–159.
Strulik, H. and Weisdorf, H. (2014). How child costs and survival shaped the Industrial Revolution and the demographic transition. Macroeconomic Dynamics 18(1): 114–144.doi:10.1017/S1365100512000302.
Taeuber, I. (1958).The population of Japan. Princeton: Princeton University Press. Teitelbaum, M. (1984). The British fertility decline: Demographic transition in the
crucible of the Industrial Revolution. Princeton: Princeton University Press.
doi:10.1515/9781400857159.