Himanshu Gupta et al, International Journal of Computer Science and Mobile Applications,
Vol.2 Issue. 5, May- 2014, pg. 7-13
ISSN: 2321-8363
©2014, IJCSMA All Rights Reserved, www.ijcsma.com 7
k-means Based Document Clustering with
Automatic “k” Selection and Cluster Refinement
Himanshu Gupta, Dr. Rajeev Srivastava
Department of Computer Engineering
Indian Institute of Technology, BHU (INDIA)
himanshu.gupta.cse09@itbhu.ac.in
rajeev.cse@iitbhu.ac.in
Abstract— In recent years use of web has been increased manifold. Efficiency is as important as accuracy. Automatic document clustering is an important part of many important fields such as data mining, information retrieval etc. Most of the document clustering techniques are based on k-means and it’s variants. K-means is a fast algorithm but there are some shortcomings with this technique. K in k-means stands for no of clusters which a user has to provide but most of the times users don’t have any clue about k. In our implementation of document clustering technique we used SVD (Singular Vector Decomposition) to find out no of clusters (value of k) required. Then k-means algorithm is used to create clusters and in last phase of algorithm the clusters are refined by feature voting. Refinement phase enable us to make our algorithm much faster than k-means algorithm.
Keywords— Document Clustering, k-means, Feature Voting, SVD, Vector Space Model, Cosine similarity
I. INTRODUCTION
Clustering is an unsupervised learning technique which is used to group a set of objects into subsets or clusters. The goal is to group these objects such that objects in the same clusters should be as similar as possible and objects in different clusters must be as dissimilar as possible[1,2,3]
.
Document clustering is used to organize text documents which are useful for information retrieval, data mining. There are two types of clustering techniques: hierarchical and partition [2]. Hierarchical techniques are known for creating better quality clusters but they are relatively slow. Time complexity of this approach is quadratic. Most of the widely used partition techniques are k-means and it’s variants[4]. Time complexity of partition techniques is almost linear. K-means clustering algorithm clusters data into predefined no of clusters. It starts with initialization of cluster centroids randomly then assignment of data objects to the closest (most similar) centroid. This process is repeated again and again until a termination criterion (either after certain no of iteration clusters don’t change or predefined no of iteration have been done) is met.The drawbacks of k-means are user have to provide the value of k which most probably he does not have any clue about. Another drawback is that cluster results are sensitive to initialization of centroids. So if centroids are not initialized properly then results may converge to local optima[5].
These problems are addressed in out implementation. Value of k is decided using Singular Vector Decomposition(SVD). SVD is applied on term-document matrix and k-rank approximation is done on ∑ matrix which we get from SVD. Which gives us value of k. Then k-means is applied. In k-means, initialization of centroids is done using roulette wheel selection method. Due to using SVD the process is slowed down which is compensated by refinement. K-means is only run for 200 rounds to get initial clusters.
Himanshu Gupta et al, International Journal of Computer Science and Mobile Applications,
Vol.2 Issue. 5, May- 2014, pg. 7-13
ISSN: 2321-8363
©2014, IJCSMA All Rights Reserved, www.ijcsma.com 8
II. PRELIMINARIESA. VectorSpaceModel:
Set of text documents is represented as Vector Space Model (VSM)[6]. VSM can be represented as V={x1,x2,….,xn}. Each document xi is represented as a vector which is called the feature vector. A vector x can be represented as, x= {w1,w2, …….,wn}. Where wi represents
the term weight. The term weight can be calculated using TF-IDF (term frequency-inverse document frequency) scheme. Weight of i in document j can be calculated as:
W
ji=
tf
ji* idf
ji=
tf*log
2( n /df
ji)
(1)
Where tfji is the number of times term i has appeared in document j. dfji represents the no of documents in which term i has appeared and n
is the total no of documents in collection. This Vector Space Model can also be seen as term document matrix of txd where t is total no of terms and d is no of documents.
B. Similarity Metric
Cosine correlation is used as similarity metric. As the documents are represented as feature vectors cosine similarity is a very good metric to measure similarity. If there are two vectors A and B then cosine correlation[7] can be given as:
A.B
Cos(A,B) = (2)
|A|*|B|
Where A.B denotes the dot product and |A| denotes the length of the vector.
C. Singular Vector Decomposition (SVD)
The decomposition breaks a t×d matrix A into three matrices U, Σ and V such that A=UΣVT. U is the t×t orthogonal matrix whose column vectors are called the left singular vectors of A, V is the d×d orthogonal matrix whose column vectors are termed the right singular vectors of A, and Σ is the t×d diagonal matrix having the singular values of A ordered decreasingly (σ1 ≥ σ2 ≥ ... ≥ σmin(t,d)) along its diagonal.
The rank rA of the matrix A is equal to the number of its non- zero singular values. In our algorithm we will use the diagonal matrix of singular
values of A[8].
III. METHODOLOGY
The algorithm has four phases which are following
A. Term-Document matrix building:
In this phase a term document matrix A is build so that SVD decomposition can be performed on A. This matrix can be seen as vector space model in which each vector is a column of this matrix.
B. Calculation of K in K-Means
Himanshu Gupta et al, International Journal of Computer Science and Mobile Applications,
Vol.2 Issue. 5, May- 2014, pg. 7-13
ISSN: 2321-8363
©2014, IJCSMA All Rights Reserved, www.ijcsma.com 9
was the fact that the other approaches cannot be easily parameterized. In this method a quality threshold q is also assumed which help in determining the extent the k rank approximation should retain the original information[8].
k is set to the value which satisfies the following inequality:
√∑
√∑
(3)
In this formula, A is original matrix, Ak is it’s k-rank approximation, rA denotes the rank of A. , σiis its ith singular value (the ith diagonal
element of the SVD's Σ matrix) and ||A||F denotes the Frobenius norm of the A matrix. q is quality threshold whose value is between 0.7 to
0.9 (default .775).
C. Apply K-means on Document Collection:
Once the value of k is determined we apply k-means clustering algorithm to get initial clusters. Cosine similarity is used as similarity metric. Given data objects and value of k, basic K-means algorithm is given below:
1. Choose initial centroid vectors.
2. Assign each document vector to closest cluster centroid. 3. Recalculate the cluster centroid cj using following formula:
∑
(4)
Where di denotes the document vector which belongs to cluster Sj,cj stands for centroid vector and nj is the total number of documents belong to cluster Sj.
4. Repeat until termination criterion is met.
Here termination criterion is 200 iteration.
D. Refinement of Clusters:
Once we get clusters from third phase we can apply refinement on these clusters. Refinement is done using feature voting[9]. When the discriminative feature fi has the highest occurrence frequency in cluster cx, we say that fi is discriminative for cx, and save the cluster label x for fi (denoted as si) for the later feature voting operation. By definition, si can be expressed as:
(
)
(5)
Where g is function which find frequency of feature fi in cluster cx .
Once the discreminative features have been selected following voting scheme is applied iteratively to refine document clusters:
Himanshu Gupta et al, International Journal of Computer Science and Mobile Applications,
Vol.2 Issue. 5, May- 2014, pg. 7-13
ISSN: 2321-8363
©2014, IJCSMA All Rights Reserved, www.ijcsma.com 10
2. Use C to find the descriminative feature set F={f1, f2,…. fp} with their respective cluster lables S={s1, s2,…. Sp}.
3. For each document dj in document collection find it’s new cluster lable lj by the majority voting of descriminative features as following:
Suppose document dj contains some descriminative features
{
}
and{
}
is associated cluster lables. Then new cluster lable for document dj will be decided as:
(
)
(6)
Where count (sy ,Sj) represents the number of times sy appear in Sj.
4. Compare new clusters set with previous cluster set. If result converges then terminate the process else update new cluster set as C and goto step 2.
Above voting process is self-refinement iterative process. In starting we have initial set of document clusters with low accuracy. From initial clusters process finds features that are discriminatvie for the clusters and then by voting on each document’s cluster label refinement is done. Due to this process the document clusters slowly improved and clustered accordingly.
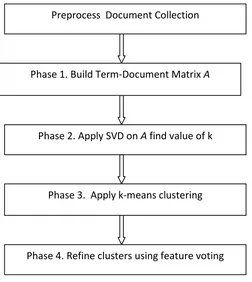
In this paper following method is proposed:
Figure 1. Proposed method
Preprocess Document Collection
Phase 1. Build Term-Document Matrix A
Phase 2. Apply SVD on A find value of k
Phase 3. Apply k-means clustering
Himanshu Gupta et al, International Journal of Computer Science and Mobile Applications,
Vol.2 Issue. 5, May- 2014, pg. 7-13
ISSN: 2321-8363
©2014, IJCSMA All Rights Reserved, www.ijcsma.com 11
IV. EXPERIMENTAL SETUP
Algorithm implemented in Java language. Netbeans IDE is used. For SVD decomposition JAMA MATRIX [10] package is used. “Reuters-21578-topics” is used to create different datasets in which there were 10 classes. Documents were pre-processed by removing stop words and different forms of a word are reduced to single word using porter’s stemmer [11].
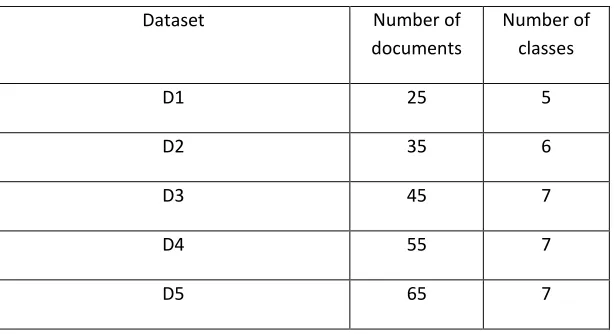
Table 1: summary of text document collection
V. RESULT & DISCUSSION
A.
Finding value of k: Following table shows the number of classes which are used to make datasets And the number of clusters suggested by our methodTable 2
Dataset Number of documents
Number of classes
D1 25 5
D2 35 6
D3 45 7
D4 55 7
D5 65 7
Dataset Number of clusters suggested by
method
Number of classes
D1 5 5
D2 6 6
D3 6 7
D4 7 7
Himanshu Gupta et al, International Journal of Computer Science and Mobile Applications,
Vol.2 Issue. 5, May- 2014, pg. 7-13
ISSN: 2321-8363
©2014, IJCSMA All Rights Reserved, www.ijcsma.com 12
From table 2 it is clear that our method is quite accurate in predicting number of clusters. And it could be brought closer by tuning candidate level threshold. And it’s also represent that the documents which belong to different classes may be similar that’s why there may not be need of that much clusters. However, method is useful to make cluster algorithms automatic in choosing value of k.
B.
Efficiency of method:
For measuring the efficiency of the algorithm, algorithm is compared with the pure k-means algorithm. In our algorithm first k-means is applied for maximum of 200 iterations and then refinement is performed. In pure k-means algorithm 600 iterations are used. Both the algorithms were almost equal from accuracy’s point of view. Table 3 represents the comparison on the basis of efficiency.Table 3: comparison between k-means & proposed method
It’s clear from above results that our algorithm has significant advantages over k-means algorithm in terms of efficiency. This is because of the fact that in refinement step of our algorithm major operations which are done were accessing the matrix values and addition and searching.
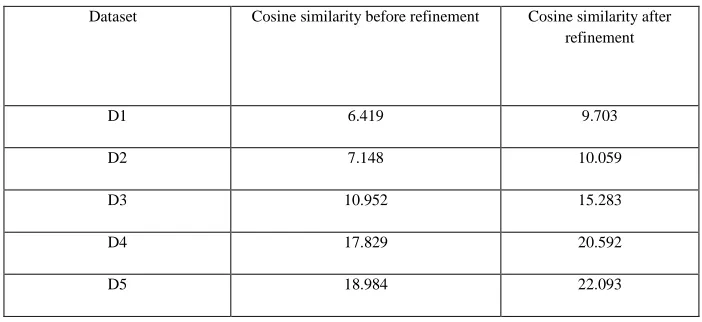
C. Accuracy of method: Following table shows the accuracy of the algorithm. Overall cosine similarity is used as the criterion for accuracy. Cosine similarity before refinement and after refinement is compared.
Table 4 : accuracy before and after refinement
Above results show that accuracy is significantly increased in our algorithm. About 25-40% increase in accuracy is measured.
Dataset Time taken by pure
k-means(in sec)
Time taken by our algorithm
(in sec)
D1 57.10 26.93
D2 28.34 18.76
D3 64.50 37.73
D4 130.05 88.79
D5 135.83 91.95
Dataset Cosine similarity before refinement Cosine similarity after
refinement
D1 6.419 9.703
D2 7.148 10.059
D3 10.952 15.283
D4 17.829 20.592
Himanshu Gupta et al, International Journal of Computer Science and Mobile Applications,
Vol.2 Issue. 5, May- 2014, pg. 7-13
ISSN: 2321-8363
©2014, IJCSMA All Rights Reserved, www.ijcsma.com 13
CONCLUSIONS
The method represented in this paper computes the value of k automatically and with great precession. By using refinement by feature voting increase the efficiency greatly. Method is both efficient and accurate and creates good quality clusters.
REFERENCES