Tribology in Industry
www.tribology.rsTheory Reviews - Hardware and Software Support
for Testing Material on Specimens of the Small Cross
Section
S. Kostić
a, A. Košarac
b, V. Luković
c, J. Miljojković
daTechnical college at applied studies in Kragujevac, Kosovska 8, Serbia,
b University of East Sarajevo, Faculty of Mechanical Engineering, Vuka Karadžića 30, Bosnia and Hercegovina, cUniversity of Kragujevac, Faculty of Technical Sciences Čačak, Svetog Save 65, Serbia,
d Faculty of Engineering Kragujevac, University of Kragujevac, Sestre Janjić 6, Serbia.
Keywords: Tensile testing
Portable tensile testing machine Miniature specimen
Stress-strain curve
A B S T R A C T
Testing techniques to obtain the mechanical properties of materials on specimens of the small cross section (miniature specimen) become the subject of numerous researches due to several advantages, in economic and organizational terms. This paper presents the model of the tensile testing device for materials on the specimens of the small cross section, its hardware and software basis. The device proved to be very reliable, so it is suitable for testing the mechanical characteristics of the material, just like the one used for the demonstration of material testing for students.
© 2019 Published by Faculty of Engineering Corresponding author:
Sonja Kostić
Visoka tehnička škola strukovnih studija u Kragujevcu, Kosovska 8, Serbia.
E-mail: [email protected]
1. INTRODUCTION
The knowledge of the basic properties of the materials has important part in the development of new materials as well as control of the quality of the materials used in design and construction [1-4]. By analyzing literature sources, it can be concluded that research in the field of material tensile testing is actual on many issues. There is more and more testing of material properties on non-standard specimens, small-cross-sectional samples [5-7], testing in the field of metal and nonmetallic materials, as well as tests carried out on small, easily portable devices [8-11], which are, as such, very suitable in the
educational sense. Research with these types of devices, with low-mass and volume specimens, is especially relevant in the testing of very expensive and rare materials.
In the paper [10], the authors presented the development and design of a small and practical tensile testing device, designed to help students perform classroom testing using a low-mass and volume samples. Tensile testing on samples is carried out at speeds of 0.001 to 1.0 mm/s, by adjusting the speed of the stepper motor.
Specimens of non-standard dimensions and shapes, of small cross-sections are generally the
R
ES
EA
R
dog bone type with rectangular cross-sections. Many researchers are concerned with the influence of the shape and dimensions of the specimens on the results of the testing [12-15]. Most of the authors verified their results with the finite element method. Special attention is on the problem of optimizing the small cross-sectional specimens in order to achieve the best results of the test [16-18].
Some authors [19] have proposed to construct a new steel jaw grip on the device to hold smaller specimens than standard ones, in order to reduce costs and use standard laboratory equipment for tensile testing. The new jaw grip is optional and can be used as needed.
Standard tensile testing devices are usually massive and are used in special laboratory conditions. Testing devices use standard, relatively large specimens. By using small and lightweight testing material devices that use small cross-section specimens, which are manufactured on numerical devices, both industrial and academic researchers save time and money. No special conditions and space for testing are required, there are no limitations in the number of test specimens in economic terms, and a larger number of tested samples provide opportunities for obtaining as precise test results as possible. We should not ignore the fact that the errors of the inclusions of the material are smaller in the small-mass and volume samples, which again supports the accuracy of the testing of the material itself.
Tensile test results are shown by the engineering strain curves. Based on this the true stress-strain curves can be obtained in the range of large deformations. This, together with the finite element method, is the subject of research by the researchers [20-21]. Special attention is on true stress-strain after necking, when the deformations are localized and the stress state becomes complex, three-axial [22-26].
2. THEORETICAL BASIS OF TENSILE TESTING
MATERIALS ON SPECIMENS OF SMALL CROSS SECTION SURFACE
By analysing the solution of classical and standard devices for tensile testing, it is concluded that the mass of the device is a large
device requiring a special installation and test area, that the testing forces are available in a relatively large range, the dimensions of the standard specimen are large, and therefore the prices of the devices and related hardware and software solutions are high.
Contrary to the standard testing devices on the realized device, they are performed on the specimen of a small cross section. Fig. 1 shows a specimen.
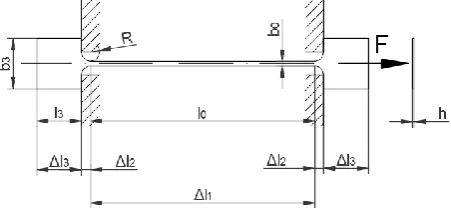
Fig. 1. Scheme of a small, rectangular cross-section specimen.
The Figure 1 shows the dimensions of the specimen before the start of the test, where: l0 - the original length of the specimen in the parallel zone, b0 - the original specimen width, h- the original thickness of the specimen, R- the specimen radius in fillet zones, l3- the original length of the specimen in grip zones, b3- the original specimen width in grip zones.
before and after elongation, pixel by pixel. This testing requires the use of camera with high resolution, followed by data processing using the appropriate software. On the other hand, measuring the elastic strain of a small specimen by moving the grip does not require additional equipment and data processing. However, this method has one drawback. In measuring the displacement of the grip in order to obtain the elastic strain of the test sample, it must be appreciated that the measured elongation of the specimen includes the elongation of the specimen fillet zone and the elongation of grip zones as well.
The elongation of the tensile specimen can be divided into five zones: elongation in the measuring zone (parallel zone) l1, elongation in two fillet zones l2 and elongation in the two grip zones l3.
The total elongation of the specimen lu after tensile testing, as can be seen from Fig. 1, can be written as the sum of the elongation of all five mentioned zones of the specimen, as formula (1):
1 2 2 2 3 uk 1 2 2 23
u
F
l l l l c c c
E
(1)
where Fuk is the applied force during testing, E - Young's modulus of the material, c c c1, 2, 3 -
constants, which are in function of the specimen dimensions.
3. DEVELOPMENT OF TENSILE TESTING
DEVICE AND HARDWARE-SOFTWARE SUPPORT
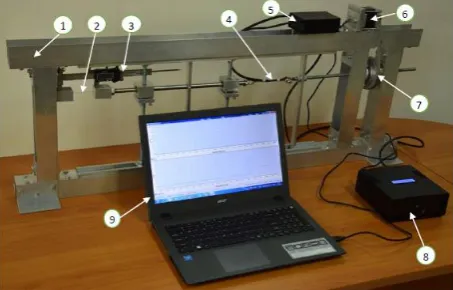
For material testing, a tensile testing device has been designed and developed, Fig. 2. The basic units of the device are frame construction, operating system (stepper motor, gear belt, coil spindle, receiving and guiding elements, measuring system (force and displacement sensors), the control system with the corresponding software.
The tensile testing device is a serious and reliable device. The drive system and data acquisition system are automated. The measuring system consists of a dynamometer for measuring the tensile force (4) in the measuring range from 0-400N, the accuracy of which is 1N, as well as the
measuring device for displacement (3). Measuring range of the electronic digital calliper is 0.01-50mm, and the accuracy of the calliper is 0.01mm. Data acquisition is done via AD converter (5) and Arduino Uno control unit that collects data from AD converter.
Fig. 2. Tensile testing device: 1) device frame, 2) specimen, 3) electronic digital calliper, 4) dynamometer, 5) central control unit, 6) step motor, 7) belt drive, 8) control unit for regulating the speed and direction of movement of the mobile grip zone of device and 9) the computer.
One of the two grip zones of the specimen is stationary, while the tensile force is achieved by moving the second moving grip zone of specimen in the appropriate direction. Moving the grip zone is carried out by activating the step motor (6), the speed of which is 1 mm/min.
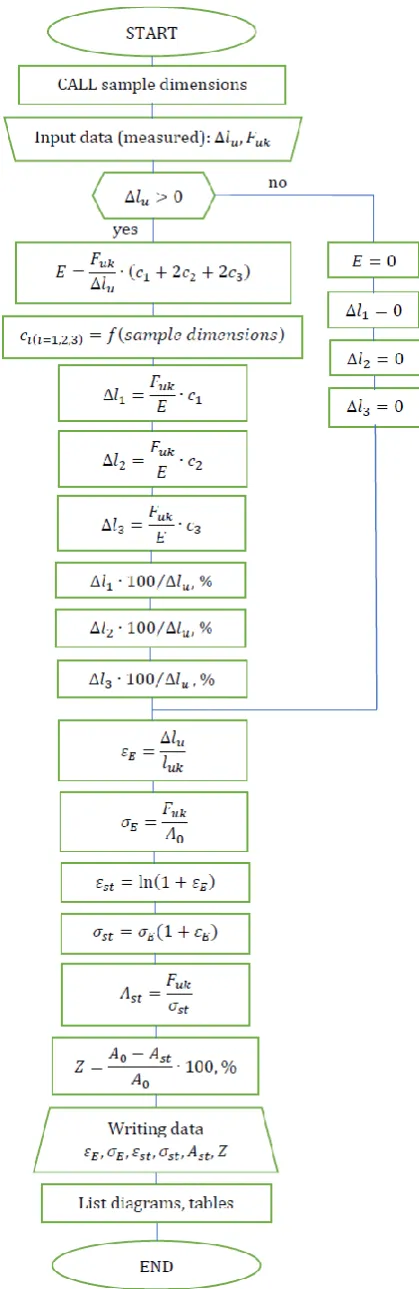
Processing of measured data is done using the Software developed in Visual Studio 2017 using C# programming language. Visual Studio 2017 is free version and does not need to be licensed. Basically, the algorithm is given in Fig. 3.
The sizes given in the algorithm are E - conventional (engineering) strain, luk - the sum of the original length of the measuring (parallel) zone of the specimen and the fillet zone of specimen,
E
- conventional (engineering) stress, A0 - the original cross-sectional area, st - true strain, st - true stress, Ast - true cross-sectional area of the specimen, Z - contraction (percentage reduction of area) of the specimen cross-section during testing to fracture.
Fig. 3. Algorithm for the device software.
The true stress in the material is difficult to register, especially with the formation of big plastic
deformations, since the cross-section of the specimen during the test is constantly changing. However, if the forces are related to the current, always the smallest and most deformed cross section, the actual true stress-strain curve will be obtained. It shows a constant stress increase with specimen's cross section reduction. The true stresses and strains given in the algorithm are expressed from the assumption of a constant volume of the specimen during the tensile test.
4. RESULTS OF MATERIAL TESTING
The dimensions of the specimen are given in Table 1. The specimen material is a galvanized sheet.
Table 1. Tensile test specimen dimensions
Symbol l0 b0 h l3 b3 R
Value, mm 50 1 0.5 10 11 2
The specimen is dimensioned that the maximum force required for the specimen fracture is not greater than 400 N. Many specimens were tested to fracture. By statistical data processing such as yield strength, tensile strength, etc. it has been concluded that the dissipation of these values is no more than ±3.5 %, which clearly shows that the testing machine is a reliable material testing device.
Based on the data collected by measurement, a tensile force-elongation curve of the specimen can be shown, Fig. 4. After reaching the maximum force, plastic deformation is localized, a complex three-axis stress condition is created, the neck is created at the specimen cross-section, and specimen fractures develop with further growth of the elongation and decrease of force.
Fig. 4. Force-elongation curve.
identical in shape to the previous force-elongation curve. The relationship between force and stress is given over the original cross-section area of specimen.
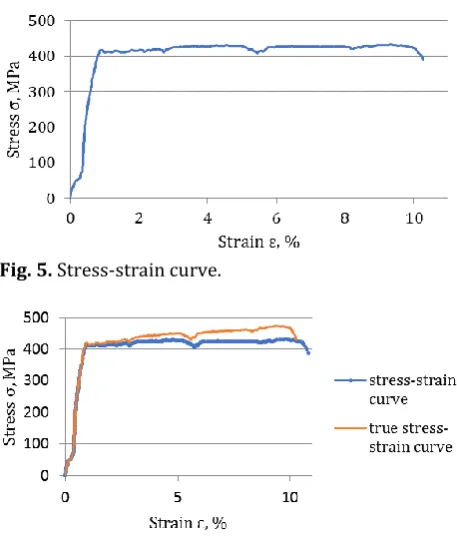
Fig. 5. Stress-strain curve.
Fig. 6. Stress-strain and true stress-strain curves.
Fig. 7. Diagram of changing the cross-sectional area in the function of true stress.
Based on the presented algorithm and the analysis of the obtained results of the material testing, the elongation values in each zone of the specimen are obtained individually, for each measured value of the force. The general conclusion is that the elongation caused in the measuring (parallel) zone of the specimen (the zone where the specimen is expected to fracture) is 97.5 % of the total measured elongation. The elongation in the fillet zone is 2 % of the total measured elongation, while the elongation in the grip zone of specimen is 0.5 % of the total elongation.
By analysing the obtained data, the software prints the true stress-strain curve of the specimen, Fig. 6. True stress-strain curve is obtained by taking into account the true area of the cross-section at the moment of the plastic deformation precisely in the parallel zone of specimen.
In the case of small cross-sections, as it is here, it is very difficult to accurately measure the contraction, i.e. percentage reduction of area at the point of the specimen fracture. This value can be obtained from the measured experimental data obtained and determining the true stresses and strains. The true cross-sectional area at each measured point of force and elongation is the ratio of the tensile force and the true stresses. Thus, we can plot the diagram of the change in the surface area of the cross section in the function of the true stresses, Fig. 7.
5. CONCLUSION
The need for easy and quick education of students in the field of material testing and obtaining important mechanical properties of materials that play a decisive role in the selection of materials in construction and design have led to the development of testing devices. The device presented in this paper is relatively inexpensive, easy to handle, has automated measurement and recording processes. In addition to the educational significance, the realized device may be a device for obtaining preliminary mechanical properties of materials in various production lines without requiring special test conditions.
The designed device uses small cross-sectional specimens, non-standard dimensions, but calculated so as to fracture in the expected range of force-elongation. Specimens can be of metal or non-metallic materials.
The obtained results are comparable with the results of the renowned laboratories for tension testing of materials [28].
REFERENCES
[1] G.E. Dieter, Mechanical metallurgy, SI metric edition, Boston, McGraw-Hill, 1988.
[3] R. Gedney, Guide to Testing Metals Under Tension, Advanced Materials & Processes, pp. 29–31, 2002. [4] W.F. Hosford, Overview of Tensile Testing, P. Han,
Ed., ASM International, pp. 1–24, 1992.
[5] SRPS EN ISO 6892-1, Metalni materijali — Ispitivanje zatezanjem — Deo 1: Metoda ispitivanja na sobnoj temperaturi, Institut za standardizaciju Srbije, februar 2017. (in Serbian) [6] ASTM, Standard Test Methods for Tension
Testing of Metallic Materials, D.o. Defense., 2013. [7] M.S. Loveday, T. Gray, J. Aegerter, Tensile testing of metallic materials: A review, Technical report, National Physical Laboratory, 2004.
[8] D.A. LaVan, Microtensile properties of weld metal, Experimental Techniques, vol. 23, iss. 3, pp. 31-34, 1999, doi: 10.1111/j.1747-1567.1999.tb01568.x [9] G. Partheepan, D.K. Sehgal, R.K. Pandey, Design and
usage of a simple miniature specimen test setup for the evaluation of mechanical properties, Inter. J. Microstructure and Materials Properties, vol. 1, no. 1, pp. 38-50, 2005, doi:10.1504/IJMMP.2005.008129 [10] L. Woong, K. Ho-Kyung, Design and development of a
miniaturised tensile testing machine, Global Journal of Engineering Education, vol. 15, no. 1, pp. 48-53, 2013. [11] B. Hasçelik, R. Eren, Development of a Test Device for Measuring Tensile Properties of Fabrics, Tekstil Ve Konfeksiyon, vol. 26, no. 1, pp. 12-21, 2016. [12] W.J. Yuan, F. Zhou, Z.L. Zhang, Y.J. Su, L.J. Qiao,
W.Y. Chu, An analysis on necking effect and stress distribution in round cross-section specimens of pure copper with different diameters, Materials Science & Engineering A, vol. 561, pp. 183–190, 2013, doi: 10.1016/j.msea.2012.10.077
[13] D. Ananda, D. R. Kumar, Effect of thickness and grain size on flow stress of very thin brass sheets, Procedia Materials Science, vol. 6, pp. 154–160, 2014, doi:10.1016/j.mspro.2014.07.019
[14] X. Suna, A. Soulami, K.S. Choia, O. Guzmanb, W. Chenc, Effects of sample geometry and loading rate on tensile ductility of TRIP800 steel, Materials Science and Engineering A, vol. 541, pp. 1-7, 2012, doi:10.1016/j.msea.2011.12.115 [15] K. Kumara, A. Pooleery, K. Madhusoodanan, R.N.
Singh, J.K. Chakravartty, B.K. Dutta, R.K. Sinha, Use of Miniature Tensile Specimen for Measurement of Mechanical Properties, Procedia Engineering, vol. 86, pp. 899–909, 2014, doi:10.1016/j.proeng.2014.11.112
[16] H. Liua, Y. Shena, S. Yangc, P. Zhengc, L. Zhang, A Comprehensive Solution to Miniaturized Tensile Testing: Specimen Geometry Optimization and Extraction of Constitutive Behaviors Using Inverse FEM Procedure, Fusion Engineering and Design, vol. 121, pp. 188–197, 2017, doi: 10.1016/j.fusengdes.2017.07.016
[17] K. Kumar, A. Pooleery, K. Madhusoodanan, R.N. Singh, A. Chatterjee, B.K. Dutta, R.K. Sinha,
Optimisation of Thickness of Miniature Tensile Specimens for Evaluation of Mechanical Properties, Materials Science & Engineering: A, vol. 675, pp. 32– 43, 2016, doi: 10.1016/j.msea.2016.08.032
[18] T. Klemens, E. Lund, B.F. Sørensen, Optimal Shape of Thin Tensile Test Specimen, J. Am. Ceram. Soc., vol. 90, iss. 6, pp. 1827–1835, 2007, doi: 10.1111/j.1551-2916.2007.01538.x
[19] O.J. Akinribide, A.K. Ogunkoya, I.M. Momoh, O.D. Ogundare, B.E. AttahDaniel, S. Olusunle, Design and Development of Grip for Circular Test Piece Inuniversal Tensile Testing Machine, Journal of Minerals and Materials Characterization and Engineering, vol. 1, pp. 331-335, 2013, doi: 10.4236/jmmce.2013.16050
[20] M. Joun, J.G. Eom, M.C. Lee, A new method for acquiring true stress–strain curves over a large range of strains using a tensile test and finite element method, Mechanics of Materials, vol. 40, iss. 7, pp. 586–593, 2008, doi: 10.1016/j.mechmat.2007.11.006
[21] M. Kamaya, M. Kawakubo, A procedure for determining the true stress–strain curve over a large range of strains using digital image correlation and finite element analysis, Mechanics of Materials, vol. 43, iss. 5, pp. 243– 253, 2011, doi: 10.1016/j.mechmat.2011.02.007 [22] S.K. Paul, S. Roy, S. Sivaprasad, S. Tarafder, A Simplified Procedure to Determine Post-necking True Stress– Strain Curve from Uniaxial Tensile Test of Round Metallic Specimen Using DIC, Journal of Materials Engineering and Performance, vol. 27, iss. 9, pp. 4893-4899, 2018, doi: 10.1007/s11665-018-3566-5 [23] Z.L Zhang, J. Odegard, O.P. Sovik, C. Thaulow, A
study on determining true stress strain curve for anisotropic materials with restangular tensile bars, International Journal of Solid and Structure, vol. 38, iss. 26-27, pp. 4489–4505, 2001, doi: 10.1016/S0020-7683(00)00302-4 [24] H.-b. Tian, D. Kang, A study on determining hardening
curve for sheet metal, International Journal of Machine Tools and Manufacture, vol. 43, iss. 12, pp. 1253–1257, 2003, doi: 10.1016/S0890-6955(03)00132-9
[25] Y. Ling, Uniaxial True Stress-Strain after Necking, AMP Journal of Technology, 1997.
[26] ASM Handbook, Volume 8, Mechanical Testing and Evaluation, 2000.
[27] C.B. Hurchill, J.A. Shaw, M.A. Iadicola, Tips and tricks for characterizing shape memory alloy wire: part 2—fundamental isothermal responses, Experimental Techniques, vol. 33, iss. 1, pp. 51–62, 2009, doi: 10.1111/j.1747-1567.2008.00460.x [28] ASM International, Atlas of Stress-Strain Curves,