An advanced software to manage a smart water network
with innovative metrics and tools
based on social network theory
Armando Di Nardo1,2,3,4, Michele Di Natale1,2, Anna Di Mauro1,4, Eva Martínez
Díaz1,5, Jose Antonio Blázquez Garcia1,5, Giovanni Francesco Santonastaso1,2,4,
Francesco Paolo Tuccinardi1,4
1 EIP Action Group Ctrl+SWAN, via Roma 29, 81031, Aversa (CE), IT 2Second University of Naples, via Roma 29, 81031, Aversa (CE), IT 3Institute of Complex System, via Roma 29, 81031, Aversa (CE), IT 4MedHydro srl academic spinoff, via Roma 29, 81031, Aversa (CE), IT 5Departamento de Innovación y Tecnología, FCC AqualiaFCC AQUALIA,
Av. del Camino de Santiago, 40, Madrid, ES
Corresponding author: [email protected]
Abstract. The recent development and applications of social network theory in many fields of engineering (electricity, gas, transport, water, etc.) allows both the understanding of networks and to improve their management. Social network theory coupled to the availability of real time data and big data analysis techniques can change drastically the traditional approaches to manage civil networks. Recently, some authors are working to apply this novel approach, based on social network theory, on the water distribution networks using: a) graph partitioning algorithms to define optimal district meter areas both for water losses identification and for water network protection, b) innovative topological, energy and hydraulic indices to analyze performance; and c) GIS (Geographical Information System) to provide a more effective display of results and to improve network behavior in specific operational conditions. In this paper, a novel release 3.5 of SWANP software, that implements all these features, was tested on a real large water network in Alcalá de Henares, Spain.
Keywords: smart water network, social network theory, water partitioning, water protection, performance indices
Volume 3, 2018, Pages 582–592
1 Introduction
In the last years, three lines of research and development (real time data acquisition; big data analysis and social network theory) are changing significantly the understanding and management of social and civil networks. The paradigm of Smart City [1] seems now possible due to low cost smart sensors [2] able to measure in real time, and the growth of computational power able to analyse big data and to apply complex network theory, allowing to understand some crucial aspects of very large networks in terms of reliability and robustness [3].
These innovative technological aspects have recently allowed defining the novel paradigm of Smart WAter Network (SWAN) [3] referring to all water networks that implement on-line smart sensors and decision support systems. The novel paradigm of SWAN is especially effective in Water Distribution Networks (WDN) that show very high extension and level of connections (loops).
The novel Information and Communication Technologies (ICT) simplify the implementation of the “divide and conquer” technique [3] – consisting of dividing a water network into k smaller subsystems or District Meter Area (DMA) by gate valves and flow meters – that allows improving significantly the WDN management making real the paradigm of SWAN. Indeed, as known, the definition of DMA represents one of the most effective strategy [4,5] to simplify the control of real (physical) water losses obtained essentially with four actions: a) conducting pressure management, b) achieving active leakage control, c) improving the speed and quality of leak repairs, and d) increasing main replacement and rehabilitation. Furthermore, the definition of DMA also allows to reduce the risk of malicious or accidental contamination of a water supply network [2]. The network partitioning allows the activation of protection measures since it is possible to disconnect only some part of the network [2]. Finally, the definition of DMA allows monitoring the water demand and hydraulic performance for each district separately improving the system knowledge and, consequently, planning the ordinary and extraordinary maintenance.
Additionally, novel approaches and methodologies borrowed from social network theory [7] can provide useful metrics, properly weighting the links and nodes of the network, the local and global system behaviour. In recent years, some applications in water distribution network partitioning have been applied successfully to optimal design of DMAs [8, 9, 10 ,11].
In this paper, social network theory was used to analyse and automatically define the optimal layout of network DMA improving the release 3.5 of SWANP (Smart WAter Network Partitioning and Protection) software.
In particular, in collaboration with AQUALIA company, SWANP 3.5 was tested on large water network of Alcalá de Henares in Spain, showing some advantages in the analysis, partitioning and visual displaying of the case study.
2 Methods
The first and third release of SWANP software [12], developed in Python v2.7 language, provided the decision-maker different solutions to define automatically the optimal layout of DMA both for water losses and water protection, using some partitioning algorithms and several hydraulic and energy indices. The last release 3.5 of SWANP software implements novel algorithms, to define optimal water partitioning, and a number of novel topological indices, to compare the original and partitioned network and better analyse the network behaviour with reference to robustness issues. A full integration in a QGIS framework was implemented, that improves significantly the results display.
SWANP 3.5 software provides an easy tool to compute the optimal water network partitioning based on two different phases [13]: a) the clustering, aimed at defining the shape and the dimensions of each DMA; b) the dividing, aimed at physically partitioning the network, by selecting pipes for the insertion of flow meters or gate valves.
In SWANP 3.5 a new algorithm for the clustering phase was implemented based on community detection. Sociologists apply these algorithms to uncover community structure in social network (SN) [7]. Community or module, C, can be described as a group of nodes with high density of links between them and low density of link between different groups (or communities).
As a social network, also a water supply network can be represented as a simple graph
G=(V,E), where V is the set of n vertices (or nodes) and E is the set of m edges (or links), or as a weighted graph, if some vertices or edges have associated weights. The problem of uncover k communities in a social network, can be related to the problem of dividing a water distribution network into DMAs, but while in a SN the number k
is previously unknown, for a WDN the number k can depend on economic and management considerations [14] and it can previously assigned.
Yang et al. [15]. In SWANP 3.5, fast greedy (FG) algorithm [16], available in igraph package (a network analysis tool in Python) [17], was implemented for the clustering phase.
Specifically, to discover communities in the network, FG algorithm maximizes the modularity metric Q [16], defined as:
(1)
where δij is 1 if i=j and 0 otherwise, Aij is an element of the adjacency matrix of
network (Aij=1 if i and j are linked, Aij=0 otherwise), Ki is the degree of vertex i,
defined as the number of links connected to node i and Kj is the degree of node j. As
known, values of modularity higher than 0.3 indicate a good community structure in the network [18]. A most common formulation of modularity metric, derived from Eq. (1), is the following:
(2)
where eij is the fraction of edges in the network that connect vertices in the same
community i and ai is the fraction of edges with at least a vertex belonging to
community i [16].
The FG algorithm uses a greedy optimization to maximize the modularity: starting with a number of communities equal to the number of vertices in the network, two communities are merged if their amalgamation increases the modularity. The algorithm stops after n−1 merger and only a single community is left.
In collaboration with AQUALIA, the following weights were previously assigned to each pipe, during the clustering phase:
• no-weight, W1;
• pipe diameter Dij, W2;
• number of users supplied by each pipe ij, W3, computed as follows:
(3)
in Eq. (3), siand sj are the number of customers supplied by node i and j, kiand kj are
the degree of the nodes linked by pipe ij.
The second phase, the dividing, consists in to define the best position of the flow meters and gate valve to insert in the boundary pipes (or edge-cuts) between districts previously obtained by clustering algorithms. In this way, a physical partitioning of
1 2 2 i j ij ij ij K K Q A
m m d
æ ö
= ç - ÷×
è ø
å
(
2)
ii i
i
Q=
å
e -awater network is carried out. This goal is achieved by means a Genetic Algorithm (GA) [19] in order to maximize the total node power of the network:
(4)
where g is the specific weight of water, Qi and Hi are the water demand and head at
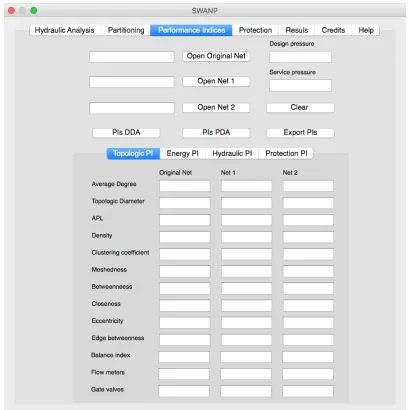
each network node. SWANP 3.5 allows to compute some traditional and innovative Performance Indices (PI) that provide information both on the whole network and on a sub-system or DMA: Topological, Energy, Hydraulic and Protection Performance indices. Figure 1 shows the GUI of SWANP 3.5 concerning the calculation of PIs.
Figure 1 Water network layout modelled in SWANP 3.5
In this study, some of these metrics were computed to analyse the water network performance in terms of local and global performance. Topological performance indices, measured by the number of nodes belong to each cluster C, ni; balance index,
Ib defined as follows:
(5)
where max(dp) is the size of largest cluster; demand balance index Id computed by
means Eq. (5) replacing max(dp) with the maximum supplied demand among clusters
and n with the total supplied demand in the network; total number of boundary pipes (edge-cut set), Nec, modularity index Q, computed by relation (2), Average Path
1 n
i i
i FO g Q H
=
=
å
( )
max p
B
k d
I
n ×
Length (APL) which represents the average number of steps along the shortest paths for all possible pairs of nodes and provide information about how much a network is fragmented [20]; APL deviation, ΔAPL, that quantifies the APL deviation of partitioned
network layout from original network [11].
Energy performance indices measured by: resilience index Ir [21], based on the
comparison between the surplus of hydraulic power available at nodes and the maximum hydraulic power available in the to satisfy the total users demand; the resilience deviation index Ird [22] – based on the comparison among the resilience
indices of the original and partitioned network.
Hydraulic performance indices measured traditionally by mean node pressure, hmean,
maximum node pressure, hmax, minimum node pressure, hmin and standard deviation
node pressure hsd.
To the purpose of this work, it was not necessary the computation of Protection performances indices provided by SWANP software.
3 Case study and results
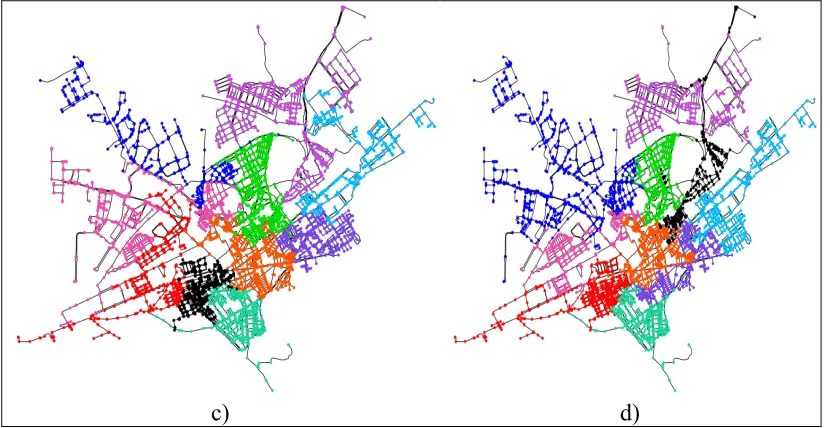
The novel algorithm and the new features have been tested on a real water distribution system: the Alcalá de Henares water system, a network of a large town in the Spain, with 202,000 inhabitants, three sources, 11,473 nodes and 12,454 pipes. Specifically, in the Figure 2, the original layout and a water network partitioning in 10 DMAs are provided in novel QGIS framework, in which, with a different colour, each DMA is illustrated.
c) d)
Figure 2 Original network a); water network partitioning layouts in SWANP 3.5: b) W1, c) W2 and d) W3
The proposed partitioning layouts of Alcalá de Henares water network were achieved by inserting 15 flow meters on boundary pipes to ensure the hydraulic connection with the sources. To compute the performance indices, a design pressure h*=25 m was employed.
In Table 1 and 2, energy and topological performance indices, obtained with or without weights showing a very good performance with values significantly closer to the original network (resilience deviation indices Ird is ever lower than 20% for all cases).
Specifically, the hydraulic performances of partitioning layout, W1 (no-weight), are slightly different from the original network layout, as indicated by a low value of resilience deviation, about 3.6%. Despite the large number of closed pipes, the surplus of energy in layout W1 is very similar to that available in non-partitioning layout, as well as confirmed by the hydraulic performance indices of W1 which are almost equivalent to ones computed for the original network.
Conversely, layout W2, obtained with pipe diameter as weight, shows a resilience deviation more large than other two configurations (Ird=20%), nevertheless in terms
Table 1 Hydraulic and energy Performance Indices
PI Network W1 W2 W3
hmin 18.57 18.47 18.78 16.10
hmean 47.03 46.26 42.77 44.70
hmax 63.98 63.58 60.82 60.32
hsd 8.96 8.86 6.84 8.78
Ir 0.948 0.914 0.760 0.850
Ird - 3.6 19.8 10.3
Table 2 Topological Performance Indices
PI Network W1 W2 W3
n1 - 1429 906 1140
n2 - 1047 1238 930
n3 - 846 805 1598
n4 - 1432 1438 1139
n5 - 935 1624 1103
n6 - 1308 978 782
n7 - 1633 950 1385
n8 - 731 1488 1305
n9 - 1157 998 1097
n10 - 958 1051 997
Ib - 1.42 1.42 1.39
Id - 1.47 1.58 1.24
Nec - 79 102 100
Q - 0.887 0.890 0.892
APL 64.87 86.77 103.99 84.64
ΔAPL - 0.25 0.38 0.23
Finally, the layout W3, aimed to balance the water demand among the DMAs, shows an intermediate alteration of hydraulic performance (Ird=10%), but the minimum
pressure is lower than the other partitioning layouts. This configuration could be interesting because could support the Water Utility to define the minimum night flow [4], simply comparing the consumptions of each DMAs, and locate areas where focus on searching for water losses.
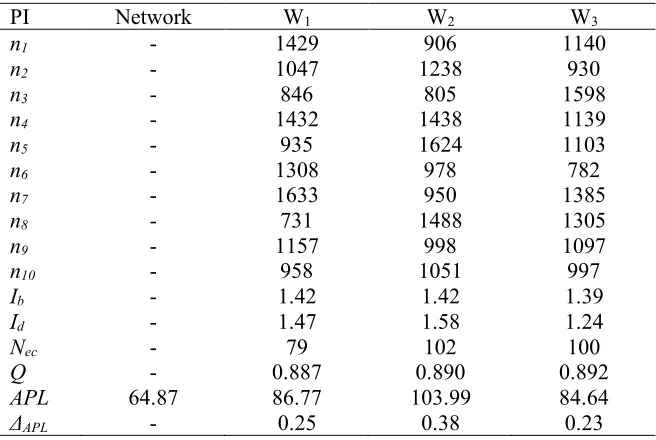
From a topological point of view, the proposed partitioning layout have different size and dimension, as shown in Figure 1. All studied configurations are unbalanced, the better-balanced layout is W3. Moreover, the low value of demand balance index,
Id=1.24 for W3, shows the effectiveness of proposed pipe-weight (Eq. 3). In this
The modularity metric is always higher than 0.3, for all partitioning layout Q>0.88 that shows a significant community structure in a network. Anyway, it is worth to highlight the effectiveness of the use of APL deviation that better catch the differences between three case studies. Indeed, for W3 layout, ΔAPL=0.23 is the lowest despite the
large number of edge cut, Nec=100, while the APL deviation of W1 is slightly higher
but with a considerable lower number of closed pipe; then W2 increases ΔAPL
significantly compared to other solutions because the arrangement of edge-cut pipes increases the number of steps of paths between all pairs of nodes.
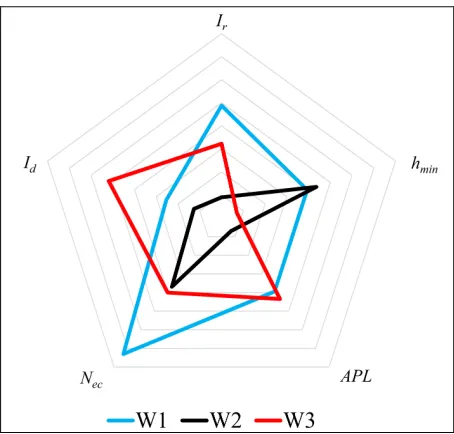
Finally, since the aim of SWANP is to provide a decision support system, it is possible to compare different partitioning solutions by means of a multi-criteria evaluation carried out plotting a radar diagram where the vertices represent the performance indices, standardized to a unit scale. Specifically, the best solution is the one that covers the widest area of diagram.
For this case study, the radar diagram of Figure 3 was obtained comparing five performance indices: resilience index, minimum pressure, average path length, edge-cut and demand balance index, but the user could choose all other indices computed in SWANP. The analysis of radar diagram reported in Figure 3, allows identifying W1 as the best partitioning layout; in fact, the solution without-weight W1 covers a wide area of the diagram outperforming the other two solutions.
Figure 3 Radar diagram of partitioning layouts
4 Conclusions
useful tool to carry out advanced performance analysis and to apply “divide and conquer” paradigm defining automatically optimal DMA of water network comparing different solutions with energy and topological performance indices. Specifically, the FG algorithm, already used in the social network analysis, coupled with a genetic algorithm to define heuristically the optimal positioning of flow meters and gate valves, provides an easy way to identify automatically an optimal water network partitioning for a large network with about 12,000 nodes. Finally, SWANP shows possible alternative displays of water distribution network opening novel perspectives for the operators of water utilities.
Reference
[1] H. Chourabi, T. Nam, S. Walker, J.R. Gil-Garcia,S. Mellouli, K. Nahon, T. Pardo, H.J. Scholl, Understanding Smart Cities: An Integrative Framework. In Proc. 45th Hawaii International Conference on System Sciences (HICCS 2012), IEEE Press, January, Maui, Hi, USA, (2012) 2289-2297.
[2] A. Di Nardo, M. Di Natale, D. Musmarra, G.F. Santonastaso, V.G. Tzatchkov, V.H. Alcocer Yamanaka, Dual-use value of network partitioning for water system management and protection from malicious contamination, J. Hydroinform. 17(3) 2015 361–376. [3] A. Di Nardo, M. Di Natale, G.F. Santonastaso, S. Venticinque, An automated tool for
smart water network partitioning, Water. Resour. Manag. 27(13) 2013 4493–4508. [4] Water Industry Research Ltd. (1999). A Manual of DMA Practice. London: UK Water
Industry Research.
[5] AWWA (American Water Works Association) Water Loss Control Committee Applying worldwide BMPs in water loss control, J. Am. Water Works Association 95(8) (2003) 65– 79.
[6] L.W. Mays, Water distribution systems handbook. McGraw-Hill, NewYork, 2000. [7] V. Traag, Algorithms and Dynamical Models for Communities and Reputation in Social
Networks. Springer International Publishing, 2014.
[8] O. Giustolisi, L. Ridolfi, New Modularity-Based Approach to Segmentation of Water Distribution Networks, J. Hydraul. Eng. 140(10) 2014 04014049.
[9] E. Campbell, J. Izquierdo, I. Montalvo, A. Ilaya-Ayza, R. Pérez-García, M. Tavera, A flexible methodology to sectorize water supply networks based on social network theory concepts and multi-objective optimization, J. Hydrodyn. 18(1) 2016 62-76.
[10] C. Ciaponi, E. Murari, S.Todeschini, Modularity-Based Procedure for Partitioning Water Distribution Systems into Independent Districts, Water Resour. Manag. 30(6) 2016 2021-2036.
[11] A. Di Nardo, M. Di Natale, C. Giudicianni, D. Musmarra, G.F. Santonastaso, A. Simone, Water Distribution System Clustering and Partitioning Based on Social Network Algorithms, Procedia Engineer. 119 2015196-205.
[12] A. Di Nardo, M. Di Natale, D. Musmarra, G.F. Santonastaso, F.P. Tuccinardi, G. Zaccone, Software for partitioning and protecting a water supply network, Civ. Eng. Environ. Syst. 33(1) 2016 55-69.
[14] A. Di Nardo, M. Di Natale, C. Giudiciani, G.F. Santonastaso, V. Tzatchkov, J. M. Rodriguez Varela, Economic and Energy Criteria for District Meter Areas Design of Water Distribution Networks Software for partitioning and protecting a water supply network, Water 9(7) 2016 463.
[15] Z. Yang, R. Algesheimer, C. J. Tessone, A Comparative Analysis of Community Detection Algorithms on Artificial Networks, Sci Rep-Uk 6 2016 30750.
[16] A. Clauset, M.E. J Newman, C. Moore, Finding community structure in very large networks. Phys Rev E 70 2004 066111.
[17] G. Csardi, T. Nepusz T, The igraph software package for complex network research. InterJournal, Complex Systems 1965 2006.
[18] Z. Zhu, C. Wang, L. Ma , Y. Pan, Z. Ding, Scalable community discovery of large networks. In Proc. 9th International Conference on Web-Age Information Management, IEEE, 20-22 July 2008, Zhangjiajie, Hunan, China, (2008) 381–388.
[19] D.E. Goldberg, Genetic Algorithms in Search, Optimization and Machine Learning, Addison Wesley
Boston, MA 1989.
[20] G. Guest, E.E. Namey, E.E., Public Health Research Methods, SAGE Publications, 2014.
[21] E. Todini, Looped water distribution networks design using a resilience index based heuristic approach. Urban Water, 2(2) 2000 115–122.