Volume 3, 2018, Pages 1382–1387
HIC 2018. 13th International Conference on Hydroinformatics
Pipe System Characteristics vs. Reliability of Transient
Test-Based Techniques for Pipe Inspection
S. Meniconi
1and B. Brunone
21
Department of Civil and Environmental Engineering, University of Perugia, 06125 Perugia, Italy
Department of Civil and Environmental Engineering, University of Perugia, 06125 Perugia, Italy
Abstract
In this paper the results of field and numerical experiments executed in a real transmis-sion main are presented and discussed. Pressure waves injected into the pipe are generated by means of two quite different methodologies: pump shutdown and the Portable Pressure Wave Maker (PPWM) device.
1
Introduction
In drinkable water pipe systems, transmission mains (TMs) convey the whole discharge. As a consequence, even a small percentage of losses in TMs implies a large volume of non revenue water. However, until a few years ago, TMs were excluded from leak detection programs and in most cases the only action was to measure the inflow and outflow discharge. The two main reasons of such a behavior were: i) the unjustified conviction that leakage in TMs is negligible, and ii) the larger cost of inspection with respect to distribution networks. Nowadays things have changed radically: several technologies have been proposed for fault detection in TMs and experiments are in progress to test them. Roughly speaking, such technologies can be classified in two main families: the inline-type (ITT) and the transient test-based (TTBT) ones. To explore TMs, within the ITTs, sensors are inserted (e.g., puretechltd.com; echologics.com) whereas in TTBTs pressure waves are injected into the pipelines (e.g., [1]).
This paper clearly places in the research activity aiming the evaluation of the merits and drawbacks of TTBTs. Specifically, for given pipe system characteristics, the role played by the place where the pressure waves are injected with respect to the transient response of TMs is explored. The analysis is based on the field tests executed in a real TM with transients generated by means of two quite different methodologies: pump shutdown ([3]) and the Portable Pressure Wave Maker ([4]).
2
Transient tests
Figure 1: Trento TM layout (WF and T are the measurement sections at the well-field, and at 10000 reservoir, respectively; PPWM indicates the Portable Pressure Wave Maker device; note that a different length scale has been used for the main pipe and minor branches).
total length, L = 1321.97 m). Such a pipe, managed by Novareti S.p.A., connects the Spini
well-field (#1 in Fig. 1) to 10000 reservoir (#27 in Fig. 1). All the minor branches of the pipe (with a length, Lb, ranging between 0.7 m and 6.8 m) are inactive; all branches are in steel with the exception of the 12-14 high density polyethylene (HDPE) pipe. Pressure signal,H, has been measured by means of piezoresistive transducers just downstream of the check valve at the well-field (section WF in Fig. 1) and the PPWM at 10000 reservoir (section T in Fig. 1), respectively. The first series of tests has been executed at the well-field, by stopping abruptly the electricity supply (Fig. 2), whereas the second series transients have been generated by means of the PPWM installed at a distance of 13.8 m from 10000 reservoir (Fig. 3). In both cases the repeatability of the tests has been checked by repeating the same maneuver three times (Figs. 2 and 3). The pressure wave speed,a, maybe the most crucial quantity within TTBTs, has been evaluated on the basis of the acquired pressure signals and the obtained value is compatible with the mechanical and geometrical characteristics of the pipe.
3
Pressure signals analysis
0 5 10 15 20 25 30 35 40 45 50 230
240 250 260 270 280 290 300
time, t(s)
pressure signal,
H
(m)
H e,1 =HWF H
e,2 H
e,3
Figure 2: Pressure signals of the transient tests generated by pump shutdown at the Spini
well-field (note the remarkable repeatability of the tests).
0 0.5 1 1.5 2 2.5 3 3.5
267 267.5 268 268.5 269 269.5 270 270.5
pressure signal,
H
(m)
time, t(s)
H e,4 =HT H
e,5 H
e,6
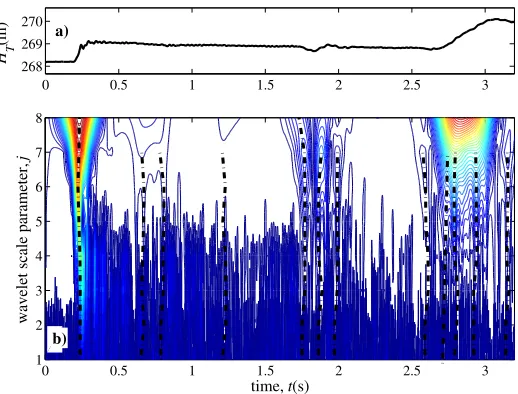
0 0.5 1 1.5 2 2.5 3 268
269 270
H T
(m)
0 0.5 1 1.5 2 2.5 3
1 2 3 4 5 6 7 8
time, t(s)
wavelet scale parameter,
j
a)
b)
Figure 4: Wavelet analysis of the pressure signal of one of the the transient tests generated by means of the PPWM at 10000 reservoir.
distance of 19 m from junction #12 (node #14), has reveled the malfunctioning of the in-line valve #13.
The analysis of the pressure signal, acquired during the transient test executed at the well-field (Fig. 2) and measured at section WF, carried out by means of the wavelet analysis during the first characteristics time (Fig. 5), clearly points out the limits of such a kind of approach (DTA), because of the larger duration of the maneuver (about 0.5 s), which affects the pressure signals and strongly influences the successive analysis. As a result, fault detection is not an easy task or better said, it is more difficult than expected and there is the need of using a numerical model to simulate the transients. As shown in [2], when complex pipe systems are examined, an integrated approach is needed by coupling DTA and ITA, where the characteristics of the defect (e.g., type, location, and severity) are the unknowns of the problem and are obtained within a calibration procedure by minimizing the difference between the measured data and the numerical model results.
As discussed in [3], the transient response of the Trento TM is largely different from the one expected if it behaved as a single pipe. An extensive analysis of the role of the minor branches, unsteady friction and viscoelasticity allowed to capture the main features of the examined pressure signals ([3]). The resulting numerical simulation (Fig. 6) is characterized by a quite large value (= 0.83) of the Nash-Sutcliffe efficiency coefficient. Moreover the malfunctioning of the in-line valve #13 has been confirmed.
4
Concluding Remarks
0 0.5 1 1.5 2 2.5 3 240
260 280
HWF
(m)
0 0.5 1 1.5 2 2.5 3
1 2 3 4 5 6 7 8
time, t (s)
wavelet scale parameter,
j
a)
b)
Figure 5: Wavelet analysis of the pressure signal of one of the transient tests generated by pump shutdown at theSpini well-field.
0 5 10 15 20 25 30 35 40 45 50
0 10 20 30 40 50 60 70 80 90
time, t (s)
pressure signal,
p
/
γ
(m)
p
WF/γ
p
n/γ: single pipe p
n/γ: branched pipe
transform. In such a context, the role played by the characteristics of the maneuver generating the transient is also discussed. The importance of the sharpness of the injected pressure waves is once again pointed out as a crucial feature of TTBTs which can contribute significantly to the success of the inspection.
5
Acknowledgments
This research has been funded by the Hong Kong (HK) Research Grant Council Theme-Based Research Scheme and the HK University of Science and Technology (HKUST) under the project
Smart Urban Water Supply System (Smart UWSS). Support from Italian MIUR and University
of Perugia is acknowledged within the programDipartimenti di Eccellenza 2018-2022.
References
[1] A.F. Colombo, P.J. Lee, and B.W. Karney. A selective literature review of transient-based leak detection methods. J Hydro-Environ Res, 2(4):212–227, 2009.
[2] S. Meniconi, B. Brunone, M. Ferrante, C. Capponi, C.A. Carrettini, C. Chiesa, D. Segalini, and E.A. Lanfranchi. Anomaly pre-localization in distribution-transmission mains. preliminary field tests in the milan pipe system. J. Hydroinform, 17:377–389, 2017.
[3] S. Meniconi, B. Brunone, and M. Frisinghelli. On the role of minor branches, energy dissipation, and small defects in the transient response of transmission mains. Water, 10(2):187, 2018. [4] S. Meniconi, B. Brunone, M. Frisinghelli, E. Mazzetti, M. Larentis, and C. Costisella. Safe transients