Genetic variability of rainbow trout (Oncorhynchus mykiss)
cultured in Iran using molecular RAPD markers
Afzali, M.
1; Rahimi Mianji, G
2*; Gholizadeh, M.
2Received: January 2012 Accepted: July 2013
Abstract
In the present study we evaluated the amount and distribution of genetic variation by using RAPD marker variation of 12 markers loci in three broodstock groups of rainbow trout. A total of 47 polymorphic bands were observed in Iranian strain, average number of bands was 10 and average number of polymorphic bands per primer was 3.92. The total detected bands in rainbow trout strain originated from French, was 120 bands with an average number of 10 bands per RAPD primer. A total of 117 amplified were detected in Norwegian population, with an average number of bands and average number of polymorphic bands per primer was 9.75 and 2.58, respectively. Data for observed and effective number of alleles, Nei’s genetic diversity and Shannon’s information index for all the three populations were 1.31, 1.20, 0.120 and 0.170, respectively. The mean coefficient of gene differentiation value and the estimate of gene flow across the populations were found as 0.299 and 0.171, respectively. The Nei measures of genetic distance and identity between pairs of rainbow trout strains indicate that the strain originated from France and Iran has the highest genetic identity, while the fish originated from Norway and France showed the greatest genetic distance.
Keywords: Genetic variation, Rainbow trout, Polymorphism, RAPD
______________________
1-Islamic Azad University, Sari Branch, Sari, Iran.
2-Laboratory for Molecular Genetics and Animal Biotechnology, Dept. of Animal Science, Faculty of Animal Science and Fisheries, Sari Agricultural Science and Natural Resources University, P.O. Box, 578 Sari, Iran.
*Corresponding author's email: rahimimianji@yahoo.com
___________________________________________________________________________________ Introduction
Rainbow trout reared in north of Iran are primarily descendants of early imports from Europe. However, industry production and broodstock development within rainbow trout farms in Iran was based primarily on reproduction of these strains. Most existing rainbow trout farms have little information on early origins or pedigrees of their broodstocks. The study of genetic variability is of prime importance for genetic approaches to fish conservation or breeding, which depend on knowledge of the amount of variation existing in within and between broodstock groups. In this work we analyzed the applicability of the Random Amplified Polymorphic DNA (RAPD) as molecular genetic marker to characterize the rainbow trout strains farmed in northern part of Iran, Mazandaran province. RAPD technique has received a great deal of attention from population geneticists because of its simplicity and rapidity in revealing DNA-level genetic variation (Skibinski, 1994). Major drawbacks of RAPD markers in population genetic studies of outbreeding organisms are the potential for reduced reproducibility and that they are dominant. Thus gene frequency estimates for such loci are necessarily less accurate than those obtained with codominant markers such as allozymes and RFLPs (Bardakci, 2001). It has been suggested that two to ten times more individuals need to be sampled for dominant markers to achieve the same degree of statistical power as codominant markers such as allozymes and RFLPs (Lynch and Milligan, 1994). Therefore, RAPD technique can be performed in a
moderate laboratory for most of its applications. Despite the reproducibility problem, the RAPD method will probably be important as long as other DNA-based techniques remain unavailable in terms of cost, time and labors (Bardakci, 2001). The ability of the RAPD technique to reveal intra-specific variation can be used in screening for the degree of inbreeding in commercial plant and animal species to prevent an increase in the frequency of deleterious recessive alleles in populations (Bardakci, 2001). In fishes, RAPD marker has been successfully used in phylogenetic studies (Prioli et al., 2002; Barman et al., 2003), population structure analysis (Sekine et al.,2002; Almeida et al., 2003), in fishery management and conservation genetics (Bártfai et al., 2003; Hatanaka and Galetti, 2003; Leuzzi et al., 2004). Jamshidi and Kalbassi (2010) used 16 Random amplified polymorphic DNA (RAPD) markers to estimate genetic relationships between two seasonal immigrant forms (namely fall-run and spring-run) of Caspian trout Salmo trutta caspius. Their results showed that the total number of RAPD bands produced in spring and fall-run were 162 bands, of which 69 and 53 bands were polymorphic for each population. Also, Nei's genetic identity and genetic distance between spring-run and fall-run populations were 0.9858 and 0.01430, respectively. Genetic variations is a key factor for populations to be able to face future environmental changes and to ensure long term response to selection, either natural or artificial, for traits of economic or cultural interest (Frankham et al., 2004). In Iran, the most of the rainbow trout strains that cultured
___________________________________________________________________________________ around the country originate from the
Norway, France and Iran. Despite the commercial importance of the rainbow trout in fish breeding industry of Iran, our knowledge on the genetic background of these fish population is generally not very extensive. Since characterization of the populations of a species is essential for effectual fishery management, the study of polymorphism and diversity of these populations is important to select the best broodstocks (Sajedi et al., 2003). The objective of this study was to evaluate the level of genetic diversity within and between of three rainbow trout strains, which are being widely used in fish breeding industry in north of Iran.
Materials and methods Sample collection
To estimate RAPD variations within and between strains, a total number of 150 individuals (50 per strain) were sampled from different breeding farms of rainbow trout in Mazandaran province with French, Norwegian and Iranian origin. Fin clip was cut from each individual and transferred in dry ice to the molecular genetics laboratory and stored at -20C until used for assay.
DNA isolation
Total genomic DNA was isolated according to the protocol of Jackson et al. (1991), with some minor modifications. About 50 mg of Fin clip was ground in 500 µL homogenized buffer (20 mM Tris-HCl pH: 7.5, 200 mM NaCl, 20 mM EDTA). Then 100 µL of 10% SDS and 3 µL Proteinase K (20 mg mL-1) were added and the mixture was incubated at 55 C for
overnight. DNA was purified with standard phenol: chloroform extractions, precipitated with ice cold absolute ethanol and resuspended in 50 µL TE (Tris-EDTA pH: 8) buffer. The concentration and quality of purified DNA was assessed by both spectrophotometry and agarose gel electrophoresis, respectively and then samples were stored at -20C until used in RAPD assay.
RAPD assay
Ethanol-precipitated DNA sample extracted from each individual was used as a template in RAPD procedures. The 23 different decamer oligonucleotides RAPD markers were used for genotyping of rainbow trout fishes in this study (Table 1). Genomic DNA was amplified by PCR and each 25-l reaction tube consisted of DNA (about 50-100 ng), 10 pmol of each primers, 200 M dNTP , 1 buffer (10 mM Tris, 50 mM KCl, 0.1% gelatin, pH. 8.4), 2.5 mM MgCl2 and 1 U Taq DNA
polymerase. Amplification was carried out for 35 cycles of 1 min at 95°C, 1 min at 41-45°C, 1 min at 72°C and final extension at 72°C for 10 min. The PCR products were analysed by electrophoresis through 1.5% agarose gel and visualized by ethidium bromide staining. The alleles were scored manually from the photographed gel and the genotypes of each individual fish at the different polymorphic loci were recorded by direct counting.
Analysis of data
RAPD banding patterns were scored visually from ethidium bromide staining agarose gel. For the analysis and comparison of the patterns, a set of
___________________________________________________________________________________
GS
GD
1
)
(
2
j i ij ijN
N
N
GS
distinct, well-separated bands were selected. The genotypes were analyzed in the form of binary variables by recording the presence (1) or absence (0) of these bands only, neglecting other (weak and unresolved groups of) bands. Each locus can be treated as a two-allele system, with only one of the allele per locus being amplifiable by the PCR. We also assumed that marker alleles from different loci do not co migrate to the same position on a gel, and that populations are under the Hardy-Weinberg equilibrium (Lynch and Milligan, 1994). Genetic similarity (GS) between individuals i and j was estimated according to the formula given by Nei and Li (1979):
Where Nij is the number of bands common
in individuals i and j, and Ni and Nj are the
total number of bands in individuals i and j, respectively, with regard to all assay units. Thus, GS reflects the proportion of bands shared between two individuals and ranges from 0 (no common bands) to 1 (all bands identical). Genetic dissimilarity (GD) was calculated as:
Nei’s unbiased genetic distance was calculated among different rainbow trout strains with all markers, including monomorphic markers. The Nei’s unbiased genetic distance is an accurate estimate of the number of gene differences per locus when populations are small. Total genotype diversity among (Ht) and within populations diversity (Hs) were calculated by applying the G-test to allele frequencies at all loci (Nei, 1978). The number of migrants per generation (Nm),
which represents inter-population gene flow, was obtained from Gst parameter by means of the formula Nm = (1 - Gst) / (Gst). The similarity matrix was subjected to cluster analysis by unweighted pair group method for arithmetic mean (UPGMA) cluster analysis algorithm and a dendrogram was generated. POPGENE software (population genetic analysis) Version 1.31 (Yeh et al., 1999) was used to calculate the genetic parameters.
Results
One hundred fifty genomic DNA samples were selected randomly from among the individuals of 3 rainbow trout strains cultured in North of Iran. These samples were then amplified with a total of 23 random primers (Table 1). Five RAPD markers did not amplify and not show any bands resulted from these markers. Six markers (AOPG13, AOPG14, AOPG16, AOPG17, ACS32 and ACS45) did not produce stable bands and was not included in data set for further analyses. Twelve out of 23 (AOPA2, AOPA3, AOPA5, AOPA10, AOPA12, AOPG3, AOPG5, AOPG7, AOPG8, AOPG9, AOPG10, AOPG13, AOPG14, AOPG15, AOPG16, AOPG17, AOPG18, AOPG20, AOPG21, ACS32, ACS402 ACS45 and AUBC516) which were amplified and generating stable and easy to score and reproducible bands were selected for genotyping of all individuals from three rainbow trout populations (Fig. 1). These 12 markers amplified fragments across all three strains studied (French, Norwegian and Iranian), with the number of bands ranging from 6 (AOPG3) to 13 (ACS40, AUBC516) which varied in size from 200 to 3300 bp. A total of 120 amplified bands in Iranian
___________________________________________________________________________________ strain, 47 were polymorphic, with an
average number of bands and average number of polymorphic bands per primer was 10 and 3.92, respectively. Percentage of polymorphic bands ranged from 20% (AOPA3, AOPG9) to a maximum of 81.81% (AOPG20), with an average of 37.76% polymorphism (Table 2). A total of 117 bands were detected in Norwegian population, with an average number of bands and average number of polymorphic bands per primer was 9.75 and 2.58,
respectively. Percentage of polymorphic bands ranged from 9.09% (AUBC516) to a maximum of 50% (AOPG3), with an average of 26.88% polymorphism (Table 3). The total detected bands from rainbow trout strain originated from French, was 120, with an average number of 10 bands per RAPD primer. Percentage of polymorphic bands ranged from 10% (AOPG9) to a maximum of 63.63% (AOPG20), with an average of 25.33% polymorphism (Table 4).
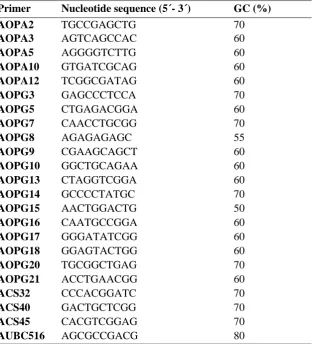
Table 1: Details of primer sequences for 23 RAPD markers employed for genetic characterization in three rainbow trout populations
Primer Nucleotide sequence (5´- 3´) GC (%)
AOPA2 TGCCGAGCTG 70
AOPA3 AGTCAGCCAC 60
AOPA5 AGGGGTCTTG 60
AOPA10 GTGATCGCAG 60
AOPA12 TCGGCGATAG 60
AOPG3 GAGCCCTCCA 70
AOPG5 CTGAGACGGA 60
AOPG7 CAACCTGCGG 70
AOPG8 AGAGAGAGC 55
AOPG9 CGAAGCAGCT 60
AOPG10 GGCTGCAGAA 60
AOPG13 CTAGGTCGGA 60
AOPG14 GCCCCTATGC 70
AOPG15 AACTGGACTG 50
AOPG16 CAATGCCGGA 60
AOPG17 GGGATATCGG 60
AOPG18 GGAGTACTGG 60
AOPG20 TGCGGCTGAG 70
AOPG21 ACCTGAACGG 60
ACS32 CCCACGGATC 70
ACS40 GACTGCTCGG 70
ACS45 CACGTCGGAG 70
AUBC516 AGCGCCGACG 80
___________________________________________________________________________________
Table 2: The total number of bands, polymorphic and monophormic bands, percentage of polymorphic bands of each RAPD markers as obtained from rainbow trout population of Iranian origin farmed in north of Iran
Primers NTB NPB NMB %PLM
AOPA2 10 3 7 30
AOPA3 11 5 6 45.45
AOPA5 8 2 8 20
AOPG3 6 3 3 50
AOPG5 8 1 7 12.5
AOPG7 11 5 6 45.45
AOPG9 10 2 8 20
AOPG10 9 3 6 33.33
AOPG15 10 3 7 30
AOPG20 11 9 2 81.81
ACS40 13 7 6 53.84
AUBC516 13 4 9 30.76
Mean 10.00 3.92 6.23 37.76
NTB=no. of total bands, NPB=no. of polymorph bands, NMB=no. of monomorph bands, %PLM=% of polymorphism.
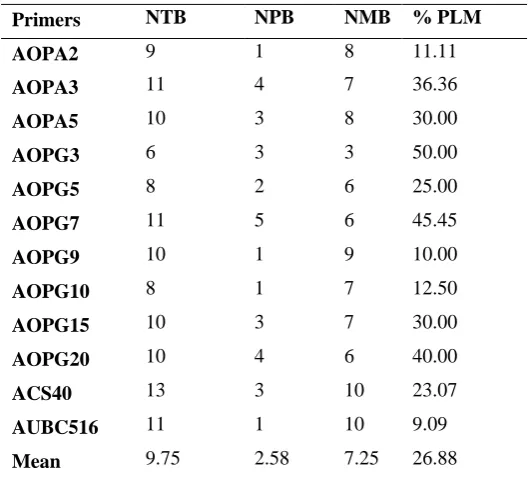
Table 3: The total number of bands, polymorphic and monophormic bands, percentage of polymorphic bands of all the DNA samples as obtained from rainbow trout population of Norwegian origin farmed in north of Iran
Primers NTB NPB NMB % PLM
AOPA2 9 1 8 11.11
AOPA3 11 4 7 36.36
AOPA5 10 3 8 30.00
AOPG3 6 3 3 50.00
AOPG5 8 2 6 25.00
AOPG7 11 5 6 45.45
AOPG9 10 1 9 10.00
AOPG10 8 1 7 12.50
AOPG15 10 3 7 30.00
AOPG20 10 4 6 40.00
ACS40 13 3 10 23.07
AUBC516 11 1 10 9.09 Mean 9.75 2.58 7.25 26.88
NTB=no. of total bands, NPB=no. of polymorph bands, NMB=no. of monomorph bands, % PLM=% of polymorphism.
___________________________________________________________________________________
Table 4: The total number of bands, polymorphic and monophormic bands, percentage of polymorphic bands of all the DNA samples as obtained from rainbow trout population of French origin farmed in north of Iran
Primers NTB NPB NMB % PLM
AOPA2 10 2 8 20.00
AOPA3 11 2 9 18.18
AOPA5 10 2 8 20.00
AOPG3 6 1 5 16.66
AOPG5 8 1 7 12.5
AOPG7 10 2 8 18.18
AOPG9 10 1 9 10.00
AOPG10 9 3 6 33.33
AOPG15 10 3 7 30.00
AOPG20 10 7 3 63.63
ACS40 13 3 10 23.07
AUBC516 13 5 8 38.46
Mean 10.00 2.67 7.33 25.33
NTB=no. of total bands, NPB=no. of polymorph bands, NMB=no. of monomorph bands, % PLM=% of polymorphism.
Table 5: Summary of genetic parameters estimate for three strains of rainbow trout farmed in north of Iran using RAPD markers
Populations Na Ne h I
Iran 1.39 1.25 0.15 0.22
Norway 1.26 1.14 0.09 0.13
France 1.27 1.21 0.11 0.16
Mean 1.31 1.20 0.12 0.17 Na: observed no. of alleles, Ne: effective no. of alleles, h: Nei’s genetic
diversity, I: Shannon’s information index,
Table 6: Summary analysis of genetic variability across all three strains of rainbow trout populations
Parameters Ht Hs Gs Nm
Across populations 0.163 0.114 0.299 0.171
Ht and Hs: total genotype diversity among and within populations, Gs: mean coefficient of gene differentiation, Nm: estimate of gene flow.
___________________________________________________________________________________ Table 7: Nei’s (1978) genetic distance (below diagonal) and genetic identity
(above diagonal), with Lynch and Milligan correction (1994), between three rainbow trout strains farmed in north of Iran
Origin of strain France Iran Norway France ***** 0.9520 0.9008
Iran 0.0491 ***** 0.9055
Norway 0.1044 0.0992 *****
Figure 1:Amplification products of one primer (AUBC516) of: A: French, B: Iranian and C: Norwegian rainbow trout strains. M: Molecular weight markers
Figure 2: Dendrogram obtained with UPGMA method based on Nei's DA distance for three rainbow trout strains farmed in north of Iran
Discussion
It has been shown that domesticated fish strains lose genetic variation through
founder effects, genetic drift and selection. Except for fully pedigreed strains, the amount of genetic variation
___________________________________________________________________________________ lost and the relative importance of these
three processes are rarely known (Withler et al., 2005). If a few founder individuals are used to produce offspring and a few of these offspring are used later as founder individuals themselves, this will create an even narrower bottleneck compared to the situation where few founder individuals are used but are replaced continuously with wild-caught individuals (Aho et al., 2006). The rainbow trout farming in Iran have generally been based on small numbers of broodstock. The loss of variation at RAPD loci close to average of 30% across three rainbow trout strains in the present study may attributed primarily to founder effects that occurred with the initiation of rainbow trout farming in north of Iran. The use of such broodstock groups would obviously lead to rapid genetic drift and increased homozygosity if carried on over generations. Data for observed number of alleles, effective number of alleles, Nei’s genetic diversity, Shannon’s information index, for all the three populations were analyzed using twelve RAPD markers and their respective values were found as 1.31, 1.20, 0.120 and 0.170 (Table 5). It has been reported the average of 3.80-4.10 alleles per locus in four populations of Australian rainbow trout, with average heterozygosities of around 0.47-0.58 analyzed by microsatellite markers (Ward et al., 2003). In the present study, the values for total genotype diversity among population (Ht) were 0.163 while within population diversity (Hs) was found to be 0.114. Mean coefficient of
gene differentiation (Gst) value and the estimate of gene flow across the populations (Nm) was found as 0.299 and 0.171, respectively (Table 6). The Nei (1978) measures of genetic distance and identity between pairs of rainbow trout strains are given in Table 7 and indicate that the strains originated from France and Iran have the highest identity (0.9520), and the Norway and France populations the greatest genetic distance (0.1044). In the genetic similarity dendrogram constructed on the basis of comparative analysis of the total loci obtained with the 12 RAPD primers across the three populations, two clusters can be seen (Fig. 2). The first was formed by 2 strains from Iran, and France and the second formed by the Norwegian strain. The analyzed data in the present study indicate that the Iranian rainbow trout may be originated from imported French strain in the earlier years. The results of the present study can be seen as a starting point for future research work for detecting the level of within and between strains genetic diversity and to detect genetic relationship among these populations. For this purpose, a larger number of samples of the three strains collected from the whole distribution area should be analyzed and additional codominant DNA markers such as microsatellite tested. Furthermore, in order to design new diagnostic markers more effective in genetic discrimination among strains, specific bands which has been found within each strain could be cloned and sequenced. These studies have given important information in understanding
___________________________________________________________________________________ genotype relationship, which may
further assist in developing and planning breeding programs. Among strains surveyed in this study, the low level of intra and inter-strain genetic diversity were found in rainbow trout populations. The major reasons for loss of genetic variation in broodstock populations may be as a result of bottlenecks and small effective population sizes, due to inappropriate mating designs. It is therefore of great importance that hatchery methods are optimized with regard to mating designs by implementation of pedigreed breeding programmes or identification of individual fish to broodstock and strain of origin for individual companies using molecular markers for preserving genetic variation and passing that variation on to the next generation.
Acknowledgements
We highly appreciate the staff of all fish farms (Kalantari, Mousavi and Miar) for their helpful, cooperation and kind assistance during sample collection. References
Aho, T., Rönn, J., Piironen, J. and Björklund, M., 2006. Impacts of effective population size on genetic diversity in hatchery reared Brown trout (Salmo trutta ) populations. Aquaculture, 253, 244-248
Almeida, S. F., Sodre, L. M. K. and Contel, E. P. B., 2003. Population structure analysis of Pimelodus maculatus (Pisces, Siluriformes) from the Tietê and Paranapanema rivers (Brazil). Genetics and Molecular Biology, 26, 301-305.
Barman, H. K., Barat, A., Yadav, B. M., Banerjee, S., Meher, P. M. P., Reddy, V. G. K. and Jana, R. K., 2003. Genetic variation between four species of Indian major carps as revealed by random amplified polymorphic DNA assay. Aquaculture, 217, 115-123.
Bártfai, R., Egedi, S., Yue, G. H., Kovács, B., Urbányi, B., Tamás, G., Horváth, L. and Orbán, L., 2003. Genetics analysis of two common carp broodstocks by RAPD and microsatellite markers. Aquaculture, 219, 157-167.
Frankham, R., Ballou, J. D. and Briscoe, A., 2004. Introduction to conservative genetics. Genetic Research, 83, 21-223.
Hatanaka, T. and Galetti, P. M., 2003. RAPD markers indicate the occurrence of structured populations in a migratory freshwater fish species.
Genetics and Molecular Biology, 26, 19-25.
Jackson, D. P., Hayden, J. D. and Qurik, P., 1991. Extraction of nucleic acid from fish and archival material. In: PCR, a practical approach. (Macpherson, M. J., Qurik, P. and Taylor, G. R.,). New York: Oxford University Press. 29-50.
Jamshidi, S. and Kalbassi, M. R., 2011. Conspecific relation between two seasonal migratory forms of endangered Caspian trout, Salmo trutta caspius Kessler, 1877, revealed by RAPD markers. Iranian Journal of Fisheries Science, 10, 437-446. Leuzzi, M. S. P., Almeida, F. S., Orsi,
M. L. and Sodré, L. M. K., 2004.
___________________________________________________________________________________ Analysis by RAPD of the genetic
structure of Astyanax altiparanae
(Pisces, Characiformes) in reservoirs on the Paranapanema River, Brazil.
Genetics and Molecular Biology, 27, 355-362.
Liu, Z. J. and Cordes, J. F., 2004. DNA marker technologies and their applications in aquaculture genetics. Aquaculture, 238, 1-37.
Lynch, M. and Milligan, B. G., 1994. Analysis of population genetic structure with RAPD markers. Molecular Ecology, 3, 91-99.
Nei, M., 1978. Estimation of average heterozygosity and genetic distance from a small number of individual. Genetics, 89, 583-590.
Nei, M. and Li, W. H., 1979. Mathematical modelling for studying genetic variation in terms of restriction endonucleases. Proceedings of the National Academy of Sciences.76, 5269-5273.
Paran, I. and Michelmore, R. W., 1993. Development of reliable PCR-based markers linked to downy mildew resistance genes in lettuce. Theoretical and Applied Genetics, 85, 985-993.
Prioli, S. M. A. P., Prioli, A. J., Júlio Jr, H. F., Pavanelli, C. S., Oliveira,
A. V., Carrer, H. and
Carrarodmanf Prioli, L. M., 2002. Identification of Astyanax altiparanae
(Teleostei, Characidae) in the Iguaçu River, Brazil, based on mitochondrial DNA and RAPD markers. Genetics and Molecular Biology, 25, 421-430.
Sajedi, R. H., Aminzadeh, S., Naderi-Manesh, H., Sadeghizadeh, M., Abdolhay, H. and Naderi-Manesh, M., 2003. Genetic Variation Within and Among Rainbow Trout, Oncorhynchus mykiss, Hatchery Populations from Iran Assessed by PCR-RFLPAnalysis of Mitochondrial DNA Segments. Journal of Food Science,68(3), 870-873.
Sekine, E. S., Prioli, A. J., Prioli, S. M. A. P. and Júlio, JR, H. F., 2002. Genetic differentiation among populations of Pseudoplatystoma corruscans isolated by the Guaíra Falls in the Paraná River. Acta Scie ntiarum, 24, 507-512.
Skibinski, D. O. F., 1994. Potential of DNA techniques in the population and evolutionary genetics of aquatic invertebrates. Genetics and Evolution of Aquatic Organisms. London: Chapman and Hall, 177-199.
Ward, R. D., Jorstad, K. E. and Maguire, G. B., 2003. Microsatellite diversity in rainbow trout (Oncorhynchus mykiss) introduced to Western Australia. Aquaculture, 219, 169-179.
Withler, R. E., Supernault, K. J. and Miller, K. M., 2005. Genetic variation within and among domesticated Atlantic salmon broodstocks in British Columbia, Canada. Animal Genetic, 36, 43-50. Yeh, F. C., Yang, R. C. and Boyle, T.,
1999. POPGENE 32-version 1.31. Population Genetics Software.