Usability Questionnaire (MPUQ)
Abstract
This study was a follow-up to determine the psychometric quality of the usability questionnaire items derived from a previous study (Ryu and Smith-Jackson, 2005), and to find a subset of items that represents a higher measure of reliability and validity. To evaluate the items, the questionnaire was
administered to a representative sample involving approximately 300 participants. The findings revealed a six-factor structure, including (1) Ease of learning and use, (2) Assistance with operation and problem solving, (3) Emotional aspect and multimedia capabilities, (4) Commands and minimal memory load, (5) Efficiency and control, and (6) Typical tasks for mobile phones. The appropriate 72 items constituted the Mobile Phone Usability Questionnaire (MPUQ), which evaluates the usability of mobile phones for the purpose of making decisions among competing variations in the end-user market, determining alternatives of prototypes during the development process, and evolving versions during an iterative design process.
Keywords
usability, mobile user interface, questionnaire, reliability, validity
Permission to make digital or hard copies of all or part of this work for personal or classroom use is granted without fee provided that copies are not made or distributed for profit or commercial advantage and that copies bear this notice and the full citation on the first page. To copy otherwise, or republish, to post on servers or to redistribute to lists, requires prior specific permission and/or a fee. Copyright 2005, UPA.
Young Sam Ryu
Industrial Engineering Program
Department of Engineering and Technology Texas State University-San Marcos San Marcos, TX 78666 USA
Tonya L. Smith-Jackson
Department of Industrial and Systems Engineering Virginia Tech
Introduction
There have been many efforts to develop usability questionnaires for software product evaluation. However, there have been indications that existing questionnaires and scales, such as SUMI, QUIS, and PSSUQ are too generic (Keinonen, 1998; Konradt, Wandke, Balazs, and Christophersen, 2003). The developers of those questionnaires indicated that deficiencies in their questionnaires can be taken care of by establishing a context of use, characterizing the end user population, and understanding the tasks for the system to be evaluated (van Veenendaal, 1998). To integrate those considerations into the usability questionnaire, the need for more specific
questionnaires tailored to particular groups of software products has increased.
In response to the need, questionnaires tailored to particular groups of software have been developed, such as Website Analysis and Measurement Inventory (WAMI) (Kirakowski and Cierlik, 1998) for website usability, Measuring Usability of Multi-Media Systems (MUMMS) for evaluating multimedia products, and the Usability Questionnaire for Online Shops (UFOS) (Konradt et al., 2003) for measuring usability in online merchandisers. However, since the existing
questionnaires focus on software products, they may not be applicable to electronic consumer products because, in addition to the software (e.g., menus, icons, web browsers, games, calendars, and organizers), the hardware (e.g., built-in displays, keypads, cameras, and aesthetics) is a major component.
Electronic mobile products have become a major indicator of consumers’ life styles and primary tools for
everyday life. Based on the popularity of electronic mobile products and the need for a usability questionnaire that is specific to this technology, questionnaire sets for mobile phones were developed (Ryu and Smith-Jackson, 2005). The definition of usability in ISO 9241-11 was used to conceptualize the target construct, and the initial questionnaire items pool was developed from various existing
questionnaires, comprehensive usability studies, and other sources related to mobile devices. Through redundancy and relevancy analyses completed by representative mobile user groups, a total of 119 for mobile phones were retained from the 512 items of the initial pool (Ryu and Smith-Jackson, 2005).
Subjective usability measurement using questionnaires is regarded as a psychological measurement, since usability is held to emanate from a psychological phenomenon (Chin, Diehl, and Norman, 1988;
Kirakowski, 1996; LaLomia and Sidowski, 1990; Lewis, 1995). Many usability researchers have adopted psychometric approaches to develop their
measurement scales (Chin, Diehl, and Norman, 1988; Kirakowski and Corbett, 1993; Lewis, 1995). The goal of psychometrics is to establish the quality of
psychological measures (Nunnally, 1978). To achieve a higher quality of psychological measures, it is
fundamental to address the issues of reliability and validity of the measures (Ghiselli, Campbell, and Zedeck, 1981).
of validity may vary across fields, while the adequacy of the scale (e.g., questionnaire items) as a measure of a specific construct (e.g., usability) is an issue of validity (DeVillis, 1991; Nunnally, 1978). Three types of validity correspond to psychological scale development, namely content validity, criterion-related validity, and construct validity (DeVillis, 1991). There are various specific approaches to assess those three types of validity, which are beyond the scope of this study. However, it is certain that validity is a matter of degree rather than an all-or-none property (Nunnally, 1978).
The purpose of this study was to establish the quality of the questionnaire derived from Ryu and Smith-Jackson (2005) and to find a subset of items that represents a higher measure of reliability and validity. Thus, the appropriate items can be identified to constitute the Mobile Phone Usability Questionnaire (MPUQ).
Method
The following methods were used to design the questionnaire, to select the participants, and to administer the questionnaire.
Design
Comfrey and Lee (1992) suggested the rough
guidelines for determining adequate sample size as 50-very poor, 100-poor, 200-fair, 300-good, 500-50-very good, and 1000 or more-excellent. However, Nunnally (1978) also suggested a rule of thumb that the number of subjects to item ratio should be at least 10:1, and Gorsuch (1983) and Hatcher (1994) recommend 5:1.
For this research, the questionnaire was administered to a sample of 286 participants. Since the number of items was 119, the number of participants was slightly
more than twice the number of items; the subject to item ratio is 2:1, which is smaller than the ratio suggested by the literature. For this reason, any association of items to factors should be regarded as provisional. Figure 1 shows a sample question of the items administered.
# Is it easy to change the ringer signal? Strongly
Disagree
Strongly Agree 1 2 3 4 5 6 7
Figure 1. A sample of the questionnaire items
The collection of response data was subjected to principal factor analysis (PFA) using the orthogonal rotation method with the varimax procedure to verify the number of different dimensions of the constructs related to usability of mobile products and to reduce the number of items to a more manageable number. Reliability tests were performed using Cronbach’s alpha coefficient to estimate quantified consistency of the questionnaire. Also, construct validity was assessed using a known-group validity test based on the mobile user group categorization established by International Data Corporation (IDC, 2003).
Participants
laptops for their work-related duties, but now favoring the lightweight solution of a Pocket PC with a VGA-out card (Newman, 2003). Mobile Elites would carry
convergence devices, such as a smart-phone, as well as digital cameras, MP3 players and sub-notebooks. Minimalists would use only a mobile phone.
Table 1. Categorization of mobile users (IDC, 2003) quoted by Newman (2003)
Label of Users
Description
Display Mavens
Users who primarily use their devices to deliver presentations and fill downtime with entertainment applications to a moderate degree
Mobile Elites
Users who adopt the latest devices, applications, and solutions, and also use the broadest number of them
Minimalists
Users who employ just the basics for their mobility needs; the opposite of the Mobile Elite
Voice/Text Fanatics
Users who tend to be focused on text-based data and messaging; a more communications-centric group
Assuming that mobile users can be categorized into several clusters, the sample of participants was recruited from the university community at Virginia Tech, almost exclusively including undergraduate students who currently used mobile devices.
Participants were screened to exclude anyone who had any experience as an employee of a mobile service company or mobile device manufacturer.
Participants were required at the beginning of the questionnaire to self-identify with the group to which they thought they belonged among the four user types in Table 1. If they thought they belonged to multiple groups among the four, they were allowed to choose multiple groups. This information was useful for assessing known-group validity of the questionnaire, which is one of the construct validity criteria for the development of a questionnaire (DeVillis, 1991; Netemeyer, Bearden, and Sharma, 2003).
Procedure
After being provided with the set of questionnaire items derived from Ryu and Smith-Jackson (2005),
participants were asked to answer each item using their own mobile device as the target product. The response format used a seven-point, Likert-type scale.
Results
This section describes the statistical analyses and validation performed on the questionnaire data.
User Information
Of the 286 participants, 25% were males and 75% were females. The Minimalists (48%) and Voice/Text Fanatics (30%) were the majority groups in the sample (Table 2). Nine participants belonged to both
Table 2. User categorization of the participants
User group ParticipantsNumber of Percentage
Minimalists 137 47.90 %
Voice/Text Fanatics 73 25.52 %
The Mobile Elites 45 15.73 %
Display Mavens 10 3.50 %
Minimalists and
Voice/Text Fanatics 9 3.15 %
Display Mavens and
Voice/Text Fanatics 4 1.40 %
The Mobile Elites and
Voice/Text Fanatics 4 1.40 %
Display Mavens and
Minimalists 2 0.70 %
The Mobile Elites and
Minimalists 2 0.70 %
Factor Analysis
The objectives of data analysis of this study were to classify the categories of the items, to build a hierarchical structure of them, and to reduce redundancy based on the items’ psychometric
properties. A factor analysis was performed to achieve these objectives.
Factor analysis is typically adopted as a statistical procedure that examines the correlations among questionnaire items to discover groups of related items (DeVillis, 1991; Lewis, 2002; Netemeyer, Bearden, and Sharma, 2003; Nunnally, 1978). A factor analysis was conducted to identify how many factors (i.e., constructs or latent variables) underlie each set of items. Hence, this factor analysis helped to determine whether one or several specific constructs would be needed to
characterize the item set. For example, PSSUQ (Lewis,
1995) was divided through factor analysis into three aspects of a multidimensional construct (i.e., usability), namely System Usefulness, Information Quality, and Interface Quality (Lewis, 1995; Lewis, 2002), and SUMI (Kirakowski and Corbett, 1993) was divided into five dimensions, namely Affect, Control, Efficiency, Learnability, and Helpfulness. Also, factor analysis helps to discern redundant items (i.e., items that focus on an identical construct). If a large number of items belong to the same factor, some of the items in the group could be eliminated because they measure the same construct.
0 10 20 30 40 50 60 70
1 2 3 4 5 6 7 8 9 10 11 12 13 14 15 16 17 18 19 20
Eigenvalue Number
E
ige
n
v
a
lue
S
iz
e
Figure 2. Scree plot to determine the number of factors
Usually, naming the factors is one of the most challenging tasks in the process of exploratory factor analysis (Lewis, 1995), since abstract constructs should be extracted from the items in the factors. In order to identify the characteristics of items within each factor and to assign the names for the groups, a close examination of the items, along with the sources of the items, and categorical information from the sources was conducted. For example, most items in the factor 1 group derived from the revised items combined from the redundant items in Ryu and Smith-Jackson (2005), except for the two items that are individual (non-redundant).
Among the 29 items that were not included in any factor were multiple items relating to flexibility and user guidance. However, since their factor loadings did not exceed 0.40, the items were not retained for further refinement. After the close examination for redundancy within each factor, the redundant items
were also reduced. Also, items were rearranged into more meaningful groups. As a result, a total of 72 items were retained, and Table 3 shows the summary of the arrangement, along with the name of each factor; each factor constituted a separate subscale.
Table 3. Arrangement of items between the factors after items reduction
Factor Number of Items Representative Characteristics
1 23 Learnability and ease of use (LEU)
2 10 Helpfulness and problem solving capabilities (HPSC)
3 14 Affective aspect and multimedia properties (AAMP)
4 9 Commands and minimal memory load (CMML) 5 9 Control and efficiency (CE) 6 7 Typical tasks for mobile phones (TTMP) Total 72
Scale Reliability
Cronbach’s coefficient alpha (Cronbach, 1951) is a statistic used to test reliability in questionnaire development across various fields (Cortina, 1993; Nunnally, 1978). Coefficient alpha estimates the degree of interrelatedness among a set of items and variance among the items. A widely advocated level of adequacy for coefficient alpha has been at least 0.70 (Cortina, 1993; Netemeyer, Bearden, and Sharma, 2003).
and Sharma, 2003). As the number of items increases, the alpha will tend to increase. The mean inter-item correlation will increase if the coefficient alpha increases (Cortina, 1993; Netemeyer, Bearden, and Sharma, 2003). In other words, the more redundant items there are (i.e., those that are worded similarly), the more the coefficient alpha may increase.
Table 4 shows the coefficient alpha values for each factor, as well as all the items in the questionnaire. All values of coefficient alpha exceeded 0.80.
Table 4. Coefficient alpha values for each factor and all items.
Factor Number of
Items Coefficient alpha
LEU 23 0.93
HPSC 10 0.84
AAMP 14 0.88
CMML 9 0.82
CE 9 0.84
TTMP 7 0.86
Total 72 0.96
Known-group Validity
There are three aspects or types of validity, namely content validity, criterion-related validity (i.e., also known as predictive validity), and construct validity, although the classification of validity may vary across fields and among researchers. For example, people often confuse construct validity and criterion-related validity because the same correlation information among items can serve the purpose of either theory-related (construct) validity or purely predictive (criterion-related) validity (DeVillis, 1991; Netemeyer, Bearden, and Sharma, 2003).
As a procedure that can be classified either as construct validity or criterion-related validity (DeVillis, 1991), known-group validity demonstrates that a
questionnaire can differentiate members of one group from another based on their questionnaire scores (Netemeyer, Bearden, and Sharma, 2003). Evidence that supports the validity of the known-group approach is provided by significant differences in mean scores across independent samples. First, the mean scores of the response data to the questionnaire across samples of four different user groups (i.e., Display Mavens, Mobile Elites, Minimalists, and Voice/Text Fanatics) were compared. However, there was no significant difference in the mean scores across the four user groups, F(3,223)=2.21, p=0.0873.
Also, the mean scores for each identified factor were compared to identify factors in which between-group differences exist. The HPSC factor earned lower scores, and the TTMP factor was scored higher than other factors (Figure 3). The Voice/Text Fanatics group gave higher scores than the other user groups for most factors, except for the AAMP factor. The Display Mavens group gave lower (but not significantly lower) scores for factor LEU (F(3,223)=2.01, p=0.11). The mean scores of factors AAMP were significantly different across the user groups, F(3,223)=3.75, p=0.01. TTMP across the user groups were significantly different (F(3,223)=3.74,
4 5 6 7
LEU HPSC AAMP CMML CE TTMP
Factor Group
Sc
o
re
Display Mavens Minimalist Mobile Elites Voice and Text Fanatics
Figure 3. Mean scores of each factor as a function of user group
Discussion
This section discusses the patterns found in the factor analysis, identifies limitations of the questionnaire, and provides a comparison of MPUQ.
Normative Patterns
According to the mean scores of each factor with respect to user groups (Figure 3), it can be inferred that all mobile user groups have high expectations on HPSC factor of mobile products. This is evidenced by the average scores of the HPSC factor, which were lower than the average score on all other factors,
F(5,23)=22.52, p<0.01. Also, users tended to be satisfied with the usability of typical tasks for mobile phones. In other words, most users did not find it difficult to perform typical tasks of using mobile phones, such as making and receiving phone calls, using the phonebook, checking call history and voice mail, and sending and receiving text messages.
Limitations
As mentioned in the design section, the subject to item ratio for the factor analysis was 2:1, which is relatively smaller than the ratio suggested by Nunally (1978), Gorsuch (1983) and Hatcher (1994). Thus, the factor structure found in this study should be considered provisional.
Because the MPUQ has been (at least provisionally) psychometrically qualified, it can be considered a valid and reliable usability testing tool for the evaluation of mobile phones. The six-factor structure provided an idea of relative importance or contribution because each factor consisted of different numbers of items. For example, if a usability practitioner would like to make a decision to select a better product or version of an alternative design, he or she could simply take the mean of the response scores of all 72 questions. In this case, factor LEU items account for 32% (23 out of 72), factor HPSC items account for 14% (10 out of 72), factor AAMP items account for 19% (14 out of 72), factor CMML items account for 13% (9 out of 72), factor CE items account for 13% (9 out of 72), and factor TTMP items account for 10% (7 out of 72). Thus, the mean score reflects a different priority from each factor.
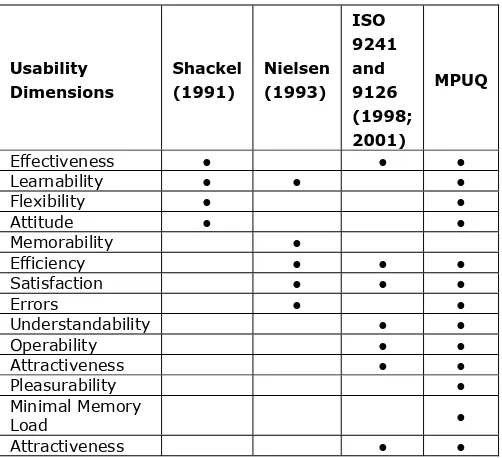
Comparisons of MPUQ
Table 5. Comparison of usability dimensions from the usability definitions with those the MPUQ covers modified from Keinonen (1999)
Usability Dimensions
Shackel (1991)
Nielsen (1993)
ISO 9241 and 9126 (1998; 2001)
MPUQ
Effectiveness ● ● ●
Learnability ● ● ●
Flexibility ● ●
Attitude ● ●
Memorability ●
Efficiency ● ● ●
Satisfaction ● ● ●
Errors ● ●
Understandability ● ●
Operability ● ●
Attractiveness ● ●
Pleasurability ●
Minimal Memory
Load ●
Attractiveness ● ●
In comparing the subjective usability criteria of MPUQ with those of the other existing usability
questionnaires, MPUQ covered most criteria that the Software Usability Measurement Inventory (SUMI), Questionnaire for User Interaction Satisfaction (QUIS), and PSSUQ covered. In addition, MPUQ added new criteria lacking in the others, such as pleasurability and specific tasks performance (Table 6).
Table 6. Comparison of subjective usability criteria MPUQ with the existing usability questionnaires modified from Keinonen (1999)
Usability Criteria SUMI QUIS PSSUQ MPUQ
Satisfaction ● ●
Affect ● ● ●
Mental effort ●
Frustration ● ●
Perceived
usefulness ● ●
Flexibility ●
Ease of use ● ● ●
Learnability ● ● ● ●
Controllability ● ●
Task
accomplishment ● ● ●
Temporal
efficiency ● ● ●
Helpfulness ● ●
Compatibility ● ●
Accuracy Clarity of
presentation ● ●
Understandability ● ● ● ●
Installation ● ●
Documentation ● ●
Pleasurability ●
Specific Tasks ●
Feedback ● ●
Conclusion
to a representative sample of 286 participants. A factor analysis on 72 items revealed a six-factor structure in the MPUQ. The six factors consisted of (1) Ease of learning and use, (2) Assistance with operation and problem solving, (3) Emotional aspect and multimedia capabilities, (4) Commands and minimal memory load, (5) Efficiency and control, and (6) Typical tasks for mobile phones.
Future Work
Although the mobile usability questionnaire developed in this study is a stand-alone tool of subjective usability assessment, a couple of expansion studies to develop methods to manipulate the response data from the questionnaire are in progress. First, multi-criteria decision-making methods (MCDM), such as Analytic Hierarchy Process (AHP), are being employed to develop decision models to produce usability scores from the responses to the questionnaire. Also, a case study of comparative usability evaluations using MPUQ is being performed to differentiate the usability of various mobile phones and to validate the usefulness of MPUQ. In the study, the response from an existing usability questionnaire (e.g., PSSUQ) will be compared with the one from MPUQ to investigate the correlation between measures of interest.
To enhance the ability to identify usability problems, as well as to provide specific design recommendations in terms of specific features or interface elements, it would be very helpful to add the information of corresponding design features and interface elements to each questionnaire item. Once a knowledge base is established in the form of a database, design
recommendations can be generated automatically according to the response data from the questionnaire.
To develop the knowledge base, analytical studies by subject matter experts or user evaluation sessions using the questionnaire and verbal protocol could be employed. For future research, the MPUQ will have mapping information for specific interface elements and features of electronic mobile products.
As we conduct these planned future studies, we will, as a consequence, continue collecting additional MPUQ data which we can then use to investigate the stability of our provisional factor structure.
Practitioner’s Take Away
The MPUQ can have a substantial and positive effect on evaluating the usability of mobile products for the purpose of making decisions among competing product variations in the end-user market, alternative prototypes during the development process, and evolving versions of a same product during an iterative design process.
Usability researchers, practitioners, and mobile device developers will be able to take advantage of MPUQ or the subscales of MPUQ to expedite their decision making in the comparative evaluation of their mobile products or prototypes.
The MPUQ is particularly helpful in evaluating mobile phones, because it is the first usability questionnaire tailored to these products.
Acknowledgements
Authors would like to express appreciation to the management staff of the Virginia Tech Psychology Experiment Management System and to all the participants recruited by the system.
References
Chin, JP, et al. (1988) Development of an instrument measuring user satisfaction of the human-computer interface. In Proceedings of ACM CHI'88, Washington, DC. Comfrey, AL and Lee, HB. (1992) A First Course in Factor Analysis. Hillsdale, NJ: Lawrence Erlbaum Associates. Cortina, JM. (1993) What is coefficient alpha? An
examination of theory and applications. Journal of Applied Psychology and Aging, 78, pp. 98-104.
Cronbach, LJ. (1951) Coefficient alpha and the internal structure of tests. Psychometrika, 16, pp. 297-334. DeVillis, RF. (1991) Scale Development: Theory and Applications. Newbury Park, CA: Sage.
Floyd, FJ and Widaman, KF. (1995) Factor analysis in the development and refinement of clinical assessment instruments. Psychological Assessment, 7, pp. 286-299. Ghiselli, EE, et al. (1981) Measurement theory for the behavioral sciences. San Francisco: Freeman.
Gorusch, RL. (1983) Factor Analysis (2nd ed.) Hillsdale, NJ: Lawrence Erlbaum Associates.
Green, SB, et al. (1977) Limitations of coefficient alpha as an index of test unidimensionality. Educational and Psychological Measurement, pp. 37, 827-838.
Hair, JF, et al. (1998) Multivariate Data Analysis (5th ed.) Englewood Cliffs, NJ: Prentice Hall.
Hatcher, L. (1994) A Step-by-Step Approach to Using the SAS® System for Factor Analysis and Structural Equation Modeling. Cary, N.C.: SAS Institutte, Inc.
IDC. (2003) Exploring Usage Models in Mobility: A Cluster Analysis of Mobile Users (No. IDC #30358): International
Data Corporation.
ISO 9241-11. (1998) Ergonomic requirements for office work with visual display terminals (VDTs) - Part 11: Guidance on usability. International Organization for Standardization.
ISO/IEC 9126-1. (2001) Software engineering- product quality - Part 1: Quality model. International Organization for Standardization.
Keinonen, T. (1998) One-dimensional usability - Influence of usability on consumers' product preference: University of Art and Design Helsinki, UIAH A21.
Kirakowski, J. (1996) The software usability measurement inventory: Background and usage. In PW Jordan, B. Thomas, BA Weerdmeester and IL McClelland (Eds.), Usability evaluation in industry (pp. 169-178) London: Taylor and Francis.
Kirakowski, J and Cierlik, B. (1998) Measuring the usability of web sites. In Proceedings of Human Factors and
Ergonomics Society 42nd Annual Meeting. Santa Monica, CA.
Kirakowski, J, and Corbett, M. (1993) SUMI: The software usability measurement inventory. British Journal of Educational Technology, 24(3), pp. 210-212.
Konradt, U, et al. (2003) Usability in online shops: scale construction, validation and the influence on the buyers' intention and decision. Behavior and Information Technology, 22(3), pp. 165-174.
LaLomia, MJ, and Sidowski, JB. (1990) Measurements of computer satisfaction, literacy, and aptitudes: A review. International Journal of Human-Computer Interaction, 2(3), pp. 231-253.
Lewis, JR. (1995) IBM computer usability satisfaction questionnaire: psychometric evaluation and instructions for use. International Journal of Human-Computer Interaction, 7(1), pp. 57-78.
Lewis, JR. (2002) Psychometric Evaluation of the PSSUQ Using Data from Five Years of Usability Studies.
Netemeyer, RG, et al. (2003) Scaling procedures: Issues and applications. Thousand Oaks, CA: Sage Publications, Inc.
Newman, A. (2003) IDC labels mobile device users. Retrieved February 28, 2004, from
http://www.infosyncworld.com/news/n/4384.html Nielsen, J. (1993) Usability Engineering. Cambridge, MA: Academic Press.
Nunnally, JC. (1978) Psychometric theory. New York: McGraw-Hill.
Rencher, AC. (2002) Methods of Multivariate Analysis (2nd
ed.) New York: Wiley Inter-science.
Ryu, YS and Smith-Jackson, TL. (2005) Usability Questionnaire Items for Mobile Products and Content
Validity. In Proceedings of HCI International 2005, Las Vegas.
Shackel, B. (1991) Usability - context, framework, design and evaluation. In B. Shackel and S. Richardson (Eds.), Human Factors for Informatics Usability (pp. 21-38) Cambridge: Cambridge University Press.
Appendix - Complete list of the questionnaire items of MPUQ
Factor Item No. Revised Question (structured to solicit "always-never" response) Source of Items
1 Is it easy to learn to operate this product? SUMI, PSSUQ, PUTQ, QUIS, QUEST,
Keinonen (1998), Kwahk (1999)
2 Is using this product sufficiently easy? SUMI, QUIS
3 Have the user needs regarding this product been sufficiently taken into consideration? SUMI, PUTQ
4 Is it relatively easy to move from one part of a task to another? SUMI, Klockar et al.(2003)
5 Can all operations be carried out in a systematically similar way? SUMI, Keinonen (1998), Kwahk (1999) 6 Are the operation of this product simple and uncomplicated? PSSUQ, Keinonen (1998), QUEST,
Kwahk (1999)
7 Does this product enable the quick, effective, and economical performance of tasks? PSSUQ, Keinonen (1998), Kwahk (1999)
8 Is it easy to access the information that you need from the product? PSSUQ, QUIS 9 Is the organization of information on the product screen clear? PSSUQ, QUIS
10 Does product have all the functions and capabilities you expect it to have? PSSUQ, Keinonen (1998) 11 Are the color coding and data display compatible with familiar conventions? PUTQ
12 Is it easy for you to remember how to perform tasks with this product? QUIS, Keinonen (1998), Kwahk (1999) 13 Is the interface with this product clear and understandable? PUTQ, QUIS, Keinonen (1998)
14 Are the characters on the screen easy to read? QUIS, Keinonen (1998), Lindholm et al. (2003)
15 Does interacting with this product require a lot of mental effort? Keinonen (1998), QUEST 16 Is it easy to assemble, install, and/or setup the product? QUIS, QUEST
17 Can you regulate, control, and operate the product easily? PUTQ, QUIS, Kwahk (1999) 18 Is it easy to navigate between hierarchical menus, pages, and screen? PUTQ, QUIS, Szuc (2002)
19 Are the input and text entry methods for this product easy and usable? PUTQ, Szuc (2002), Lindholm et al. (2003)
20 Is the backlighting feature for the keyboard and screen helpful? Szuc (2002), Lindholm et al. (2003)
21 Are the command names meaningful? PUTQ
22 Is discovering new features sufficiently easy? QUIS
Ease of Learning and Use (LEU)
23 Is the Web interface sufficiently similar to those of other products you have used? Szuc (2002) 24 Is the HELP information given by this product useful? SUMI, Kwahk (1999)
25 Is the presentation of system information sufficiently clear and understandable? SUMI, PSSUQ, QUIS, Keinonen (1998) 26 Are the documentation and manual for this product sufficiently informative? SUMI, PUTQ, QUIS
27 Are the messages aimed at prevent you from making mistakes adequate? SUMI, Kwahk (1999) 28 Are the error messages effective in assisting you to fix problems? PSSUQ, PUTQ, QUIS
29 Is it easy to take corrective actions once an error has been recognized? PSSUQ, QUIS, Kwahk (1999)
30 Is feedback on the completion of tasks clear? PUTQ, QUIS, Kwahk (1999)
31 Does the product give all the necessary information for you to use it in a proper manner? PUTQ, Kwahk (1999)
32 Is the bolding of commands or other signals helpful? QUIS
Helpfulness and Problem Solving Capabilities (HPSC)
33 Does the HELP function define aspects of the product adequately? QUIS
34 Is this product's size convenient for transportation and storage? QUEST, Kwahk (1999), Szuc (2002) Affective
Factor Item No. Revised Question (structured to solicit "always-never" response) Source of Items
36 Is this product attractive and pleasing? SUMI, Keinonen (1998), Kwahk (1999)
37 Do you feel comfortable and confident using this product? PSSUQ, Keinonen (1998), QUEST, Kwahk (1999)
38 Does the color of the product make it attractive? QUIS, QUEST, Kwahk (1999) 39 Does the brightness of the product make it attractive? QUIS, Kwahk (1999) 40 Are pictures on the screen of satisfactory quality and size? QUIS
41 Is the number of colors available adequate? QUIS
42 Are the components of the product are well-matched or harmonious? Kwahk (1999)
43 Do you feel excited when using this product? Jordan (2000)
44 Would you miss this product if you no longer had it? Jordan (2000)
45 Are you/would you be proud of this product? Jordan (2000)
46 Does carrying this product make you feel stylish? Klockar et al.(2003) Multimedia
Properties (AAMP)
47 Can you personalize ringer signals with this product? If so, is that feature useful and enjoyable for you?
48 Is the organization of the menus sufficiently logical? SUMI, PUTQ, Lindholm et al. (2003) 49 Is the design of the graphic symbols, icons and labels on the icons sufficiently relevant? PUTQ, Keinonen (1998)
50 Does the product provide index of commands? PUTQ
51 Does the product provide index of data? PUTQ
52 Are data items kept short? PUTQ
53 Are the letter codes for the menu selection designed carefully? PUTQ
54 Do the commands have distinctive meanings? PUTQ
55 Is the highlighting on the screen helpful? QUIS
Commands and Minimal Memory Load (CMML)
56 Are the HOME and MENU buttons sufficiently easy to locate for all operations? Szuc (2002) 57 Are the response time and information display fast enough? SUMI, QUIS
58 Has the product at some time stopped unexpectedly? SUMI
59 Is the amount of information displayed on the screen adequate? SUMI, PUTQ, QUIS
60 Is the way product works overall consistent? SUMI, PUTQ, Keinonen (1998)
61 Does the product allow the user to access applications and data with sufficiently few
keystrokes? SUMI, PUTQ, QUIS, Szuc (2002)
62 Is the data display sufficiently consistent? PUTQ, QUIS, Kwahk (1999)
63 Does the product support the operation of all the tasks in a way that you find useful? SUMI, PUTQ, Kwahk (1999)
64 Is the product reliable, dependable, and trustworthy? QUIS, Kwahk (1999), Jordan (2000) Control and
Efficiency (CE)
65 Are exchange and transmission of data between this product and other products (e.g.,
computer, PDA, and other mobile products) easy? SUMI, QUIS
66 Is it easy to correct mistakes such as typos? PUTQ, QUIS
67 Is it easy to use the phone book feature of this product?
68 Is it easy to send and receive short messages using this product?
69 Is it sufficiently easy to operate keys with one hand? Szuc (2002)
70 Is it easy to check missed calls? Klockar et al.(2003)
71 Is it easy to check the last call? Klockar et al.(2003)
Typical Task for Mobile Phone (TTMP)
Young Sam Ryu is an assistant professor of Industrial Engineering Program at Texas State University-San Marcos. His research area includes human computer interaction, usability engineering, and safety. He received Ph.D. from Human Factors Engineering Program of the Department of Industrial and Systems Engineering at Virginia Tech in 2005.
Tonya L. Smith-Jackson is an associate professor of Human Factors Engineering in the Industrial and Systems Engineering