VOLUME 41, ARTICLE 35, PAGES 1021
-
1046
PUBLISHED 15 OCTOBER 2019
http://www.demographic-research.org/Volumes/Vol41/35/ DOI: 10.4054/DemRes.2019.41.35
Research Article
Housework share and fertility preference in four
East Asian countries in 2006 and 2012
Man-Yee Kan
Ekaterina Hertog
Kamila Kolpashnikova
This publication is part of the Special Collection on “Domestic Division of Labour and Fertility Choice in East Asia,” organized by Guest Editors Ekaterina Hertog and Man-Yee Kan.
© 2019 Man-Yee Kan, Ekaterina Hertog & Kamila Kolpashnikova.
This open-access work is published under the terms of the Creative Commons Attribution 3.0 Germany (CC BY 3.0 DE), which permits use, reproduction, and distribution in any medium, provided the original author(s) and source are given credit.
1 Special issue overview 1022 2 Theoretical perspectives on the link between gender division of
labour at home and fertility over time
1023
3 Domestic work in East Asia and the link to fertility 1025
4 Hypotheses 1026
5 Methods 1026
5.1 Main variables 1027
5.1.1 Fertility preference 1027
5.1.2 Housework participation 1027
6 Analysis outline 1028
7 Results 1028
7.1 Descriptive findings 1028
7.1.1 Housework participation 1028
7.1.2 The actual and ideal number of children 1030
7.2 Multivariate analyses 1031
8 Discussion and conclusion 1040
9 Acknowledgments 1041
Housework share and fertility preference in four East Asian
countries in 2006 and 2012
Man-Yee Kan1 Ekaterina Hertog2
Kamila Kolpashnikova3
Abstract
BACKGROUND
Previous research suggested that husbands’ participation in housework is positively associated with fertility choices for both women and men. We tested this association by using data of four East Asian countries.
OBJECTIVE
This paper examines whether the positive association between gender-equal sharing of housework participation and fertility intention in China, Japan, South Korea, and Taiwan has strengthened between 2006 and 2012.
METHODS
We harmonize two datasets, the 2006 East Asian Social Survey and the 2012 International Social Survey Programme. We employ OLS and ordered logit models estimators to test the association between husband’s housework participation and the ideal number of children.
RESULTS
In both 2006 and 2012, husband’s participation in housework is associated with both own and partner’s fertility intentions in 2006 and 2012. The association between the domestic division of labour and fertility has not changed between 2006 and 2012. CONCLUSIONS
Corroborating the findings of our earlier paper the results suggest that a more gender-equal domestic division of labour in East Asia is associated with higher fertility
1 University of Oxford, United Kingdom. Email:[email protected]. 2 University of Oxford, United Kingdom.
intentions in this region. The gender revolution framework offers a plausible explanation for the East Asian fertility trends between 2006 and 2012. The findings suggest that there is a stall in the pace of the gender revolution.
CONTRIBUTION
This paper provides a summary of the trends highlighted by the contributors to this special issue. This is also the first paper to look at the evolution of domestic division of labour and fertility preferences in four East Asian countries over time.
1. Special issue overview
This special issue is comprised of five papers focused on family trends and domestic division of labour in four East Asian countries: China, Japan, South Korea, and Taiwan. In a comparative paper analysing the association between fertility and domestic work participation, Kan and Hertog (2017) find that in 2006, the domestic division of labour has been very unequal in all four countries. Men did barely any domestic work in these countries, and their fertility intentions were not associated much with their domestic work participation. The situation was very different for women; Kan and Hertog (2017) find that in East Asia, wives whose husbands participated more in housework were willing to have more children. Subsequent papers in the special issue focus on one country each and provide more detailed insights into men’s and women’s fertility intentions and the consequences associated with having more children in Japan, China, and South Korea.
in the current legal and normative environment in Japan. Taking a somewhat different tack, Mu and Xie (2016) look at the gendered consequences of having children in China. They find that having additional children translates into greater career confidence for men and into better subjective well-being for women.
To summarise, the special issue confirms the link between more gender-equal division of labour in East Asia and fertility using a variety of data sources. This link is consistent with the second stage of the gender revolution framework. This concluding paper of the special issue builds on this finding and analyses whether the dynamics of the association between fertility and domestic division of labour change over time. Previous research suggests that the link between housework participation and fertility did not remain static over time. Goldscheider et al. (2015) argue that in the early years of the gender revolution, women were satisfied with juggling paid and unpaid work because many women remained underemployed at least until their children started school and often until secondary school. Over time, however, as a society experiences gender revolution and women achieve greater equality in the labour market, the total burden of paid and unpaid work becomes stressful. As women’s participation in the labour market increases, it becomes harder for them to balance paid work with domestic responsibilities on their own, and this gives rise to a positive association between more gender-equal division of labour at home and fertility (e.g., Zhou 2017). Finally, Okun and Raz-Yurovich (2019) argue that in countries that achieve significant levels of men’s participation in housework, women’s greater desire to have more children may be partially offset by men, who experience role incongruity and are more ambiguous about having additional children.
This paper has two main goals: (a) to examine whether there is a positive association between domestic division of labour and fertility in East Asia in 2012, as well as in 2006 as recoded by Kan and Hertog (2017), and (b) to test if this association has changed over time in China, South Korea, Japan, and Taiwan in order to assess the progress of gender revolution in East Asia.
2. Theoretical perspectives on the link between gender division of
labour at home and fertility over time
of men’s involvement in domestic work. The first stage is an equilibrium in which women focus on home production and men specialise on paid work. In the second stage, women start participating in paid work and continue to take responsibility for home production. In this stage, working women reduce their fertility to manage their increased workload. Finally, in the third stage, men start contributing to home production and couples with more gender-equal division of labour at home are willing to have more children. Feyer et al. (2008) argue that in the first two stages, husbands’ participation in home production is so low that the variation between couples is not expected to make a difference for couples’ fertility preferences. They also argue that the association between men’s housework share and fertility manifests itself once a society reached the third stage, where husbands’ participation at home reaches a level high enough to reduce women’s disincentives to have additional children. Feyer et al.’s (2008) proposed stages of development in gender division of labour and fertility are similar to Goldscheider et al.’s (2015) gender revolution framework. In particular, the third (final) stage identified by Feyer et al. (2008) matches the second stage of the gender revolution framework proposed by Goldscheider et al. (2015).
While we agree with Feyer et al. (2008) that the association between domestic division of labour and fertility are likely to change over time, we consider that the association will first increase and then decrease over time. At the initial stage, there is an equilibrium between the gender division of labour and fertility, and therefore fertility level is high. At this stage, the traditional gender-specialised division of labour is the most common practice among couples. When societies progress to a second stage, women increase their labour force participation while still responsible for the major share of domestic work; they experience severe work–life conflicts, and fertility declines. However, at this stage, traditional men and traditional women lag behind their more gender-egalitarian counterparts in the domestic division of labour, so the variations among women and among men in domestic division of labour will increase. The association between domestic labour participation and fertility will, therefore, increase in this transitional period. At the final stage (described as the third stage in Feyer et al.’s framework and the second stage in Goldscheider et al.’s framework), we expect that men will increase their participation in domestic work and the gender division of labour in couples will reach equilibrium with fertility again eventually. At the final stage, traditional men and traditional women will catch up with their more egalitarian counterparts in the domestic division of labour, and therefore the variations among men and among women will decrease. Fertility will rise. The association between domestic work and fertility will also decrease or become insignificant when equilibrium is about to be reached or has been reached.
as this period is characterised by increasing work-family conflict for women, as more women join the labour market and men’s participation in domestic work remains low. That is, we expect that the East Asian countries are still at the transitional stage of the gender revolution.
Research into the recent time use trends in European and Anglophone countries, including the very low fertility ones, suggests that men’s participation in domestic work is associated with more children in the family (Sullivan, Billari, and Altintas 2014). This volume confirms that this is the case for four East Asian countries as well. This paper will analyse if the positive association between gender equality at home and fertility observed in 2006 in East Asia has grown stronger over time and will assess the stage of development of the gender revolution in the region.
3. Domestic work in East Asia and the link to fertility
intervention formed diverging patterns within the region (see Estevez-Abe and Naldini 2016 for a comparison of Japan and South Korea).
In addition, Suzuki (2013) argues that declining fertility in East Asia is the result of endemic gender inequality and the Confucian family ideals in East Asian societies. Similarly, McDonald (2009) suggests that gender inequality in East Asian societies exacerbates work–family conflict, and the lack of economic security among women results in the low fertility rates in the region. The link between fertility and gender equality at home and how the association between the two changes over time remains underexplored outside this special issue.
4. Hypotheses
Based on the theoretical ideas of the gender revolution framework outlined above, we propose to test the following hypotheses:
Hypothesis 1: Husbands and wives in couples where men contribute more to housework show higher fertility intentions, and this association is observed in 2006 and 2012.
Hypothesis 2: We expect to find that the positive association between more equal gender division of labour at home and fertility intentions has become stronger in 2012 compared to 2006.
Support for these hypotheses would confirm that the gender revolution is well underway in the East Asian context. It would also suggest that, as the second stage of the gender revolution intensifies, the low fertility East Asian countries should reap the benefits of the positive effects of gender egalitarianism on fertility intentions, and we should observe a reversal in fertility trends.
5. Methods
analyse the housework participation for both spouses. Housework participation within married couples is notably different from single and divorced women and men (Kolpashnikova, Kan, and Shirakawa, 2019a; Kolpashnikova, Kan, and Shirakawa, 2019b). We use the original survey weights for the datasets.
5.1 Main variables
5.1.1 Fertility preference
In ISSP and EASS, there is no direct measure of fertility preference. We instead use the respondents’ general perception of the ideal number of children to measure fertility intentions and preferences, replicating the analysis in Kan and Hertog (2017).
5.1.2 Housework participation
In the original paper (Kan and Hertog 2017), we used the frequency of undertaking three household chores as the measure for housework participation: meal preparation, doing the laundry, and domestic cleaning. We recoded response options into four categories and allocated scores between 1 (less than once a week) to 4 (every day). We then constructed a scale of housework participation (ranging from 3 to 12), measured by the sum of the frequency in undertaking the three household chores. In the ISSP data, housework participation is represented by the self-reported measures of own and spousal housework hours per week.
To make these two measures from EASS and ISPP comparable, we transformed them into categorical measures of housework participation. We define three levels of housework participation for men and for women respectively, since housework participation varies heavily by gender. Category 1 of housework participation represents the lowest 33% of housework participation within a gender group, category 2 represents the average participation in housework (34–66th percentiles), and category 3
represents the upper 33% of housework participation. Because the original EASS and ISSP variables could not always be clearly cut by 33.3% for each category, we took the closest percentile to match.
or lower, (2) junior high to secondary education, and (3) postsecondary. In the ISSP data for Japan, there were no observations within the age range and among married individuals who had only primary education or lower; therefore, we recoded both EASS and ISSP educational attainment variable to include two categories: (1) secondary or lower and (2) postsecondary.
6. Analysis outline
To test hypotheses, we will test the association of housework participation with the ideal number of children using OLS estimation, controlling for the current number of children and adding country and period interactions in subsequent models. We regress women’s and men’s ideal number of children in separate models. We will test the robustness of our findings in OLS models with ordered logit models. The robustness checks on OLS models were also run by using negative binomial regressions, which are more common when the dependent variables represent count numbers. However, because the results are indistinguishable from those reported by OLS and ordered logit regressions, we opted to keep the original models to make them comparable with the previous paper.
7. Results
7.1 Descriptive findings
7.1.1 Housework participation
descriptive statistics confirm that Chinese and Taiwanese couples enjoy a more equal division of housework than Japanese and Korean couples.
Table 1: Housework and spouse housework frequency for men and women by terciles, 2006
Men 2006 Spouses of men 2006
Women 2006 Spouses of women 2006
Lower tercile 3.000 7.229 7.632 3.000
(0.000) (2.036) (1.778) (0.000)
2nd tercile 5.709 10.495 10.552 4.895
(1.331) (0.501) (0.498) (0.801)
Upper tercile 10.135 12.000 12.000 9.128
(1.228) (0.000) (0.000) (1.846)
Total 5.748 10.014 10.607 5.228
(2.746) (2.345) (1.862) (2.699)
Total sample N 1439 1428 1737 1726
China 6.545 9.755 10.787 6.055
(2.983) (2.551) (1.773) (3.001)
N 653 652 820 814
Japan 4.186 10.696 10.968 3.948
(1.766) (1.555) (1.171) (1.790)
N 204 204 253 252
Korea 5.299 10.662 10.883 4.444
(2.436) (2.041) (1.673) (2.146)
N 271 269 360 358
Taiwan 5.489 9.538 9.493 4.997
(2.421) (2.362) (2.319) (2.296)
N 311 303 304 302
Table 2: Housework and spouse housework hours for men and women by terciles, 2012
Men 2012 Spouses of men 2012
Women 2012 Spouses of women 2012
Lower tercile 0.792 6.256 6.238 0.834
(0.858) (2.947) (2.779) (0.803)
2nd tercile 6.345 17.754 17.256 5.300
(2.146) (3.680) (3.464) (1.581)
Upper tercile 18.558 37.724 36.534 15.990
(8.942) (12.222) (12.270) (10.485)
Total 7.013 18.959 18.014 6.227
(7.506) (13.720) (13.349) (7.874)
Total sample N 1587 1476 1624 1202
China 7.716 18.932 17.473 6.807
(7.594) (12.558) (12.240) (6.918)
N 1070 987 1085 727
Japan 4.176 26.000 24.808 3.343
(5.023) (18.808) (14.923) (3.835)
N 119 117 151 143
Korea 7.728 21.933 21.372 7.087
(9.382) (16.499) (16.213) (11.932)
N 125 119 172 150
Taiwan 5.165 14.407 13.306 5.467
(6.452) (12.101) (12.658) (9.032)
Additionally, Tables 1 and 2 summarize housework participation by terciles. All men in the lower tercile report doing housework once a week or less. That means that at least 33% of all men barely ever participate in housework. Table 2 also shows that men in the lowest tercile contribute less than an hour on an average week. Conversely, Table 1 shows that in the uppermost tercile all women report doing housework every day. That is, at least 33% of all married women participate in housework daily. Table 2 shows that in this tercile, women spend about 37 hours every week – a number comparable to a full working week.
In all four countries, women do the lion’s share of housework. The most gendered pattern of domestic labour is observed in Japan, where women report doing almost all housework and men report doing very little. These differences between countries echo the results in Kan and Hertog (2017), and the reported differences between East Asian countries in 2006 persisted through 2012.
7.1.2 The actual and ideal number of children
Table 3 shows that there is a gap between the mean of the actual number of children and that of the ideal number of children. Same as the results for the EASS 2006, the gap in the ISSP 2012 data is the highest in Japan and Korea (~0.9). On average, the ideal number of children is higher for men than women. Overall, the number of children that men and women want decreased significantly from 2006 to 2012 for the total sample (t = 4.323, p < .001 for women, t = 4.119, p < .001 for men), and the actual number of children decreased significantly as well (t = 15.017, p < .001 for women, t = 18.344, p < .001 for men).
Table 3: Men’s and women’s actual and ideal number of children by country
China (sd) Japan (sd) South Korea (sd) Taiwan (sd)
Men
Number of children (2006) 1.57 (0.72) 1.95 (0.74) 1.91 (0.65) 2.05 (0.75) (2012) 0.99 (0.73) 1.55 (1.04) 1.44 (0.86) 1.56 (1.03) Ideal number of children (2006) 1.83 (0.63) 2.59 (0.63) 2.62 (0.90) 2.31 (0.74) (2012) 1.79 (0.42) 2.53 (0.61) 2.55 (0.75) 2.37 (0.74) Women
Number of children (2006) 1.62 (0.79) 1.99 (0.73) 1.93 (0.58) 2.19 (0.86) (2012) 1.10 (0.75) 1.55 (1.02) 1.61 (0.91) 1.84 (1.09) Ideal number of children (2006) 1.79 (0.54) 2.66 (0.66) 2.59 (0.88) 2.34 (0.72) (2012) 1.80 (0.41) 2.64 (0.70) 2.43 (0.88) 2.24 (0.62)
Data Source: East Asian Social Surveys 2006 and International Social Survey Programme 2012.
reflect the de facto one-child policy, which was still in effect between 2006 and 2012. Taiwanese women have the lowest gap between the ideal and the real number of children, but they also have the highest actual number of children among women in the four countries. Thus, Taiwanese women’s low desire for more children may simply reflect their success in fulfilling their fertility desires.
7.2 Multivariate analyses
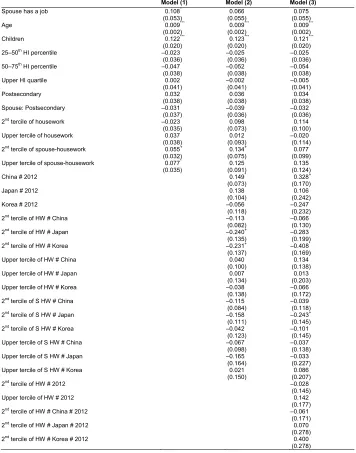
Tables 4 and 6 present OLS regressions and Tables 5 and 7 present ordered logit estimates that use the ideal number of children for men and women as the dependent variable. The reference category for housework participation variables is the lowest tercile. The models control for household income, age, both partners’ employment statuses, and educational level. In all models, we used Taiwan as the reference country. Our conclusions remain the same if another country is used as a reference category.
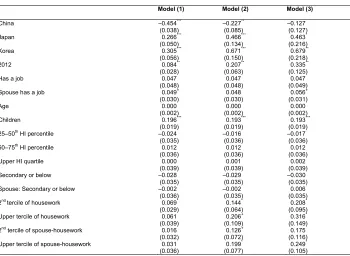
Table 4: OLS regression models of the ideal number of children, men
Model (1) Model (2) Model (3)
China –0.454*** –0.227** –0.127
(0.038) (0.085) (0.127)
Japan 0.266*** 0.466*** 0.463*
(0.050) (0.134) (0.216)
Korea 0.305*** 0.671*** 0.679**
(0.056) (0.150) (0.218)
2012 0.084** 0.207** 0.335**
(0.028) (0.063) (0.125)
Has a job 0.047 0.047 0.047
(0.048) (0.048) (0.049)
Spouse has a job 0.049+ 0.048 0.056+
(0.030) (0.030) (0.031)
Age 0.000 0.000 0.000
(0.002) (0.002) (0.002)
Children 0.196*** 0.193*** 0.193***
(0.019) (0.019) (0.019)
25–50th HI percentile –0.024 –0.016 –0.017
(0.035) (0.036) (0.036)
50–75th HI percentile 0.012 0.012 0.012
(0.036) (0.036) (0.036)
Upper HI quartile 0.000 0.001 0.002
(0.039) (0.039) (0.039)
Secondary or below –0.028 –0.029 –0.030
(0.035) (0.035) (0.035)
Spouse: Secondary or below –0.002 –0.002 0.006
(0.036) (0.035) (0.035)
2ndtercile of housework 0.069* 0.144* 0.208*
(0.029) (0.064) (0.095)
Upper tercile of housework 0.061 0.206+ 0.316*
(0.039) (0.109) (0.149)
2nd tercile of spouse-housework 0.016 0.126+ 0.175
(0.032) (0.072) (0.116)
Upper tercile of spouse-housework 0.031 0.199* 0.249*
Table 4: (Continue)
Model (1) Model (2) Model (3)
China # 2012 –0.130+ –0.305*
(0.069) (0.151)
Japan # 2012 –0.211* –0.184
(0.099) (0.256)
Korea # 2012 –0.180+ –0.195
(0.109) (0.288)
2nd tercile of HW # China –0.112 –0.164
(0.073) (0.117)
2nd tercile of HW # Japan –0.045 –0.092
(0.105) (0.149)
2nd tercile of HW # Korea –0.077 –0.137
(0.119) (0.171)
Upper tercile of HW # China –0.166 –0.207
(0.117) (0.171)
Upper tercile of HW # Japan 0.005 –0.187
(0.221) (0.421)
Upper tercile of HW # Korea –0.304+ –0.494*
(0.174) (0.244)
2nd tercile of S HW # China –0.132+ –0.256+
(0.079) (0.135)
2nd tercile of S HW # Japan –0.072 0.007
(0.134) (0.230)
2nd tercile of S HW # Korea –0.261+ –0.258
(0.143) (0.212)
Upper tercile of S HW # China –0.176* –0.290*
(0.086) (0.127)
Upper tercile of S HW # Japan –0.192 –0.190
(0.138) (0.231)
Upper tercile of S HW # Korea –0.347* –0.279
(0.144) (0.203)
2nd tercile of HW # 2012 –0.122
(0.129)
Upper tercile of HW # 2012 –0.249
(0.230)
2nd tercile of HW # China # 2012 0.100
(0.151)
2nd tercile of HW # Japan # 2012 0.094
(0.207)
2nd tercile of HW # Korea # 2012 0.149
(0.245)
Upper tercile of HW # China # 2012 0.107
(0.250)
Upper tercile of HW # Japan # 2012 0.447
(0.482)
Upper tercile of HW # Korea # 2012 0.456
(0.356)
2nd tercile of S HW # 2012 –0.059
(0.147)
Upper tercile of S HW # 2012 –0.070
(0.163)
2nd tercile of S HW # China # 2012 0.193
(0.167)
2nd tercile of S HW # Japan # 2012 –0.256
(0.278)
2nd tercile of S HW # Korea # 2012 –0.051
(0.291)
Upper tercile of S HW # China # 2012 0.213
(0.182)
Upper tercile of S HW # Japan # 2012 –0.019
(0.294)
Upper tercile of S HW # Korea # 2012 –0.209
Table 4: (Continue)
Model (1) Model (2) Model (3)
Constant 1.807*** 1.626*** 1.545***
(0.103) (0.120) (0.142)
Observations 2515 2515 2515
R2 0.300 0.307 0.312
AdjustedR2 0.295 0.298 0.298
HW – Housework, S HW – Spouse: Housework. Standard errors in parentheses.+p < 0.10,*p < 0.05,**p < 0.01,***p < 0.001.
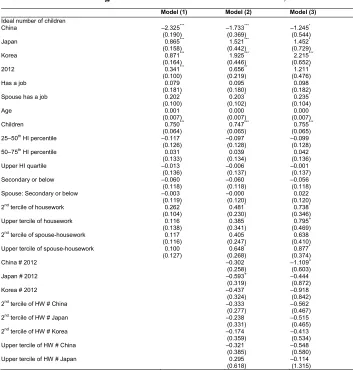
Table 5: Ordered logit models of the ideal number of children, men
Model (1) Model (2) Model (3)
Ideal number of children
China –2.325*** –1.733*** –1.245*
(0.190) (0.369) (0.544)
Japan 0.865*** 1.521*** 1.452*
(0.158) (0.442) (0.729)
Korea 0.871*** 1.925*** 2.215***
(0.164) (0.446) (0.652)
2012 0.341*** 0.656** 1.211*
(0.100) (0.219) (0.476)
Has a job 0.079 0.095 0.098
(0.181) (0.180) (0.182)
Spouse has a job 0.202* 0.203* 0.235*
(0.100) (0.102) (0.104)
Age 0.001 0.000 0.000
(0.007) (0.007) (0.007)
Children 0.750*** 0.747*** 0.755***
(0.064) (0.065) (0.065)
25–50th HI percentile –0.117 –0.097 –0.099
(0.126) (0.128) (0.128)
50–75th HI percentile 0.031 0.039 0.042
(0.133) (0.134) (0.136)
Upper HI quartile –0.013 –0.006 –0.001
(0.136) (0.137) (0.137)
Secondary or below –0.060 –0.060 –0.056
(0.118) (0.118) (0.118)
Spouse: Secondary or below –0.003 –0.000 0.022
(0.119) (0.120) (0.120)
2nd tercile of housework 0.262* 0.481* 0.738*
(0.104) (0.230) (0.346)
Upper tercile of housework 0.116 0.385 0.795+
(0.138) (0.341) (0.469)
2nd tercile of spouse-housework 0.117 0.405 0.638
(0.116) (0.247) (0.410)
Upper tercile of spouse-housework 0.100 0.648* 0.877*
(0.127) (0.268) (0.374)
China # 2012 –0.302 –1.109+
(0.258) (0.603)
Japan # 2012 –0.593+ –0.444
(0.319) (0.872)
Korea # 2012 –0.437 –0.918
(0.324) (0.842)
2nd tercile of HW # China –0.333 –0.562
(0.277) (0.467)
2nd tercile of HW # Japan –0.238 –0.515
(0.331) (0.465)
2nd tercile of HW # Korea –0.174 –0.413
(0.359) (0.534)
Upper tercile of HW # China –0.321 –0.548
(0.385) (0.580)
Upper tercile of HW # Japan 0.295 –0.114
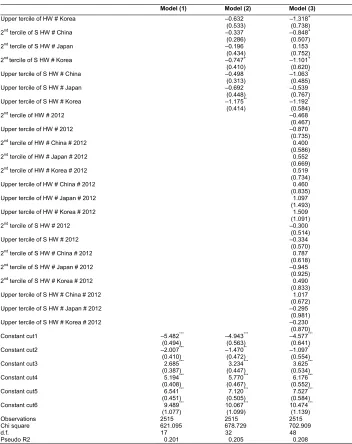
Table 5: (Continue)
Model (1) Model (2) Model (3)
Upper tercile of HW # Korea –0.632 –1.318+
(0.533) (0.738)
2nd tercile of S HW # China –0.337 –0.848+
(0.286) (0.507)
2nd tercile of S HW # Japan –0.196 0.153
(0.434) (0.752)
2ndtercile of S HW # Korea –0.747+ –1.101+
(0.410) (0.620)
Upper tercile of S HW # China –0.498 –1.063*
(0.313) (0.485)
Upper tercile of S HW # Japan –0.692 –0.539
(0.448) (0.767)
Upper tercile of S HW # Korea –1.175** –1.192*
(0.414) (0.584)
2nd tercile of HW # 2012 –0.468
(0.467)
Upper tercile of HW # 2012 –0.870
(0.735)
2nd tercile of HW # China # 2012 0.400
(0.586)
2nd tercile of HW # Japan # 2012 0.552
(0.669)
2nd tercile of HW # Korea # 2012 0.519
(0.734)
Upper tercile of HW # China # 2012 0.460
(0.835)
Upper tercile of HW # Japan # 2012 1.097
(1.493)
Upper tercile of HW # Korea # 2012 1.509
(1.091)
2nd tercile of S HW # 2012 –0.300
(0.514)
Upper tercile of S HW # 2012 –0.334
(0.570)
2nd tercile of S HW # China # 2012 0.787
(0.618)
2nd tercile of S HW # Japan # 2012 –0.945
(0.925)
2nd tercile of S HW # Korea # 2012 0.490
(0.833)
Upper tercile of S HW # China # 2012 1.017
(0.672)
Upper tercile of S HW # Japan # 2012 –0.295
(0.981)
Upper tercile of S HW # Korea # 2012 –0.230
(0.870)
Constant cut1 –5.482*** –4.943*** –4.577***
(0.494) (0.563) (0.641)
Constant cut2 –2.007*** –1.470** –1.097*
(0.410) (0.472) (0.554)
Constant cut3 2.685*** 3.234*** 3.625***
(0.387) (0.447) (0.534)
Constant cut4 5.194*** 5.770*** 6.176***
(0.408) (0.467) (0.552)
Constant cut5 6.541*** 7.120*** 7.527***
(0.451) (0.505) (0.584)
Constant cut6 9.489*** 10.067*** 10.474***
(1.077) (1.099) (1.139)
Observations 2515 2515 2515
Chi square 621.095 678.729 702.909
d.f. 17 32 48
Pseudo R2 0.201 0.205 0.208
After controlling for the current number of children, age, household income, the employment statuses of both partners, and other control factors, we find that men and women in Japan and Korea want more children than couples in Taiwan. Conversely, Chinese men and women prefer fewer children than their Taiwanese counterparts. It is important to remember that the one-child policy was not yet relaxed in 2012 in China, which is reflected in the present results.
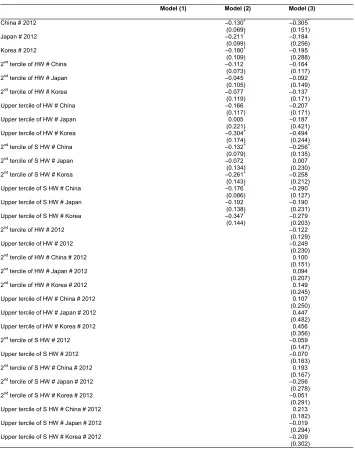
Our main theoretical interest is in the association between husbands’ housework participation and fertility intentions. First, we find support for Hypothesis 1. In the combined EASS and ISSP data sample, we find that men’s involvement in housework is positively associated with fertility intentions. Model 1 in Table 4 shows that men who get more involved in housework (second tercile over the lower tercile) have on average a higher ideal number of children than men in the lower tercile of housework participation. The same results are evident in the ordered logit models (see Table 5). When interactions with countries are added in Model 2, we find that higher participation levels in housework among men, both in the second and upper terciles, is significantly associated with higher fertility intentions. There is only one exception: the upper tercile of Korean men. For them, being in the upper tercile is negatively associated with fertility intentions, and the association is on the statistically significant level (see Model 2 in Table 4). This suggests that men’s participation in housework is significantly associated with increased fertility rates in all countries of East Asia, except among higher housework performers in Korea.4
Table 6: OLS regression models of the ideal number of children, women
Model (1) Model (2) Model (3)
China –0.432*** –0.414*** –0.514***
(0.041) (0.090) (0.120)
Japan 0.365*** 0.472*** 0.490**
(0.052) (0.128) (0.186)
Korea 0.277*** 0.404** 0.484***
(0.055) (0.125) (0.147)
2012 0.040 –0.051 –0.117
(0.029) (0.066) (0.147)
Has a job 0.058+ 0.066* 0.061+
(0.032) (0.033) (0.033)
4 In Tables 4 and 5, we can see that the upper tercile of housework participation is positive but marginally
Table 6: (Continue)
Model (1) Model (2) Model (3)
Spouse has a job 0.108* 0.066 0.075
(0.053) (0.055) (0.055)
Age 0.009*** 0.009*** 0.009***
(0.002) (0.002) (0.002)
Children 0.122*** 0.123*** 0.121***
(0.020) (0.020) (0.020)
25–50th HI percentile –0.023 –0.025 –0.025
(0.036) (0.036) (0.036)
50–75th HI percentile –0.047 –0.052 –0.054
(0.038) (0.038) (0.038)
Upper HI quartile 0.002 –0.002 –0.005
(0.041) (0.041) (0.041)
Postsecondary 0.032 0.036 0.034
(0.038) (0.038) (0.038)
Spouse: Postsecondary –0.031 –0.039 –0.032
(0.037) (0.036) (0.036)
2nd tercile of housework –0.023 0.098 0.114
(0.035) (0.073) (0.100)
Upper tercile of housework 0.037 0.012 –0.020
(0.038) (0.093) (0.114)
2nd tercile of spouse-housework 0.055+ 0.134+ 0.077
(0.032) (0.075) (0.099)
Upper tercile of spouse-housework 0.077* 0.125 0.135
(0.035) (0.091) (0.124)
China # 2012 0.149* 0.328+
(0.073) (0.170)
Japan # 2012 0.138 0.106
(0.104) (0.242)
Korea # 2012 –0.056 –0.247
(0.118) (0.232)
2nd tercile of HW # China –0.113 –0.066
(0.082) (0.130)
2nd tercile of HW # Japan –0.240+ –0.283
(0.135) (0.199)
2nd tercile of HW # Korea –0.231+ –0.408*
(0.137) (0.169)
Upper tercile of HW # China 0.040 0.134
(0.100) (0.138)
Upper tercile of HW # Japan 0.007 0.013
(0.134) (0.203)
Upper tercile of HW # Korea –0.038 –0.066
(0.138) (0.172)
2nd tercile of S HW # China –0.115 –0.039
(0.084) (0.118)
2nd tercile of S HW # Japan –0.158 –0.243+
(0.111) (0.145)
2nd tercile of S HW # Korea –0.042 –0.101
(0.123) (0.145)
Upper tercile of S HW # China –0.067 –0.037
(0.098) (0.138)
Upper tercile of S HW # Japan –0.165 –0.033
(0.164) (0.227)
Upper tercile of S HW # Korea 0.021 0.086
(0.150) (0.207)
2nd tercile of HW # 2012 –0.028
(0.145)
Upper tercile of HW # 2012 0.142
(0.177)
2nd tercile of HW # China # 2012 –0.061
(0.171)
2nd tercile of HW # Japan # 2012 0.070
(0.278)
2nd tercile of HW # Korea # 2012 0.400
Table 6: (Continue)
Model (1) Model (2) Model (3)
Upper tercile of HW # China # 2012 –0.244
(0.198)
Upper tercile of HW # Japan # 2012 –0.090
(0.274)
Upper tercile of HW # Korea # 2012 –0.056
(0.284)
2nd tercile of S HW # 2012 0.146
(0.152)
Upper tercile of S HW # 2012 –0.054
(0.168)
2nd tercile of S HW # China # 2012 –0.183
(0.171)
2ndtercile of S HW # Japan # 2012 0.151
(0.224)
2nd tercile of S HW # Korea # 2012 0.247
(0.271)
Upper tercile of S HW # China # 2012 –0.032
(0.184)
Upper tercile of S HW # Japan # 2012 –0.268
(0.313)
Upper tercile of S HW # Korea # 2012 –0.038
(0.291)
Constant 1.540*** 1.551*** 1.579***
(0.107) (0.125) (0.136)
Observations 2539 2539 2539
R2 0.266 0.272 0.280
AdjustedR2 0.261 0.263 0.266
HW – Housework, S HW – Spouse: Housework. Standard errors in parentheses.+p < 0.10,*p < 0.05,**p < 0.01,***p < 0.001.
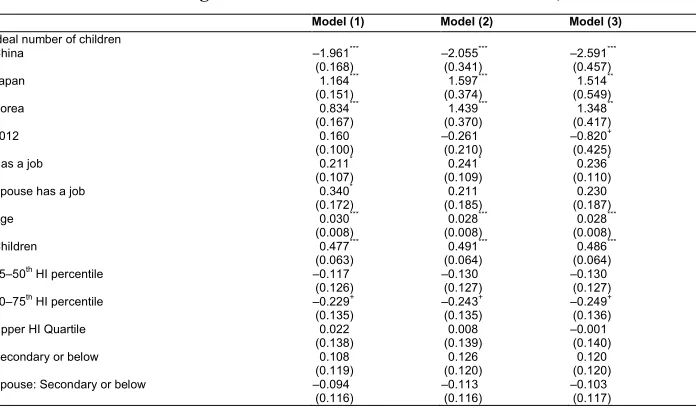
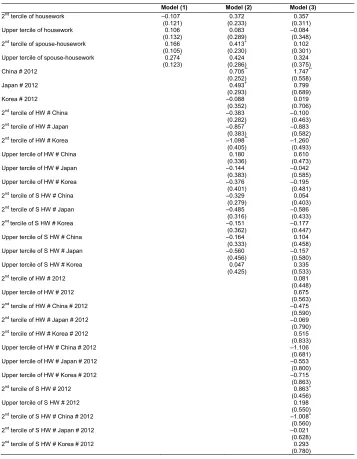
Table 7: Ordered logit models of the ideal number of children, women
Model (1) Model (2) Model (3)
Ideal number of children
China –1.961*** –2.055*** –2.591***
(0.168) (0.341) (0.457)
Japan 1.164*** 1.597*** 1.514**
(0.151) (0.374) (0.549)
Korea 0.834*** 1.439*** 1.348**
(0.167) (0.370) (0.417)
2012 0.160 –0.261 –0.820+
(0.100) (0.210) (0.425)
Has a job 0.211* 0.241* 0.236*
(0.107) (0.109) (0.110)
Spouse has a job 0.340* 0.211 0.230
(0.172) (0.185) (0.187)
Age 0.030*** 0.028*** 0.028***
(0.008) (0.008) (0.008)
Children 0.477*** 0.491*** 0.486***
(0.063) (0.064) (0.064)
25–50th HI percentile –0.117 –0.130 –0.130
(0.126) (0.127) (0.127)
50–75th HI percentile –0.229+ –0.243+ –0.249+
(0.135) (0.135) (0.136)
Upper HI Quartile 0.022 0.008 –0.001
(0.138) (0.139) (0.140)
Secondary or below 0.108 0.126 0.120
(0.119) (0.120) (0.120)
Spouse: Secondary or below –0.094 –0.113 –0.103
Table 7: (Continue)
Model (1) Model (2) Model (3)
2nd tercile of housework –0.107 0.372 0.357
(0.121) (0.233) (0.311)
Upper tercile of housework 0.106 0.083 –0.084
(0.132) (0.289) (0.348)
2nd tercile of spouse-housework 0.166 0.413+ 0.102
(0.105) (0.230) (0.301)
Upper tercile of spouse-housework 0.274* 0.424 0.324
(0.123) (0.286) (0.375)
China # 2012 0.705** 1.747**
(0.252) (0.558)
Japan # 2012 0.493+ 0.799
(0.293) (0.689)
Korea # 2012 –0.088 0.019
(0.352) (0.706)
2nd tercile of HW # China –0.383 –0.100
(0.282) (0.463)
2nd tercile of HW # Japan –0.857* –0.883
(0.383) (0.582)
2nd tercile of HW # Korea –1.098** –1.260*
(0.405) (0.493)
Upper tercile of HW # China 0.180 0.610
(0.336) (0.473)
Upper tercile of HW # Japan –0.144 –0.042
(0.383) (0.585)
Upper tercile of HW # Korea –0.376 –0.195
(0.401) (0.481)
2nd tercile of S HW # China –0.329 0.054
(0.279) (0.403)
2nd tercile of S HW # Japan –0.485 –0.586
(0.316) (0.433)
2ndtercile of S HW # Korea –0.151 –0.177
(0.362) (0.447)
Upper tercile of S HW # China –0.164 0.104
(0.333) (0.458)
Upper tercile of S HW # Japan –0.560 –0.157
(0.456) (0.580)
Upper tercile of S HW # Korea 0.047 0.335
(0.425) (0.533)
2nd tercile of HW # 2012 0.081
(0.448)
Upper tercile of HW # 2012 0.675
(0.563)
2nd tercile of HW # China # 2012 –0.475
(0.590)
2nd tercile of HW # Japan # 2012 –0.069
(0.790)
2nd tercile of HW # Korea # 2012 0.515
(0.833)
Upper tercile of HW # China # 2012 –1.106
(0.681)
Upper tercile of HW # Japan # 2012 –0.553
(0.800)
Upper tercile of HW # Korea # 2012 –0.715
(0.863)
2nd tercile of S HW # 2012 0.863+
(0.456)
Upper tercile of S HW # 2012 0.198
(0.550)
2nd tercile of S HW # China # 2012 –1.008+
(0.560)
2nd tercile of S HW # Japan # 2012 –0.021
(0.628)
2nd tercile of S HW # Korea # 2012 0.293
Table 7: (Continue)
Model (1) Model (2) Model (3)
Upper tercile of S HW # China # 2012 –0.557
(0.638)
Upper tercile of S HW # Japan # 2012 –0.939
(0.914)
Upper tercile of S HW # Korea # 2012 –0.438
(0.877)
Constant cut1 –4.720*** –4.761*** –5.019***
(0.520) (0.581) (0.601)
Constant cut2 –0.815* –0.848+ –1.098*
(0.406) (0.456) (0.484)
Constant cut3 3.576*** 3.571*** 3.340***
(0.403) (0.448) (0.473)
Constant cut4 5.624*** 5.646*** 5.437***
(0.410) (0.459) (0.482)
Constant cut5 7.622*** 7.653*** 7.449***
(0.474) (0.518) (0.529)
Constant cut6 9.272*** 9.303*** 9.101***
(0.719) (0.751) (0.746)
Observations 2539 2539 2539
Chi square 553.732 584.948 612.052
d.f. 17 32 48
Pseudo R2 0.169 0.174 0.179
HW – Housework, S HW – Spouse: Housework. Standard errors in parentheses.+p < 0.10,*p < 0.05,**p < 0.01,***p < 0.001.
Hypotheses 1 is supported for women as well as for men. When husbands are more involved in housework, women are more likely to have a higher ideal number of children compared to women whose husbands are not involved much in housework (the lowest tercile). The previous research (Kan and Hertog 2017) came to the same conclusion, and it is in line with the expectation of the gender revolution framework that husbands’ domestic involvement improves fertility intentions. We also find that this assertion applies to women in all East Asian countries (the interactions between countries and spousal housework participation were not on significant level – see Model 2 in Table 6).
Model 3 in Tables 4 and 5 tests if there are changes in the associations between interactions of housework and country categories for the two periods. All interactions for the recent time period are not on significant level, which suggests that the associations revealed in 2006 persisted, rather than strengthened, in 2012 and our Hypotheses 2 is not supported. However, the net effect of the year remains significant in all models, but only among men. The ideal number of children among men, despite what was suggested by the descriptive statistics, has increased over time when we control for all other variables, especially for the actual number of children. This means that given the actual number of children, men in 2012 are more likely to want more children than they were in 2006.
finding implies that the gender revolution in the four East Asian countries has been stalled rather than progressing.
8. Discussion and conclusion
This paper offers fresh evidence that the gender revolution in East Asia, manifested in the association between housework participation and fertility, is stalled. Husbands who participate more in housework prefer to have more children (with the exception of South Korea). It is conceivable that even a small increase in domestic work participation leads men to appreciate their families more and wish to have more children. Also overall, women’s ideal number of children is higher when their husbands participate in housework more. Therefore, men’s more egalitarian behaviours with regard to domestic labour contribute not only to their own fertility intentions but also positively influences their partners’ intentions to have more children. There is no evidence that the association has strengthened between 2006 and 2012. So at least during this period, the gender revolution in East Asia has not been gathering momentum. As noted in previous research, this does not bode well for future fertility trends in East Asia.
Furthermore, housework is shared extremely unequally in all the four East Asian countries under investigation in 2006 and 2012 remaining largely women's job. The findings are consistent with earlier studies on the domestic division of labour in East Asia (e.g., Kan and He 2018; Kan and Hertog 2017). More recently, time-use research on East Asia has shown that there has been a continuous convergence in gender division of labour at home in Taiwan (Kolpashnikova 2019c) and Japan (Hertog and Kan 2019) in the last two decades, but the pace of this convergence has been extremely slow. As found in Kan and Hertog (2017), there are considerable differences across countries within the region. Japanese women’s participation in housework exceeds that of women in other four East Asian countries, whereas Japanese men still spend the least amount of time on housework compared to men in other countries. China and Taiwan have somewhat more equal gender division of labour at home than Japan and South Korea, and in Taiwan, we observe the smallest gap between the actual and ideal number of children in all the four countries in both 2006 and 2012. Chinese fertility trends reflect the one-child policy, thus men and women there have and want fewer children than in Taiwan, Japan, and South Korea.
Programme becomes available, would be necessary to examine the progress of the gender revolution.
Another limitation is that the relatively small sample size for each of the four East Asian countries in our data does not allow us to test whether there is a significant change in the association between housework and fertility over time in each country. Future research may employ survey data with a large sample size in each of the countries and test further the change in the association between housework and fertility preference over time.
One more crucial avenue for future research is to analyse the regional trends in domestic division of labour over time using more explicitly comparable data in a way similar to what has been done for European and Anglophone data (e.g., Kan, Sullivan, and Gershuny 2011; Sullivan, Gershuny, and Robinson 2018). These trends are likely to offer more precise insights into the trajectory of the gender revolution in East Asia and, by extension, bring new insights into how fertility rates in the region will perform in the future.
9. Acknowledgement
References
Chen, Y.C.C. and Li, J.C.A. (2014). Family change in East Asia. In: Treas, J., Scott, J.L., and Richards, M. (eds.). The Wiley-Blackwell companion to the sociology of families. Chichester: Wiley-Blackwell: 61–82. doi:10.1002–/97811183740 85.ch4.
Estevez-Abe, M. and Naldini, M. (2016). Politics of defamilialization: A comparison of Italy, Japan, Korea and Spain. Journal of European Social Policy 26(4): 327– 343.doi:10.1177/0958928716657276.
Feyrer, J., Sacerdote, B., and Stern, A.D. (2008). Will the stork return to Europe and Japan? Understanding fertility within developed nations. Journal of Economic Perspectives22(3): 3–22.doi:10.1257/jep.22.3.3.
Frejka, T., Jones, G.W., and Sardon, J.P. (2010). East Asian childbearing patterns and policy developments. Population and Development Review 36(3): 579–606. doi:10.1111/j.1728-4457.2010.00347.x.
Goldscheider, F., Bernhardt, E., and Lappegård, T. (2015). The gender revolution: A framework for understanding changing family and demographic behavior.
Population and Development Review 41(2): 207–239. doi:10.1111/j.1728-4457.2015.00045.x.
Goldscheider, F., Bernhardt, E., & Branden, M. (2013). Domestic gender equality and childbearing in Sweden. Demographic Research29(40): 1097–1126. doi:10.40 54/DemRes.2013.29.40.
Hare, D. (2016). What accounts for the decline in labor force participation among married women in urban China, 1991–2011? China Economic Review 38: 251– 266.doi:10.1111/j.1728-4457.2015.00045.x.
Hertog, E. and Kan, M. Y. (2019).Education and gendered division of domestic labor over time in contemporary Japan. Paper presented at the Population Association of America, Austin, Texas, April 10–13, 2019.
International Labour Organisation (various years) ILOSTAT database. Geneva: International Labour Organisation.https://ilostat.ilo.org/.
Kan, M.-Y. and He, G. (2018). Resource bargaining and gender display in housework and care work in modern China. Chinese Sociological Review 50(2): 188–230. doi:10.1080/21620555.2018.1430506.
Kan, M.-Y., Sullivan, O., and Gershuny, J. (2011). Gender convergence in domestic work: Discerning the effects of interactional and institutional barriers from large-scale data.Sociology45(2): 234–251.doi:10.1177/0038038510394014.
Kan, M.-Y. and Hertog, E. (2017). Domestic division of labour and fertility preference in China, Japan, South Korea, and Taiwan.Demographic Research36(18): 557– 587.doi:10.4054/DemRes.2017.36.18.
Kim, E.H.W. (2017). Division of domestic labour and lowest-low fertility in South Korea. Demographic Research 37(24): 743–768. doi:10.4054/DemRes.2017. 37.24.
Kim, S.-W., Chang, Y.-H., Iwai, N., and Li, L. (2014). East Asian Social Survey (EASS), Cross-National Survey S Sets: Families in East Asia, 2006. Ann Arbor: EASSDA, Inter-university Consortium for Political and Social Research. (ICPSR 34606) doi:10.3886/ICPSR34606.v3
Kolpashnikova, K. (2018). American househusbands: New time use evidence of gender display, 2003–2016. Social Indicators Research 140(3): 1259–1277. doi:10.10 07/s11205-017-1813-z.
Kolpashnikova, K., Kan, M.-Y., and Shirakawa, K. (2019a). Marriage and housework: Analyzing the effects of education using the 2011 and 2016 Japanese survey on time use and leisure activities. (IER Discussion Paper 696). doi:10.312 35/osf.io/9shup.
Kolpashnikova, K., Kan, M.-Y., and Shirakawa, K. (2019b). Marriage penalty: Unconditional quantile regression of housework participation in Japan. (IER Discussion Paper 695).doi:10.31219/osf.io/5qdwy.
Kolpashnikova, K. (2019c). Taiwan: Paid and unpaid work trends. Retrieved from https://blogs.ubc.ca/kamilakolpashnikova/taiwan-paid-and-unpaid-work-trends/ McDonald, P. (2009). Explanations of low fertility in East Asia: A comparative
perspective. In: Jones, G.W., Straughan, P.T., and Chan, A.W.M. (eds.). Ultra-low fertility in Pacific Asia: Trends, causes and policy issues. New York: Routledge: 23– 39.
Mu, Z. and Xie, Y. (2016). ‘Motherhood penalty’ and ‘fatherhood premium’? Fertility effects on parents in China. Demographic Research 35(47): 1373–1410. doi:10.4054/DemRes.2016.35.47.
Nagase, N. and Brinton, M.C. (2017). The gender division of labor and second births: Labor market institutions and fertility in Japan. Demographic Research36(11): 339–370.doi:10.4054/DemRes.2017.36.11.
Okun, B.S. and Raz-Yurovich, L. (2019). Housework, gender role attitudes, and couples’ fertility intentions: Reconsidering men’s roles in gender theories of family change. Population and Development Review 45(1): 169–196.doi:10.11 11/padr.12207.
Qi, X.F. and Melhuish, E.C. (2017). Early childhood education and care in China: History, current trends and challenges. Early Years 37(3): 268–284. doi:10.1080/09575146.2016.1236780.
Qian, Y. and Sayer, L.C. (2016). Division of labor, gender ideology, and marital satisfaction in East Asia. Journal of Marriage and Family 78(2): 383–400. doi:10.1111/jomf.12274.
Raymo, J.M., Park, H., Xie, Y., and Yeung, W-j.J. (2015). Marriage and family in East Asia: Continuity and change. In: Cook, K.S. and Massey, D.S. (eds.). Annual Review of Sociology41: 471–492.doi:10.1146/annurev-soc-073014-112428. Sechiyama, K. (2013). Patriarchy in East Asia: A comparative sociology of gender.
Leiden: BRILL.doi:10.1163/9789004247772.
Sullivan, O., Billari, F.C., and Altintas, E. (2014). Fathers’ changing contributions to child care and domestic work in very low-fertility countries: The effect of education.Journal of Family Issues35(8): 1048–1065.doi:10.1146/annurev-soc -073014-112428.
Sullivan, O., Gershuny, J., and Robinson, J.P. (2018). Stalled or uneven gender revolution? A long-term processual framework for understanding why change is slow. Journal of Family Theory and Review 10(1): 263–279. doi:10.1111/ jftr.12248.
Suzuki, T. (2013). Low fertility and population aging in Japan and Eastern Asia. Berlin: Springer.doi:10.1111/jftr.12248.
Yu, W.-H. (2015). Women and employment in Taiwan. https://www.brookings.edu/ opinions/women-and-employment-in-taiwan/.
Zhou, M. (2017). Motherhood, employment, and the dynamics of women’s gender attitudes.Gender and Society 31(6): 751–776.doi:10.1177/0891243217732320. Zhou, M. and Kan, M-Y. (2019). A new family equilibrium? Changing dynamics
between the gender division of labor and fertility in Great Britain, 1991–2017.