Iran University of Medical Sciences
____________________________________________________________________________________________________________________
1. PhD candidate, Faculty of Health Services Management, Shiraz University of Medical Sciences, Shiraz, Iran. mrzakeriir@yahoo.com
2. (Corresponding author) Assistant Professor, National Institute for Health Research, Tehran University of Medical Sciences, Tehran, Iran.
olyaee@tums.ac.ir
3. MSc in Health Economics, HTA, Standard and Tariff Office, Curative department, Ministry of Health & Medical Education, Tehran, Iran.
m.zan1976@gmail.com
4. Assistant Professor, Department of Health Economics, Medicine Faculty, Shahed University, Tehran, Iran. kazemian@shahed.ac.ir
5. Professor, Department of Health Management and Economics, School of Public Health, Tehran University of Medical Sciences, Tehran, Iran.
Arashidian@tums.ac.ir
6. Assistant Professor, Ministry of Health and Medical Education, Tehran, Iran. mohme2003@gmail.com
7. Health Management Research Centre, Baqiyatallah University of Medical Sciences, Tehran, Iran. shr_tofighi@yahoo.com
The financing of the health system in the Islamic Republic of
Iran: A National Health Account (NHA) approach
Mohammadreza Zakeri1, Alireza Olyaeemanesh*2, Marziee Zanganeh3 Mahmoud Kazemian4, Arash Rashidian5, Masoud Abouhalaj6, Shahram Tofighi7
Received:6 September 2014 Accepted:29 June 2015 Published:5 August 2015 Abstract
Background: The National Health Accounts keep track of all healthcare related activities from the beginning (i.e. resource provision), to the end (i.e. service provision). This study was conducted to address following questions: How is the Iranian health system funded? Who distribute the funds? For what services are the funds spent on?, What service providers receive the funds?
Methods: The required study data were collected through a number of methods. The family health expenditure data was obtained through a cross sectional multistage (seasonal) survey; while library and field study was used to collect the registered data. The collected data fell into the following three categories: the household health expenditure (the sample size: 10200 urban households and 6800 rural households-four rounds of questioning), financial agents data, the medical universities financial performance data.
Results: The total health expenditure of the Iranian households was 201,496,172 million Rials in 2008, which showed a 34.4% increase when compared to 2007. The share of the total health ex-penditure was 6.2% of the GDP. The share of the public sector showed a decreasing trend between 2003-2008 while the share of the private sector, of which 95.77% was paid by households, had an increasing trend within the same period. The percent of out of pocket expenditure was 53.79% of the total health expenditure. The total health expenditure per capita was US$ 284.00 based on the official US$ exchange rate and US$ 683.1 based on the international US$ exchange rate.( exchange rate: 1$=9988 Rial).
Conclusion: The share of the public and private sectors in financing the health system was imbal-anced and did not meet the international standards. The public share of the total health expenditures has increased in the recent years despite the 4th and 5th Development Plans. The inclusion of house-hold health insurance fees and other service related expenses increases the public contribution to 73% of the total.
Keywords: Financing, Health System, National Health Account.
Cite this article as:Zakeri M, Olyaeemanesh A, Zanganeh M, Kazemian M, Rashidian A, Abouhalaj M, Tofighi Sh. The financing of the health system in the Islamic Republic of Iran: A National Health Account (NHA) approach.Med J Islam Repub Iran2015 (5 August). Vol. 29:243.
Introduction
The World Health Organization’s (WHO) report of 2000 stated that objectives of the health system must not be realized by
im-posing an inappropriate financial burden on its clients. The availability of accurate sta-tistics on the capital flow as well as easy access to the required data is an essential
component in any attempt to enhance and improve the financial resources of the health systems. On the other hand, evalua-tion of the socio-economic status of the countries has gained importance in the re-cent decades. In this regard, depicting the health status of the countries in terms of accounts and standard tables is of para-mount importance (1).
For this reason, attempts have been made to develop appropriate tools for collecting and analyzing the data for policy makers. The National Health Accounts (NHAs) en-ables the policy makers to optimize the al-location of the financial resources to the service providers in the health sector. In other words, NHAs are designed for opti-mizing the process of making health related policies. Health policy makers and health system managers are the main beneficiaries of the NHAs to improve the performance and management of health systems (2).
It is a matter of general censensus that the NHAs are the most essential source of data to be consulted by the decision-makers in programming, budgeting, and implementa-tion of the health policies. In fact, as Na-tional Economic Accounts are calculated on the basis of expenses as well as financial resources and the budget allocations to pro-vide the required data on the total value of the products on market values within a specified financial period, the NHAs, as a component of the national accounts, pro-vide the required information on total value of health services, the share of the public and private sectors, performance results, the budget allocation to the subordinate or-ganizations, expenditures on the national level, and the overall outcome of health services. The information, which are col-lected in the macroeconomic and sectional levels as time series, can be utilized in per-formance analysis as well as studying fac-tors involved in the decision making pro-cess and economic fluctuations (3).
These accounts keep a record of the health expenditures through indicating the agents (private and public sectors) which
well as detailed information on how the health budget is allocated to different or-ganizations, such as the health insurance companies, to achieve the health objectives (4).
Being aware of those who pay health ex-penditures can provide a worthful infor-mation for designing health policies and recognizing the intermediate units; for ex-ample, many countries have conducted de-centralization on the public sector by fi-nancing the health services through provin-cial funds. The information on health ac-counts shows their success rate in achieving their objectives. These accounts also enable experts to compare the function and role of public and private sectors as well as health insurance companies in providing the re-quired services. The health accounts enable the managers and decision-makers of the health services not only to prioritize but also to optimize the expenditure in this sec-tor. Given to this matter, this study has been conducted to address following ques-tions: How is the Iranian health system funded? Who distribute the funds?, What services are the funds spent on?, and what service providers receive the funds?
Methods
The present study, which covers the health accounts of 2008, is the outcome of a close cooperation between the Iranian Ministry of Health, Statistics Center of Iran, National Institute for Health Research, and the insurance companies on the basis of the OECD defined framework for NHAs. The health accounts are presented as tables that trace cash flow from the various fund-ing agents to expendfund-ing services in order to indicate the total expenditure in the health sector. The tables are prepared based on the following information: the information on socio-economic status of the households, the information on financing agents in pub-lic and private sectors, the information on health service providers in public and pri-vate sectors, the information on financing resources. The present study surveyed the
cross sectional multi-stage (seasonal) study, and the registered data was collected using library and field study methods. The data on the financing agents in 2008 including the public and private insurance companies as well as the Oil Ministry, Municipality and other organizations that provide insur-ance services, was collected through the OECD questionnaire designed for financial agents. The data on the financial perfor-mance of the Iranian medical universities collected by the centre for budget and fuction surveillance of the Ministry of Health. The collected data was integrated in the health account pre-designed tables by the application of the Info-path Software. The precise data on households was ex-tracted through several reviews of the com-pleted questionnaires. In the final phase of the study, the data was registered in the in-dependent table formats to unify and bal-ance the statistical findings. There are a number of three dimensional tables which integrate the information on the financing source, type of the services, and the service providers. These tables can decompose into some other tables to analyze relationship between the two of the three dimensions.
Results
A) The Total Health Expenditure
The findings of the present study on the financing of health system in Iran indicated that both public and private sectors
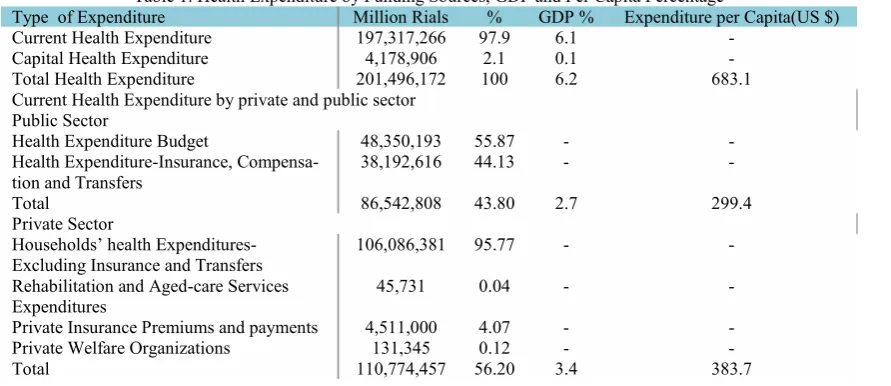
contrib-uted to funding health services (Table 1). The public sector expenditures were “the current expenditure of the health system in the government budget”, “the health system expenditure from insurance resources”, “compensation payments and services”, and “transfer fees”. The private sector ex-penditure were “household payments”, “private health insurance premiums”, “non-profit and charity institutes expenses” and “rehabilitation and nursing homes expens-es”. According to this study, total health expenditure was 201,496,172 million Rials as shown in Table 1; the public sector share of the health expenditure was 43.80% while the private sector had a share of 56.20%. The public sector funded 19.36% of the ex-penses through insurance premiums and 24.5% through public budget. The share of the households was 95.77% of the private sector expenditure that consisted 53.79% of the total health expenditure. The total health expenditure was 6.2% of GDP; 6.1% for current expenses and 0.1% for capital expenses. The public and private sectors expenditure made 2.7% and 3.4% of this total GDP share, respectively. The health expenditure per capita was $ US 683.1; the public sector paid $ US 299.4 and private sector financed $ US 338.7. These findings showed that the public sector did not con-tribute a fair share of the health expenditure and the private sector paid most of health expenses.
Table 1. Health Expenditure by Funding Sources, GDP and Per Capita Percentage
Type of Expenditure Million Rials % GDP % Expenditure per Capita(US $)
Current Health Expenditure 197,317,266 97.9 6.1
-Capital Health Expenditure 4,178,906 2.1 0.1
-Total Health Expenditure 201,496,172 100 6.2 683.1
Current Health Expenditure by private and public sector Public Sector
Health Expenditure Budget 48,350,193 55.87 -
-Health Expenditure-Insurance,
Compensa-tion and Transfers 38,192,616 44.13 -
-Total 86,542,808 43.80 2.7 299.4
Private Sector
Households’ health
Expenditures-Excluding Insurance and Transfers 106,086,381 95.77 -
-Rehabilitation and Aged-care Services
Expenditures 45,731 0.04 -
-Private Insurance Premiums and payments 4,511,000 4.07 -
-Private Welfare Organizations 131,345 0.12 -
-Total 110,774,457 56.20 3.4 383.7
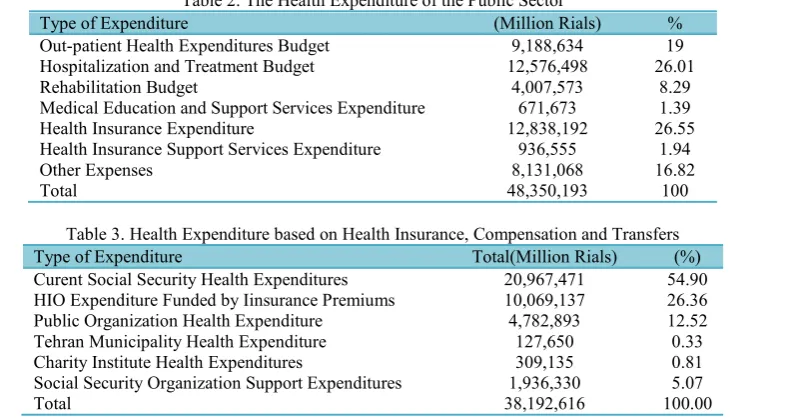
In spite of the fact that the current health policies have focused on the need for fur-ther investment on preventive and primary health, the study findings indicated that 26% of the public sector health expenditure went to treatment services and 19% was spent on primary health care; in other words, it accounted for 4.3% of the total health expenditure which is not inconsistent as compared to the international indices (Table 2). The average primary health care expenditure is 2.9% in OECD countries that this rate was 4.7 % globally in 2002 (5). The OECD data indicates that industri-al countries spend less on the primary health care (6). It must be mentioned that in the developing countries such as Bangla-desh and Vietnam this index is 13 to 15 per cent (7). The average is 7.8% for the East-ern Mediterranean countries (8). Iran has established a network of primary health care in rural areas as its major health in-vestment. If the rural insurance expenditure is taken into consideration, then the prima-ry health expenditure exceeds that of treat-ment.
The study of health expenditures funded through insurance premiums, compensation and transfers shows that 55% of the ex-penses are for the Social Security Organiza-tion (SSO) as the largest non-public insur-ance company. This organization has the
vider. The Health Insurance Organization (HIO), as the second largest health insurer in Iran, relies on public funding. The con-tribution of those insured by these insur-ance organizations is given here (Table 3).
B) The Health Care Financing Agents
The financing agents are responsible for managing the allocated budget. The Minis-try of Health and health insurance compa-nies receive and spend the public sector budget. The insurance premium is used by the Social Security Organization, Health Services Organization, state companies (Oil Company, IRI Broadcasting, the Ministry of Education, etc.) and the municipalities, respectively. The charity institutes have the minimal share of the health expenditure in Iran. In a number of OECD countries such as New Zealand, Australia, Norway, Swe-den, Portugal, Denmark, and Spain, the public budget is the main source of financ-ing the health care system (5). While social health insurance is of secondary importance as compared with the private health insur-ance, public sector support minimalizes the out of pocket expenditure in these coun-tries. Meanwhile, in a number of countries (Belgium, Germany, France, Netherlands, Japan, etc.), the public budget is replaced by social health insurance coverage which keeps the out-of-pocket expenditures low.
Table 2. The Health Expenditure of the Public Sector
Type of Expenditure (Million Rials) %
Out-patient Health Expenditures Budget 9,188,634 19
Hospitalization and Treatment Budget 12,576,498 26.01
Rehabilitation Budget 4,007,573 8.29
Medical Education and Support Services Expenditure 671,673 1.39
Health Insurance Expenditure 12,838,192 26.55
Health Insurance Support Services Expenditure 936,555 1.94
Other Expenses 8,131,068 16.82
Total 48,350,193 100
Table 3. Health Expenditure based on Health Insurance, Compensation and Transfers
Type of Expenditure Total(Million Rials) (%)
Curent Social Security Health Expenditures 20,967,471 54.90 HIO Expenditure Funded by Iinsurance Premiums 10,069,137 26.36
Public Organization Health Expenditure 4,782,893 12.52
Tehran Municipality Health Expenditure 127,650 0.33
Charity Institute Health Expenditures 309,135 0.81
Social Security Organization Support Expenditures 1,936,330 5.07
Total 38,192,616 100.00
combination of public budget and social health insurance manages the health ex-penditures and out of pocket expenditure which is low (7). In Iran, out of pocket ex-penditure is high as the medical insurance organizations and public budget do not play their complete role in health care financing (Table 4).
C) Health Expenditure by Service
Categorising the health expenditures by the type of service shows that like other countries, a major part of expenditure in Iran is spent on diagnostic services, con-sumable equipments and medicine which can create induced demand by physicians and patients. The next services with the highest expenditure are outpatient services (of which 80% are provided by the private
sector and 20% by the public sector). In OECD countries, the similar indices are as follow: Inpatient 10%, Outpatients 30%, Rehabilitation and long term care 10%, Medical equipment 23%, Other Services 6%. The only indices which are higher in Iran when compared to OECD countries are diagnostic services, medicines, and other outpatient services (36%) and long term care (2.4%); the difference in the first index is due to adding diagnosis expenditures to medicine and medical equipment expendi-tures and the second instance is because of cultural differences; while this index is 16% for a country like Japan which has an aged population, the index is almost in line with Iran in the countries with similar de-mographic and cultural characteristics (Ta-ble 5) (5).
Table 4. Health Services Financing by sources and organizations
To
tal
Private Sector Resources Public Sector and social health insurance Resources
Financing agent sources N on pro fit O rg an iza tio n Pri va te In su ra nc e H ou seh old s
Social Security Insurance Resources State Budget Ch ari ty ins titu tie s Te hra n Ci ty m un icip alty Sta te c om pa nie s Pu blic H eal th In su ra nc e So cia l S ecu rity In su ra nc e U niv ers al In su ra nc e Pri m ary he alth care an d T re at-m en t S ch em es (M illi on Ri als ) T ota l 19 7, 31 7, 26 6 13 1, 34 5 4, 51 1, 00 10 6, 13 2, 11 2 30 9, 13 5 12 7, 65 0 4, 78 2, 89 3 10 ,0 69 ,1 38 22 ,9 03 ,1 38 13 ,7 74 ,7 47 34 ,5 75 ,4 46 10 0 0. 1 2. 3 53 .8 0. 2 0. 1 2. 4 5. 1 11 .6 7. 0 17 .5 %
Table 5. Health Expenditure by Service (2008)
Type of Service Expenditure(Million Rials) %
Inpatients and Rehabilitation Services 46,602,142 24.1
Long Term Rehabilitation Services 4,576,894 2.4
Outpatients Services 62,504,097 31.4
Diagnosis, Drug and Other for Outpatient Services 71,958,507 36
Other Services 11,675,626 6.1
Total 197,317,266 100
Table 6. Inpatient and Rehabilitation Expenditure by Provider (2008)
% Million Rials
Type of Provider
66 30,732,490
Public Hospitals
11 4,949,371
Social Security Hospitals
5 2,209,135
public companies Hospitals
16 7,649,853
Private Hospitals
2 1,061,294
Non-Profitable Private Hospitals
100 46,602,142
Total
D) Health Expenditure by Providers
Tables 6, 7 and 8 indicate health expendi-ture based on the services and service pro-viders. Table 6 shows that 66% of the ex-penditure is for hospitalization in the public hospitals. If the social security hospitals and those run by state organizations were taken into account, the findings of this study would be in conformity with the pre-vious study (2002) which showed 80% hospitalization expenditure for public and 20% for the private sectors.
The long term rehabilitation and aged-care services reveal the cultural values pre-vailing in a country. The elderly are cared for by their family members as a cultural and religious feature; therefore, families use these services less frequently in the country and therefore private sector are not the major service provider.
Tables 8 and 9 show health expenditure on the outpatient and diagnostic services as well as the cost of medication. The public hospitals and health centers offered 23.5% of the outpatient services, and the private sector was the service provider in 76.5% of the cases. The dentistry expenses were the main source of expenditure as a number of
surance package and are mainly provided by the private sector. Table 9 shows that more than 64% of expenditure in this group of services if for medications, which is is mainly due to mismanagement of the medi-cation by the households.
Discussion
It is a matter of general consensus that the National Health Accounts are one of the major sources of information in decision-making on policies and modifying the fi-nancing routs of the health care system (Expenses, Resources, and Expenditure). In fact, in the same way that the macroeco-nomic accounts provide the required infor-mation on the total value of their market value within a definite period of time by calculating the funding resources and the expenditure, the National Health Accounts, as national macro-accounts, sum up the in-formation of the total value of the health services, the performance of the public and private sectors in this respect, and the con-tribution and the share of these sectors and their affiliated organizations in regard to the funding resources, expenditure and the other financial issues. The macroeconomic and sector information as time series are
Table 7. Long term Rehabilitation Expenditure by Providers (2008)
Type of Provider Expenditure (Million Rials) %
Public Rehabilitation Organizations 4,531,163 99.05
Private Rehabilitation Organizations 45,731 0.95
Total 4,576,894 100
Table 8. Out-patients services Expenditure by providers (2008)
Type of provider Million Rials %
Public Hospitals 7,584,366 12.5
Private Hospitals 6,149,550 9.9
GP clinic 14,842,800 23.7
Dentists clinic 24,075,358 37.9
Other medical sttaf clinics 3,165,731 5
Public Centers and clinics 6,686,293 11
Total 62,504,097 100
Table 9. Diagnostic, medicine and others for out patient services by provider (2008) % Million Rials
Type of provider
9.9 7,077,673
Medical diagnostic Labs
13.5 9,687,601
Radiology and Imaging institutes
63.5 45,575,765
Pharmacies and Drug Stores
2.8 2,108,871
Medical Consumption Goods
10.3 7,508,597
Other Medical Goods
100 71,958,507
Total
formance and the assessment of the policies in both national and sector levels. The pre-sent study, which was undertaken by the Ministry of Health and Medical Education, had a statistical sample of about 68000 and aimed at describing the financing and ex-penditure trends of the health sector. This study differs from the previous ones in the sample size, familiarity of the interviewers with the issues involved, and the type of the questionnaire used. The results of the study provided detailed information on the household health expenditure while the overall data was not much different with similar studies. The selection of assessment criteria is the main concern in establishing NHAs as the information on different coun-tries would not be comparable without such a well-defined index. The major strength of this study lies in the selection of the indices that are applied in the international level as well as the design of its data collecting tool. It is important to note that the present study considered the health expenditure as 6.20% of the Iran GDP, which is 2% higher than the regional data although it was 2.30% lower than the international average. This index is not indicative of an optimized ex-penditure as there would be more resources available in a country with the similar GDP and less population. The expenditure per-capita index of 683.10 US$ is 2.5 times higher than the regional index but 1.30 times lower than the international index. This index is divided into public and pri-vate sectors expenditure; the public ex-penditure on health is 48.5% in the region which is only 4.70% higher than that of Iran (43.8%) while the international percent of public expenditure on health is 58.20% which is much higher thatn that of Iran. This index shows that public sector contri-bution to the health expenditure has re-duced and the private sector has increased in Iran, which is a reverse trend as com-pared to other countries. The out-of-pocket is expressed in two forms. According to the National Health Accounts, the private sec-tor contribution is devided into the follow-ing categories: household expenditure
ex-cluding insurance fee and transfers, rehabil-itation and aged care expenditure, private commercial insurance expenditure, charity and non-profitable instituties. The share of people's OOP expenditure was 95.77% of the total private health expenditures. The regional index is 88.9%, and the overall international index is 50.5%. This index is 85.7% for the poor countries. The next in-dex showed that 56.20% of the total health expenditure was provided by the private sector, of which 53.69% was paid directly by people (OOP) and 2.50% was funded by private health insurance companies. This index is not usually taken into considera-tion internaconsidera-tionally. These two indexes suggest that people pay over 50% of the health expenses in Iran while it is less than 30% in many countries. Although the ex-penditure on the medication and diagnosis services showed a similar trend to many OECD countries, there was a significant difference with the OECD index in regard to the long-term services. The results of the study showed that Iran was similar to the developed countries in many respects but in those areas of expenditure with cultural and demographic issues involved such as long-term care, the results were like the less de-veloped countries. The health expenditure on the technology-based services such as diagnosis and medication needs to be re-duced. The preventive and primary health care services used only 4.30% of the ex-penditures. Although this rate is similar to the OECD index because of previous gov-ernment investments, there is a need for increased investment in this sector by the government as it is a cost-effective invest-ment and PHC infrastructure need more investment. This study showed that 72% of the expenditure on inpatient services occure in the public sector and direct out-of-pocket payment (OOP) covered only 1.6% of the expenditure in this sector. This can be used as a successful experience for the countries with a high level of OOP in inpatients ser-vices. Inspite of this successful experience of the public sector in inpatient services, categorizing outpatient services by provider
indicated that 90% of these services were provided by the private sector which result-ed in more than 45% out of pocket expens-es. The results of this study indicated that providing outpatient services by the public sector and increasing the quality of these services and managing the medicine and diagnostic services costs using clinical guidelines could be the best way to de-crease out of pocket expenses. Generally, the present study showed that the public and private sectors share of the health ex-penditure was far from equity and would fall short from international standards. In spite of the policies included in the 4th and 5th Development Plans, this imbalance has increased in recent years. The private sector finances 73% of the health expenditure with the inclusion of insurance fees, and compensation and transfer payments. This trend is completely different in many coun-tries. The results of the study were based on the 2008 statistics. About 10% of the budg-et of targbudg-eting subsidies is supposed to be used to finance the health system for the main areas of the public expenditure such as OOP expenditure. The application of the clinical practice guidelines to reduce in-duced demands would also reduce the
health expenditure and leads to the achievement of the international standards.
Conflict of Interest
There is no conflict of interest.
References
1. World Health Organization. The world health report 2000. [Cited at April 2014] available at {URL: http://www.who.int/whr/2000/en/}.
2. Poullier J, Hernandez P, Kawabata K National Health Accounts: Concepts, Data Sources and Methodology. World Health Organization, 2002.
3. Orosz E, Morgan D. SHA-Based National Health Accounts in Thirteen OECD Countries: A Comparative Analysis. OECD Health Working Pa-pers 16, OECD Publishing, 2004.
4. The World Bank Group Human Development Sector Middle East and North Africa. Islamic Re-public of IranHealth Sector Review. [Cited at April 2014] available at {URL: http://hdl.handle. net/10986/7969}.
5. OECD. Health at a Glance: Europe 2012. [Cit-ed at April 2014] available at {URL: http://dx.doi.org/10.1787/9789264183896-en}.
6. De Alwis SS, Fernando T, Rannan-Eliya RP. Sri Lanka Health Accounts: National Health Ex-penditure 1990-2008. Health ExEx-penditure Series No.2. Colombo, Institute for Health Policy. 2011.
7. World Health Organization – EMRO. Health economic and health care financing. [Cited at April 2014] available at {URL: http://www.emro.who. int/entity/health-economics/}.