© European Geosciences Union 2004
Geophysicae
Smoothness of ozone profiles: analysis of 11 years of ozone sonde
measurements at Sodankyl¨a
V. F. Sofieva1, E. Kyr¨o2, and E. Kyr¨ol¨a1
1Finnish Meteorological Institute, Earth Observation, P.O.Box 503 (Vuorikatu 15 A) FIN-00101 Helsinki, Finland 2Finnish Meteorological Institute, Arctic Research Center, Sodankyl¨a, Finland
Received: 26 November 2003 – Revised: 7 April 2004 – Accepted: 18 May 2004 – Published: 7 September 2004
Abstract. This paper discusses the smoothness of vertical profiles of ozone concentrations. We describe the smooth-ness of ozone profiles via a characteristic scale of the profile fluctuations. The characteristic scale was computed for 11-years (1989–1999) ozone sonde data at Sodankyl¨a. Mean values of the characteristic scale were determined. They are ∼1 km in the troposphere and ∼1.4 km in the lower stratosphere (up to 25 km). Only slight seasonal variations of these parameters are observed.
The information about smoothness of ozone profiles is needed both in the instrumental design for defining the vertical resolution requirements and in the development of inversion algorithms from remote sensing measurements, in order to obtain the best accuracy in retrieved ozone profiles and sufficient resolution.
Key words. Meteorology and atmospheric dynamics (Mid-dle atmosphere-composition and chemistry; Troposphere-composition and chemistry; General or miscellaneous)
1 Introduction
The vertical distribution of ozone often exhibits a laminated structure as shown first by (Dobson, 1973). Appearance and trends of laminated structures were studied in, for example, (Reid et al., 1993), (Mlch and Lastovicka, 1996). The mechanism of laminae formation is still uncertain. It was recognized that the most important sources of ozone laminated structure are gravity wave activity and horizontal large-scale advection (Teitelbaum et al., 1996), (Gruzdev and Elanskiy, 1984), (Holton, 1987), (Tomikawa et al., 2002). In this paper, we consider the problem from another side: we will characterize the smoothness of the vertical distribution of ozone in general, calculating its characteristic scale. This describes typical fine structures in ozone profiles.
This study has two objectives:
1. To define the vertical resolution requirements for detection of ozone dynamical structures;
Correspondence to: V. F. Sofieva (viktoria.sofieva@fmi.fi)
2. To create the prior information, which can be used in the advanced inversion schemes from remote sensing measurements.
This information becomes especially important with recent development of remote sensing measurements for monito-ring the atmosphere. The inverse problems appeamonito-ring from these measurements are often ill-posed. The performance of inversion can be significantly improved by including a priori information (Rodgers, 2000), (Retscher et al., 2004) or regularization (Steck, 2002), (Tamminen et al., 2004), (Haario et al., 2004). Both approaches implicitly assume that atmospheric profiles are smooth enough, so that the values at adjacent altitudes are correlated. The correlation length of the ozone profile fluctuations corresponds to the characteristic scale of the fine structures in the ozone profiles. In Sect. 2 we give information about ozone sonde measurements at Sodankyl¨a and the data used in the analysis. The data processing is described in Sect. 3. The results are presented in the final part of the paper.
2 Ozone sonde measurements
The location (67◦N, 27◦E) in northern Finland has main-tained a regular balloon borne ozone sonde program since late 1988 (http://fmiarc.fmi.fi). Only minor changes in sonde sub-types and operation practices occurred during this period, allowing one to establish homogeneous data series. Therefore, dynamical and chemical influences on stratospheric ozone can be investigated on a time scale of decades.
Table 1. Number of analyzed ozone sonde profiles.
1989 1990 1991 1992 1993 1994 1995 1996 1997 1998 1999 Total
January 4 4 6 11 5 5 13 4 16 11 7 86
February 4 5 4 12 10 6 15 10 14 10 5 95
March 3 4 4 11 9 14 14 8 0 5 5 77
April 4 4 3 5 4 5 8 6 0 4 4 47
May 6 2 4 4 5 4 5 5 3 2 1 41
June 4 4 1 4 4 4 4 4 2 4 4 39
July 4 1 3 4 3 3 4 5 4 4 1 36
August 6 5 4 2 4 4 5 3 3 1 3 40
September 4 3 2 5 4 3 3 4 4 4 4 40
October 4 4 5 5 3 4 3 5 4 2 2 41
November 5 4 3 4 4 5 5 3 4 4 2 43
December 4 2 11 4 4 5 4 4 6 10 3 57
[image:2.595.60.273.322.395.2]Total 52 42 50 71 59 62 83 61 60 61 41 642
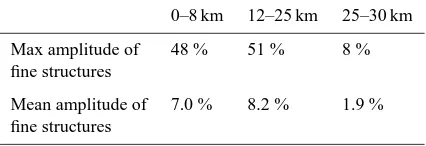
Table 2. Amplitude of the relative fluctuations of ozone concentration. Mean values over 11-year time series are presented.
0–8 km 12–25 km 25–30 km
Max amplitude of 48 % 51 % 8 %
fine structures
Mean amplitude of 7.0 % 8.2 % 1.9 % fine structures
3 Data processing
For analyzing fine structures in the ozone profiles, the altitude range of the measurements was split into three domains: troposphere (∼0–8 km), stratospheric part mainly affected by dynamics (∼12–25 km) and the altitude domain where mainly photochemical processes affect the ozone concentration (>25 km). The region around the tropopause was excluded from the analysis.
The fine structure component ρfine was obtained by
removing the smooth componentρsmooth from the original
profileρ:
ρfine=ρ−ρsmooth. (1)
The smooth profile was constructed by smoothing the original profile by a Hanning filter (Oppenheim and Schafer, 1989). The cut-off scale for the smoothing was chosen so that the fluctuations around the smooth profile should exceed the measurement error and should be unbiased. We found that the optimal cut-off scale is∼3 km. (The cut-off scales 2.5–3.5 km give almost the same result as 3 km cut-off scale.) For significantly smaller scales (<2 km), the smoothed profile follows the ozone fine structures. For significantly larger scales (>5 km), fluctuations around the smoothed profile become biased.
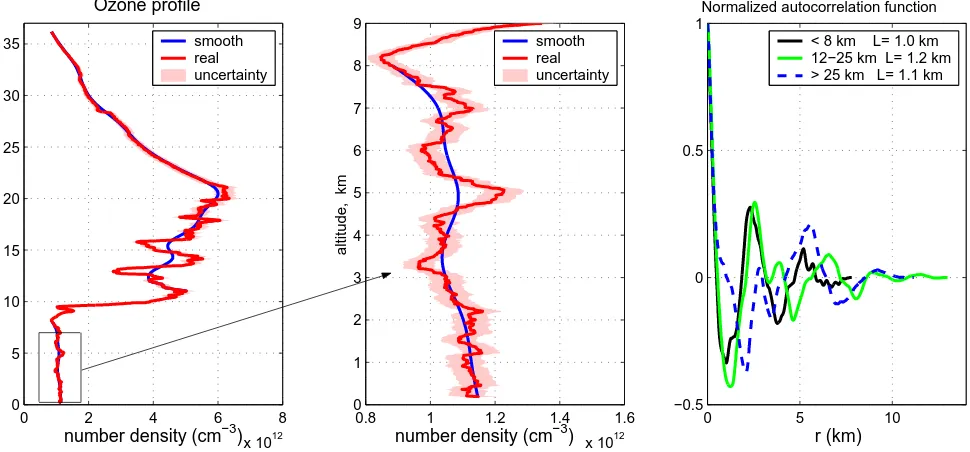
Figure 1 (left and central plots) illustrates this first step of data processing. The mean values of the profile fluctuations
are presented in Table 2. These fluctuations significantly exceed the possible measurement error (∼5%) in the tropo-sphere (0–8 km) and in the lower stratotropo-sphere (12–25 km). However, the fluctuations of ozone profiles are inside the measurement error interval in the photochemical region (>25 km). Therefore, reliable values of the characteristic scale of the ozone fine structure can be determined only up to the altitude of∼25 km.
The characteristic scale L of the ozone profile fine structure is defined as a correlation length of the profile fluctuations:
L=
Z ∞
0
|B0(r)|dr, (2)
where the normalized autocorrelation functionB0(r)can be
determined in a classical way B(r)=
Z ∞
0
ρfine(h)ρfine(h+r)dh, (3)
B0(r)=
B(r) B(0).
Herehandrrepresent altitudes. In practice, the asymptot-ically unbiased and consistent estimate (Yaglom, 1987) of the autocorrelation function is used instead of the theoretical Eq. (3):
B(r)= 1
hmax−hmin
Z hmax−r
hmin
ρfine(h)ρfine(h+r)dh, (4)
where hmin andhmaxare the lower and the upper limits of
each altitude domain, respectively. Eq. (4) gives an accurate estimation of the autocorrelation function also at large lags (Yaglom, 1987). The infinity upper limit in the theoretical Eq. (2) is also substituted by the corresponding value of the maximal lag (some points corresponding to the largest unreliable lags should be excluded).
0 2 4 6 8
x 1012 0 5 10 15 20 25 30 35
number density (cm−3)
altitude, km
Ozone profile
smooth real uncertainty
0.8 1 1.2 1.4 1.6
x 1012 0 1 2 3 4 5 6 7 8 9
number density (cm−3)
altitude, km
smooth real uncertainty
0 5 10
−0.5 0 0.5 1
r (km)
Normalized autocorrelation function
[image:3.595.59.544.66.292.2]< 8 km L= 1.0 km 12−25 km L= 1.2 km > 25 km L= 1.1 km
Fig. 1. Data processing for determination of the characteristic scale of the ozone fine structure. Left and central plot: measured and smoothed ozone profiles. Right: autocorrelation functions for the three altitude domains.
4 Results and discussion
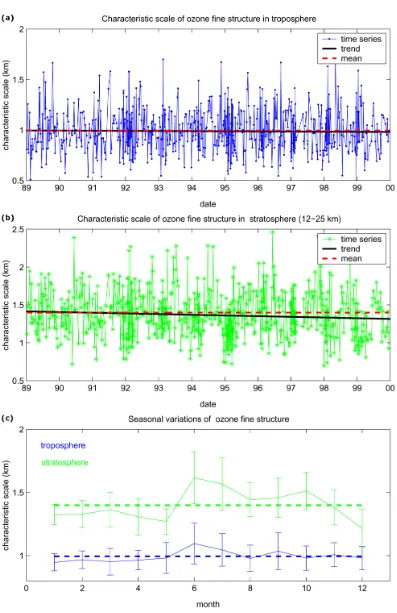
The 11-year time series of the characteristic scale of the ozone fine structures are presented in Fig. 2a, b for two altitude domains.
The mean values of the characteristic scale are∼1 km in the troposphere, and∼1.4 km in the stratosphere (they are indicated by dashed lines in Fig. 2a, b). The calculation of mean values accounts for different number of measurements per month. The time series have an insignificant negative trend (calculated as a linear regression), which can be neglected.
The obtained characteristic scales are in a good agreement with general physical expectations and previous studies of the laminated ozone structures. The smaller characteristic scale in the troposphere reflects a stronger mixing in the troposphere compared to the stratosphere. The characteristic scales have a rather large variability (standard deviation is 0.2 km in the troposphere and 0.3 km in the stratosphere) indicating that the fine structures in ozone profiles are of dynamical origin (Teitelbaum et al., 1996), (Holton, 1987). The obtained characteristic scales are in agreement with the hypothesis that the ozone fine structure formation is governed by waves of different scales: in the troposphere, which is dominated by synoptic scale waves, one would expect narrower average laminae structure than in the stratosphere, which is affected by planetary waves of a larger scale. The characteristic scale 1.4 km in the stratosphere also corresponds to the typical vertical size of ozone laminae (Reid et al., 1993).
The proposed characterization of smoothness by only one parameter is, of course, not sufficient for detecting laminae in ozone profile or for studying the origin of ozone fine
structures. For these purposes the spectral methods (e.g. (Teitelbaum et al., 1996), (Chane-Ming et al., 2000) are adequate. However, the correlation analysis is very useful in the overall characterization of the ozone profile smoothness that is needed for instrument design and advanced inversion methods.
The seasonal variations of the characteristic scales of ozone fine structure were studied by comparing the monthly mean values. They are shown in Figure 2c with error-bars presenting 1σ (σ is the standard deviation) uncertainty interval. The characteristic scales in the stratosphere are slightly smaller in winter and spring, probably because of more frequent and the most profilic laminae occurrence in these seasons (Reid et al., 1993), (Mlch and Lastovicka, 1996). However, the mean values of characteristic scales are within the uncertainty intervals, thus indicating the absence of significant seasonal variations. The characteristic scale can be therefore considered as a relatively stable characteristic of ozone vertical profiles.
5 Summary and conclusions
This information can be used in the advanced inversion methods for the remote sensing measurements (Sofieva et al., 2004), (Tamminen et al., 2004) and for defining vertical resolution requirements for new instruments. However, this analysis was performed only at one location. Therefore, one can expect the similar smoothness properties of ozone profiles at Arctic Circle but cannot conclude that these are the same everywhere in the atmosphere. The global analysis will be the subject of future research.
Acknowledgements. The authors wish to thank S. Hassinen for useful comments. The authors also thank the two anonymous reviewers for their valuable comments.
Topical Editor U.-P. Hoppe thanks two referees for their help in evaluating this paper.
References
Chane-Ming, F., Molinaro, F., Leveau, J., Keckhut, P., Hauchecorne, A., and Godin, S.: Vertical short-scale structures in the upper tropospheric and lower stratospheric temperature and ozone at La Reunion Island (20.8 S, 55.3 E), J. Geophys. Res., 105, 26 857–26 879, 2000.
Dobson, G. M. B.: The laminated structure of the ozone in the atmosphere, Q. J. R. Met. Soc., 99, 1973.
Gruzdev, A. N. and Elanskiy, N. F.: Ozone observations in the region of mountain lee waves, Izvestiya, Atmos. Oceanic Phys., 632–639, 1984.
Haario, H., Laine, M., Lehtinen, M., Saksman, E., and Tamminen, J.: MCMC methods for high dimensional inversion in remote sensing, J. of Royal Statist. Soc., 66, Part 3, 591–607, 2004. Holton, J. R.: The production of temporal variability in trace
constituent, in Transport Processes in the Middle Atmosphere, edited by G. Visconti and R. Garcia, D. Reidel Publishing company, 313–326, 1987.
Mlch, P. and Lastovicka, J.: Analysis of laminated structure in ozone vertical profiles in Central Europe, Ann. Geophysicae, 7, 744–752, 1996.
Oppenheim, A. V. and Schafer, R. W.: Discrete-time signal processing, Prentice-Hall, 1989.
Reid, S. J., Vaughan, G., and Kyr¨o, E.: Occurence of Ozone Laminae Near the Boundary of the Stratospheric Polar Vortex, J. Geophys. Res., 8883–8890, 1993.
Retscher, C., Kirchengast, G., Gobiet, A., and Hauchecorne, A.: Stratospheric temperature and ozone sounding with EN-VISAT/GOMOS stellar occultation, Occultations for Probing Atmosphere and Climate – Science from the OPAC-1 Interna-tional Workshop, Graz, Austria, edited by Kirchengast, G. and Foelsche, U., Springer Verlag, 299–310, 2004.
Rodgers, C. D.: Inverse Methods for Atmospheres: Theory and Practice, World Scientific, Singapore, 2000.
Sofieva, V. F., Tamminen, J., Haario, H., Kyr¨ol¨a, E., and Lehtinen, M.: Ozone profile smoothness as a priori information in the inversion from limb measurements, accepted in Ann. Geophys., 2004.
Steck, T.: Methods for determining regularization for atmospheric retrieval problems, Applied Optics, 41, 1788–1797, 2002. Tamminen, J., Kyr¨ol¨a, E., and Sofieva, V.: Does a priori
information improve occultation measurements?, Occultations for Probing Atmosphere and Climate – Science from the OPAC-1 International Workshop, Graz, Austria, edited by Kirchengast, G. and Foelsche, U., Springer Verlag, 87–98, 2004.
Teitelbaum, H., Moustaoui, M., Ovarlez, J., and Kelder, H.: The role of atmospheric waves in the laminated structure of ozone profiles at high latitude, Tellus, 48A, 422–455, 1996.
Tomikawa, Y., Sato, K., Kita, K., Fujiwara, M., and Sano, T.: Formation of ozone laminae due to different advection revealed by intensive observations, J.Geophys. Res., 107(D10), doi:10.1029/2001JD000386, 2002.