Ames Laboratory Accepted Manuscripts
Ames Laboratory
11-1-2017
Doping evolution of the anisotropic upper critical
fields in the iron-based superconductor
Ba1−xKxFe2As2
Makariy A. Tanatar
Iowa State University and Ames Laboratory, [email protected]
Yong Liu
Ames Laboratory, [email protected]
J. Jaroszynski,
Florida State University
J. S. Brooks
Florida State University
Thomas A. Lograsso
Iowa State University and Ames Laboratory, [email protected]
See next page for additional authors
Follow this and additional works at:
http://lib.dr.iastate.edu/ameslab_manuscripts
Part of the
Condensed Matter Physics Commons
, and the
Materials Science and Engineering
Commons
This Article is brought to you for free and open access by the Ames Laboratory at Iowa State University Digital Repository. It has been accepted for inclusion in Ames Laboratory Accepted Manuscripts by an authorized administrator of Iowa State University Digital Repository. For more information, please [email protected].
Recommended Citation
Tanatar, Makariy A.; Liu, Yong; Jaroszynski,, J.; Brooks, J. S.; Lograsso, Thomas A.; and Prozorov, Ruslan, "Doping evolution of the anisotropic upper critical fields in the iron-based superconductor Ba1−xKxFe2As2" (2017).Ames Laboratory Accepted Manuscripts. 63.
Doping evolution of the anisotropic upper critical fields in the iron-based
superconductor Ba1−xKxFe2As2
Abstract
In-plane resistivity measurements as a function of temperature and magnetic field up to 35 T with precise
orientation within the crystallographic ac plane were used to study the upper critical field Hc2 of the
hole-doped iron-based superconductor Ba1−xKxFe2As2. Compositions of the samples studied spanned from
under- doped x=0.17 (Tc=12 K) and x=0.22 (Tc=20 K), both in the coexistence range of stripe magnetism
and superconductivity, through optimal doping x=0.39 (Tc=38.4 K) and x=0.47 (Tc=37.2 K), to overdoped
x=0.65 (Tc=22 K) and x=0.83 (Tc=10 K). We find notable doping asymmetry of the shapes of the anisotropic
Hc2(T), suggesting the important role of paramagnetic limiting effects in the H
∥
a configuration in overdoped
compositions and multiband effects in underdoped compositions.
Disciplines
Condensed Matter Physics | Materials Science and Engineering
Authors
Makariy A. Tanatar; Yong Liu; J. Jaroszynski,; J. S. Brooks; Thomas A. Lograsso; and Ruslan Prozorov
PHYSICAL REVIEW B96, 184511 (2017)
Doping evolution of the anisotropic upper critical fields in the iron-based superconductor
Ba
1−xK
xFe
2As
2M. A. Tanatar,1,2Yong Liu,1J. Jaroszynski,3J. S. Brooks,3,*T. A. Lograsso,1,4and R. Prozorov1,2 1Ames Laboratory, U.S. DOE, Ames, Iowa 50011, USA
2Department of Physics and Astronomy, Iowa State University, Ames, Iowa 50011, USA
3National High Magnetic Field Laboratory, Florida State University, Tallahassee, Florida 32310, USA
4Department of Materials Science and Engineering, Iowa State University, Ames, Iowa 50011, USA
(Received 21 August 2017; revised manuscript received 19 October 2017; published 14 November 2017) In-plane resistivity measurements as a function of temperature and magnetic field up to 35 T with precise orientation within the crystallographicac plane were used to study the upper critical field Hc2 of the
hole-doped iron-based superconductor Ba1−xKxFe2As2. Compositions of the samples studied spanned from
under-dopedx=0.17 (Tc=12 K) andx=0.22 (Tc=20 K), both in the coexistence range of stripe magnetism and
superconductivity, through optimal dopingx=0.39 (Tc=38.4 K) andx=0.47 (Tc=37.2 K), to overdoped x=0.65 (Tc=22 K) and x=0.83 (Tc=10 K). We find notable doping asymmetry of the shapes of the
anisotropicHc2(T), suggesting the important role of paramagnetic limiting effects in theH aconfiguration in
overdoped compositions and multiband effects in underdoped compositions. DOI:10.1103/PhysRevB.96.184511
I. INTRODUCTION
Distinctive features of the iron-based high-transition-temperature, Tc, superconductors [1] are very high values
of the upper critical fieldsHc2 [2] and their low anisotropy with respect to the Fe-As layer (tetragonal or orthorhombic ab plane), γH =Hcab2/H
c
c2 [3–6]. Anisotropy of the upper critical field in the orbital limiting scenario [7] is determined by the anisotropy of the Fermi velocity and thus is linked with resistivity anisotropyγρ≡ρc/ρawithγρ≈γH2 atTc[8,9]. In
uniaxial (tetragonal and hexagonal) crystals, the dependence of the orbitalHc2on angleθwith respect to theabplane can be written as
Hc2(θ)=
Hab c2
γ2
H−1
sin2θ+1
. (1)
Notable deviations from this angular dependence were found in electron overdoped Ba(Fe1−xNix)2As2and discussed in the multiband scenario [10]. Deviations can be particularly pronounced when magnetic field is aligned parallel to the conducting plane, so that orbital upper critical fields can be-come higher than paramagnetic limit [11]. Crossover between the orbital and paramagnetic limiting mechanisms leads to a difference in the shape of theHc2(T) line, which was noted in KFe2As2 [9,12] and nearby hole-overdoped Ba1−xKxFe2As2
compositions [13,14]. The importance of the paramagnetic limiting effects was also suggested by the observation of the first-order transition at theHab
c2(T) line at low temperatures in the thermal expansion and magnetostriction measurements in KFe2As2 [15], small angle neutron scattering [16] and anomalous hysteresis in field-sweep resistivity measurements [13]. Since close toTc Hc2 is always determined by orbital mechanism, one needs to study low temperatures regime where superconducting gap is fully developed. Thus far low-temperature measurements in the underdoped Ba1−xKxFe2As2
*Deceased.
compositions have been performed only in theH c config-uration [17]. To the best of our knowledge there have been no studies of the anisotropy ofHc2in the conducting plane of any of the iron-based superconductors, which is usually neglected as being small compared toac-plane anisotropy, in line with experimental studies in some compounds [18–20].
In hole-doped materials Ba1−xKxFe2As2 the slope of the
Hc
c2(T) curves close to zero-fieldTcover a broad composition
range, 0.22x1, scales well with Tc, while the γH
anisotropy somewhat increases forx >0.83 close tox =1 [9,21]. Interestingly, this is the composition range where the superconducting gap also becomes nodal [22–28]. In the end hole-doped composition KFe2As2, the upper critical field Hc
c2 strongly changes upon pressure-induced transition [29] between two different superconducting states [30–32]. It was argued that the transformation is consistent with the transfor-mation of the superconducting gap structure, namely, devel-opment of horizontal nodes in the superconducting gap [29].
The dependence of the upper critical field on the supercon-ducting gap structure, on proximity to magnetism, and on the topology of the Fermi surface makes doping evolution of the upper critical field in hole-doped Ba1−xKxFe2As2 nontrivial.
The superconducting state of Ba1−xKxFe2As2(see the doping
phase diagram in the bottom panel of Fig.1) has ranges of coexistence with two different types of magnetism (stripe anti-ferromagneticC2phase [33] and tetragonal antiferromagnetic C4phase [34–36]). The anisotropy of the superconducting gap notably increases in theC2AF-superconductivity coexistence range [17,37], similar to overdoped compositions. In addition Fermi surface topology changes atx ∼0.5 [38,39] andx ∼ 0.7–0.8 [40], with the latter also being accompanied by the superconducting gap anisotropy change [26,28].
In this paper we report a comparative study of the precision-alignment anisotropicHc2(T) for underdoped and overdoped compositions of hole-doped Ba1−xKxFe2As2using dc magnetic field up to 35 T in the National High Magnetic Field Laboratory in Tallahassee. The compositions were selected with close values ofTcin the 10 K range (x=0.17,
Tc=12 K and x=0.83, Tc=10 K), in the 20 K range
M. A. TANATARet al. PHYSICAL REVIEW B96, 184511 (2017)
10 20 30 40
0 20 40
0.39 0.83
0.65 0.47
0.22
ρ
(
μΩ
cm)
T
(K)
0.17
0.0 0.2 0.4 0.6 0.8 1.0
0 20 40
SC+AF
x in Ba1-xKxFe2As2
C2AF
T
c(K)
[image:4.608.75.269.64.362.2]SC C4AF
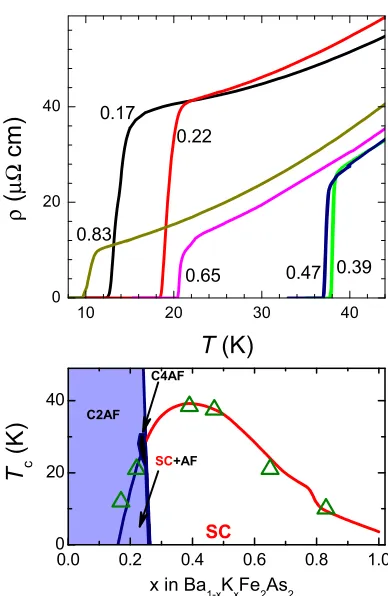
FIG. 1. Top: Temperature-dependent electrical resistivity of se-lected representative samples of Ba1−xKxFe2As2 with x=0.17,
0.22, 0.39, 0.47, 0.65, and 0.83. Compositions were chosen to have
Tc of about 10 K on the overdoped (x=0.83) and underdoped
(x=0.17) sides, 20 K (x=0.65 and 0.22), and above 35 K (x=0.39 and 0.47). Bottom: Doping phase diagram with the position of the samples studied. C2AF corresponds to a range of the stripe antiferromagnet phase, C4AF corresponds to a range of the tetragonal
C4 antiferromagnetic phase, C4PM corresponds to the tetragonal
paramagnetic state, and SC is the domain of the superconductivity, including ranges of coexistence with C2AF and C4AF phases (SC+AF).
(x =0.22,Tc=20 K and x=0.65,Tc=22 K), and in the
38 K range close to optimal doping (x =0.39,Tc=38.4 K
andx =0.47,Tc=37.2 K). The wholeH−T phase diagram
could be explored in the 10 K class samples, a large part of it could be explored in the 20 K class samples, and only a small range could be explored in the optimally doped samples. Our main findings are a clear tendency for paramagnetic limiting effects on the overdoped side of the phase diagram and a notable difference in the shape ofHcab2(T) lines in samples of similarTcin the overdoped and underdoped ranges.
II. EXPERIMENT
Single crystals of Ba1−xKxFe2As2 were grown using
the self-flux method [21,41]. Samples used for four-probe electrical resistivity measurements were cleaved from the inner parts of large single crystals (with a surface area up to 1 cm2 and 0.3 mm thickness) and had dimensions of typically (2–3)×0.5×0.1 mm3, with the longer side along the [100] tetragonal direction. Silver wires were soldered using Sn to the
fresh-cleaved surface of the samples [42,43] to make electrical contacts with several microOhm resistance. Sample resistivity at room temperature, ρ(300 K), was doping independent within statistical error bars of geometric factor determination, ±10%. For all samples it was set to an average value as determined on a big array of crystals,ρ(300 K)=300μcm, [8]. Temperature-dependent electrical resistivity ρ(T) mea-surements were performed down to 1.8 K in aQuantum Design physical property measurement system (PPMS) for sample screening. Measurements were performed in zero magnetic field. The sharpness of the zero-field resistive transition was used as a criterion for sample selection. The composition of the selected samples was determined using electron probe microanalysis with wavelength dispersive spectroscopy. In Fig. 1 we show the low-temperature part of temperature-dependent resistivity of selected samples. Their positions on the doping phase diagram are indicated with triangles in the bottom panel of Fig.1.
Selected samples were glued with GE varnish to a plastic platform, fitting the single-axis rotator of the 35-T dc magnet in the National High Magnetic Field Laboratory. Sample resistance was checked after mounting and was found to be identical to the initial value. The sample’s long axis (current direction) was aligned by eye parallel to the rotation axis (with accuracy of about 5◦). High-field measurements were made in a He cryostat with a variable-temperature control insert allowing for temperatures down to 1.5 K. The stepping-motor-driven rotator enabledin siturotation with∼0.1◦resolution around a horizontal axis in a single-axis rotation system of vertical 35-T magnetic field. In an ideal case of perfect parallel alignment of sample and rotation axes, during this rotation the direction of the magnetic field with respect to the crystal traverses in the tetragonal (100) plane (acplane), always remaining perpen-dicular to the current. However, the field-rotation plane may be somewhat inclined from the (100) plane due to potential misalignment of sample and rotator axes (see [10] for details). This misalignment does not affect precision alignment in the Habplane configuration (θ =0), which was achieved by measuring angle-dependent resistivity in a field slightly below the end of the resistive transition in field close to parallel to the plane configuration (see the inset in the top left panel of Fig.2).
III. RESULTS
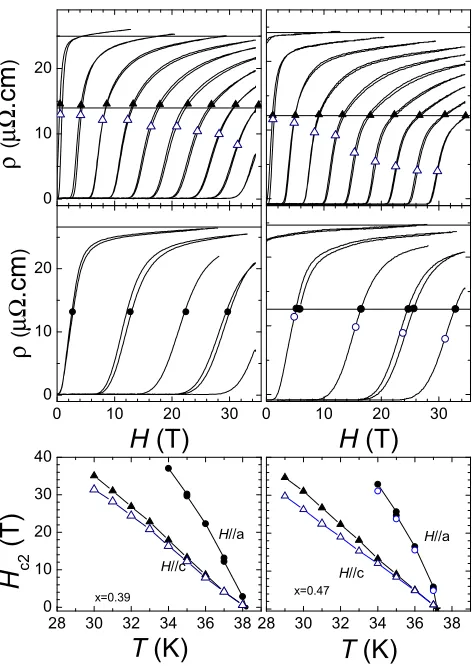
In Fig.2we show isothermal magnetic-field sweep resistiv-ity dataρ(H) taken at different temperatures in magnetic fields aligned along thec axis (θ=90◦, top panel) and precisely along the conducting plane (θ=0◦, middle panel) for the underdoped composition of Ba1−xKxFe2As2 with x =0.17
(left column of panels). The inset in the top left panel shows angle-dependent resistivity in magnetic field slightly below Hca2used for field alignment parallel to the conducting plane. The bottom left panel summarizesH−T phase diagrams as determined using the transition midpoint criterion (symbols in top and middle panels). The use of this criterion is justified by the small variation of the resistive transition width on application of magnetic field and its independence of the extrapolation, a typical problem for onset and offset criteria. The low value ofTc=12 K in the sample enables complete
suppression of superconductivity at the base temperature in
DOPING EVOLUTION OF THE ANISOTROPIC UPPER . . . PHYSICAL REVIEW B96, 184511 (2017)
FIG. 2. Left: Magnetic-field-dependent resistivity of underdoped sample Ba1−xKxFe2As2,x=0.17, taken in isothermal conditions in
magnetic fields oriented along the tetragonalcaxis (H c, top panel, temperatures: 16, 14, 12, 10, 8, 7, 6, 5, 4, 3, and 2 K, from left to right) and perpendicular to it (H a, middle panel, temperatures, from left to right: 15, 13, 11, 9, 8, 7, 6, 5, 4, 3, 2, and 1.8 K). The bottom panel showsH−T phase diagrams for two field orientations determined using the midpoint criterion between up- and down-field sweeps. The inset in the top panel shows the sample alignment procedure. Resistivity measurements were taken in fieldH slightly lower thanHa
c2, in which sample resistance shows strong angular
dependence. The curve was measured in the one-direction motion of the rotator to avoid backlash, with the deep minimum corresponding toH ab. Right: Magnetic-field-dependent resistivity of underdoped sample Ba1−xKxFe2As2,x=0.22, taken in isothermal conditions in
magnetic fields oriented along the tetragonalcaxis (H c, top panel, temperatures: 16, 14, 12, 10, 8, 7, and 6 K, from left to right) and perpendicular to it (H a, middle panel, temperatures, from left to right: 20, 18, 17, 16, 15, 14, 13, and 11 K). The bottom panel shows
H−Tphase diagrams for two field orientations determined using the midpoint criterion between up- and down-field sweeps.
theH cconfiguration and essential suppression in theH a configuration. The data in the H c configuration are in reasonable agreement with previous measurements in a smaller field-temperature range [17], finding nearlyT-linearHc
c2(T) with small up-ward curvature without any sign of saturation on T →0, contrary to Werthamer-Helfand-Hohenberg (WHH) theory expectations [7]. A clear down-ward curvature with the tendency for saturation is found in theHa
c2(T) curve.
FIG. 3. Left: Magnetic-field-dependent resistivity of sample Ba1−xKxFe2As2,x=0.39, taken in isothermal conditions in
mag-netic fields oriented along the tetragonalcaxis (Hc, top panel, temperatures: 38, 37, 36, 35, 34, 33, 32, 31, 30, and 29 K left to right), and perpendicular to it (H a, middle panel, temperatures, from left to right: 38, 37, 36, 35, and 34 K). The bottom panel shows
H−T phase diagrams for two field orientations determined using the midpoint criterion between up- and down-field sweeps (open sym-bols) and constant resistance criterion (line and solid symsym-bols). Right: Magnetic-field-dependent resistivity of sample Ba1−xKxFe2As2,x=
0.47, taken in isothermal conditions in magnetic fields oriented along the tetragonalcaxis (H c, top panel, temperatures: 38, 37, 36, 35, 34, 33, 32, 31, 30, and 29 K, from left to right) and perpendicular to it (H a, middle panel, temperatures, from left to right: 38, 37, 36, 35, and 34 K). The bottom panel showsH−T phase diagrams for two field orientations determined using the midpoint criterion between up- and down-field sweeps (open symbols) and constant resistance criterion (lines and solid symbols).
In the top and middle panels of the right column in Fig.2we show raw resistivity field-sweep data in a sample withx=0.22; the phase diagram is presented in the bottom panel. Magnetic field of 35 THcis sufficient to suppress superconductivity down toT =6 K (T /Tc≈0.3), while in
Ha superconductivity can be suppressed only down to 10 K (T /Tc≈0.5). Despite a limited range of magnetic
field, the temperature-dependent anisotropicHc2(T) reveal the
same trend as found in the x=0.17 sample, with close to linear dependence and small up-ward curvatue inHcand a tendency for saturation inH a.
[image:5.608.55.295.69.398.2]M. A. TANATARet al. PHYSICAL REVIEW B96, 184511 (2017)
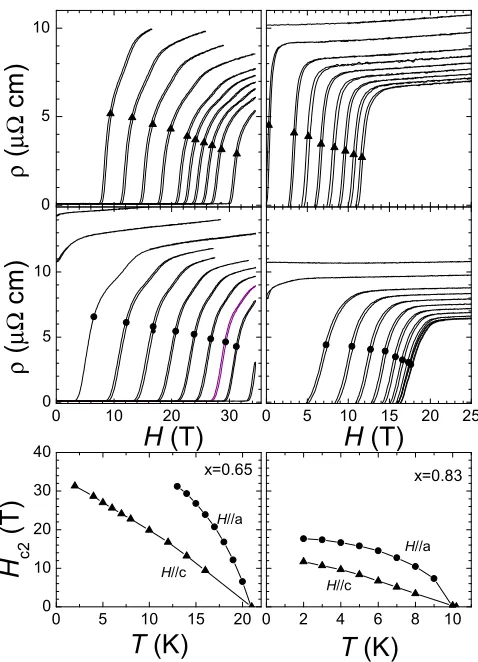
FIG. 4. Left: Magnetic-field-dependent resistivity of sample Ba1−xKxFe2As2,x=0.65, taken in isothermal conditions in
mag-netic fields oriented along the tetragonalcaxis (H c, top panel, temperatures: 16, 14, 12, 10, 8, 7, 6, 5, 4, and 2 K, from left to right) and parallel to the plane (H a, middle panel, temperatures, from left to right: 24, 22, 20, 19, 18, 17, 16, 15, 14, 13, and 11 K). The bottom panel showsH−T phase diagrams for two field orientations determined using the midpoint criterion between up-and down-field sweeps. Right: Magnetic-field-dependent resistivity of sample Ba1−xKxFe2As2 x=0.83 taken in isothermal conditions
in magnetic fields oriented along the tetragonalc axis (H c, top panel, temperatures: 12, 10, 8, 6, 5, 4, 3, and 2 K, from left to right) and perpendicular to it (H a, middle panel, temperatures, from left to right: 11, 9, 8, 7, 6, 5, 4, 3, and 2 K). The bottom panel shows
H−Tphase diagrams for two field orientations determined using the midpoint criterion between up- and down-field sweeps.
In Fig.3we show raw resistivity data (top panels inH c configurations and middle panels inHaconfigurations) and H−T phase diagrams (bottom panels) in samples close to optimal doping, x=0.39 (left column) andx =0.47 (right column). A very narrow part of the phase diagram can be explored with a 35-T magnetic field; however, even in this limited range the difference between close to T-linear Hc
c2 and down-curvingHa
c2is visible. Note the strong variation of the normal-state resistivity with temperature in both samples, which makes determination ofHc2 using the same resistivity criterion impossible. The transition midpoint is also an ill-defined criterion for the sample because of rounding ofρ(H)
0 4 8 12
0 10 20 30 40
0 5 10 15 20 30 32 34 36 38
H c2
(T
)
[image:6.608.316.561.71.216.2]T (K) T (K) T (K)
FIG. 5. Left: Comparison of theH−T phase diagrams of a 10 K pair of underdoped (x=0.17) and overdoped (x=0.83) samples. Middle: A similar comparison for a 20 K pair of underdoped (x=0.22) and overdoped (x=0.65) samples. Right: Data for samples close to optimum doping,x=0.39 andx=0.47. Note the clear tendency to saturation in both overdoped compositions for the magnetic-field configurationH a.
curves in the normal state, presumably due to filamentary superconductivity in the normal state.
In Fig. 4 we show resistivity vs field curves in H c (top panels) and H a (middle panels) configurations for overdoped samplesx =0.65 (left column) andx=0.83 (right column). A smaller value ofTcenables characterization of the
whole phase diagram for the 10 K class samplex=0.83. Note the decrease of the normal-state resistivity on cooling in both compositions, the tendency forHc
c2(T) saturation on cooling, and the pronounced tendency for saturation at temperatures close to zero-fieldTcin theH aconfiguration.
Experimental summary
In Fig.5we make a direct comparison of theH−T phase diagrams of 10 K class samples (underdopedx =0.17 and overdopedx =0.83; left panel), 20 K class samples (under-dopedx =0.22 and overdopedx=0.65; middle panel), and optimally doped 38 K samples (x=0.39 andx =0.47; right panel). This comparison highlights the difference between two doping regimes.Hc
c2(T) shows a small upward curvature in underdoped compositions, somewhat reminiscent of the dependence in layered superconductors [44] and in multiband superconductors [45]. A slight tendency for saturation of Hcc2(T) may be found in overdoped compositions. A tendency for Hc2(T) saturation for orbital limiting is expected to
become visible below T /Tc<0.3 [7] (see Fig. 7 below).
Deviation from this prediction in iron-based superconductors was discussed in the multiband scenario [10,45]. Indeed, heat-capacity [46] and London penetration-depth studies [28] suggest pronounced multiband effects, with the gap magnitude on different sheets of the Fermi surface varying by a factor of approximately 2.
The dependence in the configuration with magnetic field parallel to the plane is even more intriguing. In Fig. 6 we compare the data for all compositions in precision-aligned Haconditions. Note the much more pronounced curvature ofHa
c2(T) close to zero-fieldTcin the overdoped compositions.
DOPING EVOLUTION OF THE ANISOTROPIC UPPER . . . PHYSICAL REVIEW B96, 184511 (2017)
0 10 20 30 40
0 10 20 30 40
0.39
0.47 0.65
0.22
0.83
H
c2(T)
T
(K)
[image:7.608.342.526.68.299.2]0.17
FIG. 6. Comparison of theH−Tphase diagrams in parallel mag-netic fieldHa
c2(T) for samples of Ba1−xKxFe2As2 for compositions
(from left to right) with x=0.83 (solid circles),x=0.17 (open circles),x=0.22 (open squares),x=0.65 (solid squares),x=0.39 (open triangles), andx=0.47 (solid triangles).
IV. DISCUSSION
There are two mechanisms that determine the upper critical field of superconductors. The first one, determined by the supercurrent flow to screen the magnetic field, is referred to as orbital limiting and described by WHH theory [7]. The upper critical field at theT →0 limitHc2(0) in WHH theory
is determined by the slope of theHc2(T) curve close toTc,
and asT goes to zero, the curve shows downward deviation from linear dependence and eventual saturation towards the value Hc2(0)≈0.7TcdHdTc2 in the isotropic case. In Fig. 7
we show the temperature-dependent Hc2(T) as expected in
WHH theory and the data for isotropic NbTi as a typical experimental observation.
Rather rare exceptions, when the upper critical field is not determined by the orbital limiting, are found in the materials in which the orbital motion of electrons is hampered by either a short mean free path, heavy mass of conduction electrons in heavy-fermion materials, or weak links between the con-ducting layers in Josephson structures or in naturally highly electronically anisotropic layered materials [47,48], provided that the magnetic field is aligned precisely parallel to the conducting layer. In this situation the upper critical fieldHc2 is determined by Zeeman splitting of electron levels, known as the Clogston-Chandrasekhar [11] paramagnetic limit. This field is determined by a decrease of paramagnetic energy, be-coming equal to the condensation energy of the superconduc-tor. In weak-coupling BCS superconductors the paramagnetic limiting field is determined in theT →0 limit asHp=1.8Tc,
where Hp is the field in Teslas and Tc is in Kelvins. Note,
however, that even in materials with dominant paramagnetic effects, the behavior of theHc2(T) line close to zero-fieldTcis
always determined by the orbital limiting mechanism, so that the slope ofHc2lines atTcreflects the anisotropy of the
elec-tronic structure. The width of the temperature range in which the orbital limiting mechanism is dominant depends on the ratio of orbital and paramagnetic limiting fields (the Maki
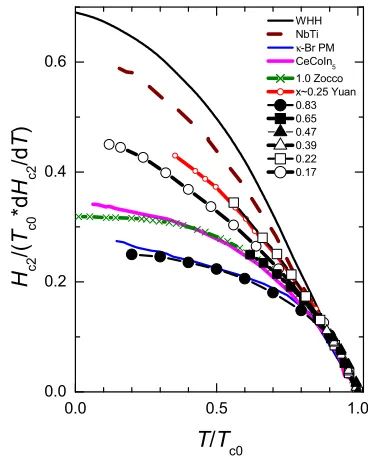
pa-FIG. 7. Comparison of the H−T phase diagrams of Ba1−xKxFe2As2 in magnetic field precisely parallel to the plane Ha
c2(T) using normalized temperature, T /Tc0, and magnetic-field, H /[Tc0dHc2(T)/dT], scales. For reference we show expectations
for the orbital limiting mechanism in WHH theory [7] (black solid line), the experimentally determined Hc2 line for the
con-ventional isotropic superconductor NbTi with dominant orbital limiting (dashed brown line), the layered organic superconductor
κ-(BEDT-TTF)2Cu[N(CN)2]Br (κ-Br) in magnetic field parallel to
the conducting plane in which paramagnetic limiting starts in the close vicinity ofTc [50] (blue line), and paramagnetically limited
CeCoIn5[51] (magenta line). We also plot data for KFe2As2as
deter-mined from magnetostriction and thermal expansion measurements in x=1 by Zocco et al. [15] (green crosses and line) and from resistivity measurements in pulsed field for a sample withTc≈28 K
corresponding roughly tox=0.25 from Yuanet al.(red line with open circles) [5]. Solid symbols represent overdoped compositions withx=0.83 (circles),x=0.65 (squares), andx=0.47 (triangles). Open symbols are used for underdoped compositions withx=0.17 (circles) andx=0.22 (squares) and for optimally dopedx=0.39 (triangles).
rameter) [49]. In strongly anisotropic materials, like organicκ -(BEDT-TTF)2Cu[N(CN)2] Br (Tc=12.8 K,γρ∼104), where
BEDT-TTF stands for bis(ethylenedithio)tetrathiafulvalene, this range is confined to the close vicinity of Tc [50], and
the experimentally determinedHc2(T) curve makes a good
experimental example for the shape of the upper critical field in paramagnetically limited superconductors [47]. This dependence is shown in Fig.7with the blue line. For all the curves in the figure the slope of lines nearTcwas adjusted to
match orbital limiting expectations.
In Fig. 7 we plot the data for the 10 and 20 K class samples of Ba1−xKxFe2As2 in the H a configuration in
comparison with curves for the orbital and paramagnetic limiting cases. Note that the curve forx =0.83 closely follows expectations for paramagnetic limiting, with a negligible orbital contribution. Interestingly, even the value of the upper critical field for this sample is close to expectations for a weak-coupling superconductor,Hp=1.8×10=18 T (see Fig.6).
[image:7.608.52.292.70.253.2]M. A. TANATARet al. PHYSICAL REVIEW B96, 184511 (2017)
The curve for the other overdoped composition, x =0.65, still is very close to expectations for paramagnetic limiting and closely follows experimental data for CeCoIn5(magenta line), a strongly paramagnetically limited superconductor [51]. The curves for optimally doped samples withx=0.39 (open triangles in Fig.7) andx=0.47 (solid triangles) are defined in a too narrow range to distinguish clearly between orbital and paramagnetic limits. The data for underdoped compositions with x =0.17 (open circles) and x =0.22 (open squares) are close to orbital limiting. For reference we also plot the literature data for the sample withx=1 [15] and for the un-derdoped sample withTc≈28 K (x ∼0.25) [5]. The curve for
the latter sample is very close to the dependence forx=0.22 in our measurements; the curve forx=1 deviates somewhat more from the closest data forx=0.83 in our measurements, revealing a somewhat higher saturation value ofHa
c2.
The findings of our study are somewhat unexpected. Paramagnetic effects in Hc2(T) are usually found is quite anisotropic materials, like layered organicκ-(BEDT-TTF)2Cu N([CN)2]Br, withγρ∼103–104. The anisotropy of the
resis-tivity and upper critical fields near Tc in Ba1−xKxFe2As2 is
significantly lower [9]; in KFe2As2, for example, γH ∼5–7
[9,12,15] andγρ∼30 [24]. This observation might suggest
that increased effective masses, as found in heat-capacity [14,46,52,53] and transport [23,29] studies, push orbital upper critical fields up for both in-plane and out-of-plane field orientations, similar to the heavy-fermion materials. In a situation like this, asymmetry of the doping evolution ofHc2a may be a reflection of increasing effective mass, as reflected in the increasing electronic heat-capacity coefficientγN ≡Cel/T
on approaching the quantum critical point in the overdoped compositions, rather than electronic anisotropy [46,52]. This would suggest that theHa
c2/Tcratio should be increased on the
overdoped side, which is not the case.
On the other hand, the upper critical field in theH ab configuration in the underdoped compositions is intermediate between paramagnetic and orbital limiting, despite similar anisotropy values ofγH and significantly lower normal-state
electronic heat capacityγN [46]. Notable asymmetry may be
related to asymmetry found in the shape ofHcc2(T) with upward deviations from the linear dependence in the underdoped x =0.17 compared to downward deviations in overdoped x =0.83 and x=0.65. In the multiband scenario upward
deviation may suggest a notable increase in the effective gap magnitude inx =0.17 on cooling, which can lead to upward deviation even in the paramagnetic limiting regime. It is known that multiband effects are needed to account for heat capacity [46] and London penetration depth [28] for all compositions of Ba1−xKxFe2As2. Our observation may be suggestive of stronger multiband effects on the underdoped side.
Another possible source of asymmetry may be coexistence with long-range magnetic order in the compositionsx =0.17 andx=0.22 on the underdoped side of the phase diagram but not inx=0.65 andx =0.83 on the overdoped side. Long range magnetic order is known to affect the nodal structure of the superconducting gap, as suggested theoretically [54] and observed experimentally in London penetration-depth [37] and thermal-conductivity [17] measurements. To the best of our knowledge, the effect of the coexisting long range magnetic order on the upper critical fieldHc2has not been discussed for iron-based superconductors.
V. CONCLUSIONS
By performing a study of the anisotropic upper critical fields in the Ba1−xKxFe2As2 series of compounds for a
range of compositions spanning from underdoped (x =0.17) to overdoped (x=0.83) in precision-alignment magnetic-field-orientation conditions, we found a strong paramagnetic limiting of Hca2 in the overdoped compositions but not in the underdoped compositions. We speculate that much more pronounced multiband effects on the underdoped side may be responsible for the asymmetry, as suggested by the difference in the shapes ofHc
c2(T) dependences.
ACKNOWLEDGMENTS
We thank V. G. Kogan for critical reading of the manuscript and useful discussions. The experimental work was supported by the U.S. Department of Energy (DOE), Office of Basic Energy Sciences, Division of Materials Sciences and Engi-neering. The experimental research was performed at Ames Laboratory, which is operated for the U.S. DOE by Iowa State University under Contract No. DE-AC02-07CH11358. Work at the National High Magnetic Field Laboratory is supported by NSF Cooperative Agreement No. DMR 1157490 and by the state of Florida.
[1] K. Ishida, Y. Nakai, and H. Hosono,J. Phys. Soc. Jpn.78,062001
(2009).
[2] F. Hunte, J. Jaroszynski, A. Gurevich, D. C. Larbalestier, R. Jin, A. S. Sefat, M. A. McGuire, B. C. Sales, D. K. Christen, and D. Mandrus,Nature (London)453,903(2008).
[3] N. Ni, S. L. Bud’ko, A. Kreyssig, S. Nandi, G. E. Rustan, A. I. Goldman, S. Gupta, J. D. Corbett, A. Kracher, and P. C. Canfield,
Phys. Rev. B78,014507(2008).
[4] M. M. Altarawneh, K. Collar, C. H. Mielke, N. Ni, S. L. Bud’ko, and P. C. Canfield,Phys. Rev. B78,220505(R)(2008). [5] H. Q. Yuan, J. Singleton, F. F. Balakirev, S. A. Baily, G. F.
Chen, J. L. Luo, and N. L. Wang,Nature (London)457, 565
(2009).
[6] J.-L. Zhang, L. Jiao, Y. Chen, and H.-Q. Yuan,Front. Phys.6,
463(2011).
[7] N. R. Werthamer, E. Helfand, and P. C. Hohenberg,Phys. Rev. 147,295(1966).
[8] M. A. Tanatar, N. Ni, C. Martin, R. T. Gordon, H. Kim, V. G. Kogan, G. D. Samolyuk, S. L. Bud’ko, P. C. Canfield, and R. Prozorov,Phys. Rev. B79,094507(2009).
[9] Yong Liu, M. A. Tanatar, V. G. Kogan, Hyunsoo Kim, T. A. Lograsso, and R. Prozorov,Phys. Rev. B87,134513(2013). [10] J. Murphy, M. A. Tanatar, D. Graf, J. S. Brooks, S. L. Bud’ko,
P. C. Canfield, V. G. Kogan, and R. Prozorov,Phys. Rev. B87,
094505(2013).
[11] A. M. Clogston,Phys. Rev. Lett.9,266(1962); B. S. Chan-drasekhar,Appl. Phys. Lett.1,7(1962).
[12] T. Terashima, M. Kimata, H. Satsukawa, A. Harada, K. Hazama, S. Uji, H. Harima, G.-F. Chen, J. L. Luo, and N.-L. Wang,
DOPING EVOLUTION OF THE ANISOTROPIC UPPER . . . PHYSICAL REVIEW B96, 184511 (2017) [13] T. Terashima, K. Kihou, M. Tomita, S. Tsuchiya, N. Kikugawa,
S. Ishida, C.-H. Lee, A. Iyo, H. Eisaki, and S. Uji,Phys. Rev. B 87,184513(2013).
[14] S. Zhang, Y. P. Singh, X. Y. Huang, X. J. Chen, M. Dzero, and C. C. Almasan,Phys. Rev. B92,174524(2015).
[15] D. A. Zocco, K. Grube, F. Eilers, T. Wolf, and H. V. Löhneysen,
Phys. Rev. Lett.111,057007(2013).
[16] S. J. Kuhn, H. Kawano-Furukawa, E. Jellyman, R. Riyat, E. M. Forgan, M. Ono, K. Kihou, C. H. Lee, F. Hardy, P. Adelmann, Th. Wolf, C. Meingast, J. Gavilano, and M. R. Eskildsen,Phys. Rev. B93,104527(2016).
[17] J.-Ph. Reid, M. A. Tanatar, X. G. Luo, H. Shakeripour, S. R. de Cotret, A. Juneau-Fecteau, J. Chang, B. Shen, H.-H. Wen, H. Kim, R. Prozorov, N. Doiron-Leyraud, and L. Taillefer,Phys. Rev. B93,214519(2016).
[18] Z. Q. Mao, Y. Maeno, S. NishiZaki, T. Akima, and T. Ishiguro,
Phys. Rev. Lett.84,991(2000).
[19] M. A. Tanatar, T. Ishiguro, H. Tanaka, and H. Kobayashi,Phys. Rev. B66,134503(2002).
[20] F. Weickert, P. Gegenwart, H. Won, D. Parker, and K. Maki,
Phys. Rev. B74,134511(2006).
[21] Y. Liu, M. A. Tanatar, W. E. Straszheim, B. Jensen, K. W. Dennis, R. W. McCallum, V. G. Kogan, R. Prozorov, and T. A. Lograsso,Phys. Rev. B89,134504(2014).
[22] H. Fukazawa, Y. Yamada, K. Kondo, T. Saito, Y. Kohori, K. Kuga, Y. Matsumoto, S. Nakatsuji, H. Kito, P. M. Shirage, K. Kihou, N. Takeshita, C.-H. Lee, A. Iyo, and H. Eisaki,J. Phys. Soc. Jpn.78,083712(2009).
[23] J. K. Dong, S. Y. Zhou, T. Y. Guan, H. Zhang, Y. F. Dai, X. Qiu, X. F. Wang, Y. He, X. H. Chen, and S. Y. Li,Phys. Rev. Lett. 104,087005(2010).
[24] J.-Ph. Reid, M. A. Tanatar, A. Juneau-Fecteau, R. T. Gordon, S. R. de Cotret, N. Doiron-Leyraud, T. Saito, H. Fukazawa, Y. Kohori, K. Kihou, C. H. Lee, A. Iyo, H. Eisaki, R. Prozorov, and L. Taillefer,Phys. Rev. Lett.109,087001(2012).
[25] K. Okazaki, Y. Ota, Y. Kotani, W. Malaeb, Y. Ishida, T. Shimojima, T. Kiss, S. Watanabe, C.-T. Chen, K. Kihou, C. H. Lee, A. Iyo, H. Eisaki, T. Saito, H. Fukazawa, Y. Kohori, K. Hashimoto, T. Shibauchi, Y. Matsuda, H. Ikeda, H. Miyahara, R. Arita, A. Chainani, and S. Shin,Science337,1314(2012). [26] D. Watanabe, T. Yamashita, Y. Kawamoto, S. Kurata, Y.
Mizukami, T. Ohta, S. Kasahara, M. Yamashita, T. Saito, H. Fukazawa, Y. Kohori, S. Ishida, K. Kihou, C. H. Lee, A. Iyo, H. Eisaki, A. B. Vorontsov, T. Shibauchi, and Y. Matsuda,Phys. Rev. B89,115112(2014).
[27] X.-C. Hong, A.-F. Wang, Z. Zhang, J. Pan, L.-P. He, X.-G. Luo, X.-H. Chen, and S.-Y. Li,Chin. Phys. Lett.32,127403
(2015).
[28] K. Cho, M. Konczykowski, S. Teknowijoyo, M. A. Tanatar, Y. Liu, T. A. Lograsso, W. E. Straszheim, V. Mishra, S. Maiti, P. J. Hirschfeld, and R. Prozorov,Sci. Adv.2,e1600807(2016). [29] V. Taufour, N. Foroozani, M. A. Tanatar, J. Lim, U.
Kalu-arachchi, S. K. Kim, Y. Liu, T. A. Lograsso, V. G. Kogan, R. Prozorov, S. L. Bud’ko, J. S. Schilling, and P. C. Canfield,Phys. Rev. B89,220509(R)(2014).
[30] F. F. Tafti, A. Juneau-Fecteau, M.-È. Delage, S. R. de Cotrét, J.-P. Reid, A. F. Wang, X.-G. Luo, X. H. Chen, N. Doiron-Leyraud, and L. Taillefer,Nat. Phys.9,349(2013).
[31] F. F. Tafti, J. P. Clancy, M. Lapointe-Major, C. Collignon, S. Faucher, J. A. Sears, A. Juneau-Fecteau, N. Doiron-Leyraud,
A. F. Wang, X.-G. Luo, X. H. Chen, S. Desgreniers, Y.-J. Kim, and L. Taillefer,Phys. Rev. B89,134502(2014).
[32] T. Terashima, K. Kihou, K. Sugii, N. Kikugawa, T. Matsumoto, S. Ishida, C.-H. Lee, A. Iyo, H. Eisaki, and S. Uji,Phys. Rev. B 89,134520(2014).
[33] M. Rotter, M. Tegel, and D. Johrendt,Phys. Rev. Lett. 101,
107006(2008).
[34] E. Hassinger, G. Gredat, F. Valade, S. R. de Cotret, A. Juneau-Fecteau, J.-Ph. Reid, H. Kim, M. A. Tanatar, R. Prozorov, B. Shen, H.-H. Wen, N. Doiron-Leyraud, and L. Taillefer,Phys. Rev. B86,140502(R)(2012).
[35] A. E. Böhmer, F. Hardy, L. Wang, T. Wolf, P. Schweiss, and C. Meingast,Nat. Commun.6,7911(2015).
[36] J. M. Allred, S. Avci, D. Y. Chung, H. Claus, D. D. Khalyavin, P. Manuel, K. M. Taddei, M. G. Kanatzidis, S. Rosenkranz, R. Osborn, and O. Chmaissem,Phys. Rev. B92,094515(2015). [37] H. Kim, M. A. Tanatar, W. E. Straszheim, K. Cho, J. Murphy,
N. Spyrison, J.-Ph. Reid, B. Shen, H.-H. Wen, R. M. Fernandes, and R. Prozorov,Phys. Rev. B90,014517(2014).
[38] J.-P. Castellan, S. Rosenkranz, E. A. Goremychkin, D. Y. Chung, I. S. Todorov, M. G. Kanatzidis, I. Eremin, J. Knolle, A. V. Chubukov, S. Maiti, M. R. Norman, F. Weber, H. Claus, T. Guidi, R. I. Bewley, and R. Osborn,Phys. Rev. Lett.107,177003
(2011).
[39] H. Hodovanets, Y. Liu, A. Jesche, S. Ran, E. D. Mun, T. A. Lograsso, S. L. Bud’ko, and P. C. Canfield,Phys. Rev. B89,
224517(2014).
[40] P. Richard, T. Sato, K. Nakayama, T. Takahashi, and H. Ding,
Rep. Progr. Phys.74,124512(2011).
[41] K. Kihou, T. Saito, S. Ishida, M. Nakajima, Y. Tomioka, H. Fukazawa, Y. Kohori, T. Ito, S.-I. Uchida, A. Iyo, C.-H. Lee, and H. Eisaki,J. Phys. Soc. Jpn.79,124713(2010).
[42] M. A. Tanatar, N. Ni, S. L. Bud’ko, P. C. Canfield, and R. Prozorov,Supercond. Sci. Technol.23,054002(2010). [43] M. A. Tanatar, R. Prozorov, N. Ni, S. L. Bud’ko, and P. C.
Canfield, U.S. Patent No. 8,450,246 (1 September 2011). [44] A. P. Mackenzie, S. R. Julian, G. G. Lonzarich, A. Carrington,
S. D. Hughes, R. S. Liu, and D. C. Sinclair,Phys. Rev. Lett.71,
1238(1993).
[45] V. G. Kogan and R. Prozorov,Rep. Progr. Phys. 75, 114502
(2012).
[46] F. Hardy, A. E. Böhmer, L. de’ Medici, M. Capone, G. Giovannetti, R. Eder, L. Wang, M. He, T. Wolf, P. Schweiss, R. Heid, A. Herbig, P. Adelmann, R. A. Fisher, and C. Meingast,
Phys. Rev. B94,205113(2016).
[47] See T. Ishiguro, J. Phys. IV10, 139 (2000), for a review of the experimental data.
[48] A. Gurevich,Rep. Progr. Phys.74,124501(2011). [49] K. Maki,Phys. Rev.148,362(1966).
[50] A. E. Kovalev, T. Ishiguro, T. Kondo, and G. Saito,Phys. Rev. B62,103(2000).
[51] A. Bianchi, R. Movshovich, C. Capan, P. G. Pagliuso, and J. L. Sarrao,Phys. Rev. Lett.91,187004(2003).
[52] F. Eilers, K. Grube, D. A. Zocco, T. Wolf, M. Merz, P. Schweiss, R. Heid, R. Eder, R. Yu, J.-X. Zhu, Q. Si, T. Shibauchi, and H. v. Löhneysen,Phys. Rev. Lett.116,237003(2016).
[53] J. S. Kim, G. R. Stewart, Yong Liu, and T. A. Lograsso,Phys. Rev. B91,214506(2015).
[54] S. Maiti, R. M. Fernandes, and A. V. Chubukov,Phys. Rev. B 85,144527(2012).