Biogeosciences, 10, 4465–4479, 2013 www.biogeosciences.net/10/4465/2013/ doi:10.5194/bg-10-4465-2013
© Author(s) 2013. CC Attribution 3.0 License.
EGU Journal Logos (RGB)
Advances in
Geosciences
Open Access
Natural Hazards
and Earth System
Sciences
Open Access
Annales
Geophysicae
Open Access
Nonlinear Processes
in Geophysics
Open Access
Atmospheric
Chemistry
and Physics
Open Access
Atmospheric
Chemistry
and Physics
Open Access
Discussions
Atmospheric
Measurement
Techniques
Open Access
Atmospheric
Measurement
Techniques
Open Access
Discussions
Biogeosciences
Open Access Open Access
Biogeosciences
DiscussionsClimate
of the Past
Open Access Open Access
Climate
of the Past
Discussions
Earth System
Dynamics
Open Access Open Access
Earth System
Dynamics
Discussions
Geoscientific
Instrumentation
Methods and
Data Systems
Open Access
Geoscientific
Instrumentation
Methods and
Data Systems
Open Access
Discussions
Geoscientific
Model Development
Open Access Open Access
Geoscientific
Model Development
Discussions
Hydrology and
Earth System
Sciences
Open Access
Hydrology and
Earth System
Sciences
Open Access
Discussions
Ocean Science
Open Access Open Access
Ocean Science
Discussions
Solid Earth
Open Access Open Access
Solid Earth
DiscussionsThe Cryosphere
Open Access Open Access
The Cryosphere
Discussions
Natural Hazards
and Earth System
Sciences
Open Access
Discussions
Seasonal dynamics of methane emissions from a subarctic fen in the
Hudson Bay Lowlands
K. L. Hanis1, M. Tenuta1, B. D. Amiro1, and T. N. Papakyriakou2
1Department Soil Science, University of Manitoba, Winnipeg, Manitoba, Canada
2Department Environment and Geography, University of Manitoba, Winnipeg Manitoba, Canada
Correspondence to: M. Tenuta (mario.tenuta@ad.umanitoba.ca)
Received: 15 February 2013 – Published in Biogeosciences Discuss.: 8 March 2013 Revised: 31 May 2013 – Accepted: 3 June 2013 – Published: 3 July 2013
Abstract. Ecosystem-scale methane (CH4)flux (FCH4)over
a subarctic fen at Churchill, Manitoba, Canada was mea-sured to understand the magnitude of emissions during spring and fall shoulder seasons, and the growing season in rela-tion to physical and biological condirela-tions. FCH4 was mea-sured using eddy covariance with a closed-path analyser in four years (2008–2011). Cumulative measured annual FCH4 (shoulder plus growing seasons) ranged from 3.0 to 9.6 g CH4m−2yr−1among the four study years, with a mean
of 6.5 to 7.1 g CH4m−2yr−1 depending upon gap-filling
method. Soil temperatures to depths of 50 cm and air tem-perature were highly correlated withFCH4, with near-surface soil temperature at 5 cm most correlated across spring, fall, and the shoulder and growing seasons. The response ofFCH4 to soil temperature at the 5 cm depth and air temperature was more than double in spring to that of fall. Emission episodes were generally not observed during spring thaw. Growing season emissions also depended upon soil and air tempera-tures but the water table also exerted influence, withFCH4 highest when water was 2–13 cm below and lowest when it was at or above the mean peat surface.
1 Introduction
Organic soils (peatlands) have the highest mean soil organic carbon contents of any permafrost-affected soil in the north-ern circumpolar permafrost region with global inventories of 94 to 184 Pg carbon in the top 3 m (Tarnocai et al., 2009). Terrestrial regions of the Arctic, including peatlands, are es-timated to have sequestered between 300 and 600 Tg C yr−1 since 1975 (McGuire et al., 2009). However, the radiative
forcing benefit of a carbon dioxide (CO2)sink is partially
offset by the emission of 30 to 100 Tg yr−1methane (CH4)
from the terrestrial arctic (McGuire et al., 2009), of which 2.3 Tg CH4yr−1are emitted from the Hudson Bay Lowlands
in Canada (Pickett-Heaps et al., 2011). This is important be-cause CH4has a radiative forcing of about 33 times that of
CO2over 100 yr when including the direct and indirect
radia-tive effects of aerosol responses (Shindell et al., 2009), and 25 times that of CO2directly (Forster et al., 2007).
Previous studies of CH4fluxes (FCH4)from northern peat-lands have focussed on the period of peak productivity of vegetation (mid-summer) (e.g. Verville et al., 1998; Upde-graff et al., 2001; Grondahl et al., 2008) and examined the ef-fects of water table height (e.g. Turetsky et al., 2008; Long et al., 2009; Zona et al., 2009), temperature (e.g. Verville et al., 1998; Wille et al., 2008; Long et al., 2009), and plant com-munities, in particular, hydrophytes with aerenchyma tissues for plant-mediated transport of rhizosphere gases to the at-mosphere (e.g. Schimel, 1995; Long et al., 2009) on emis-sions. It has been found that photosynthetically active radia-tion and net ecosystem exchange of CO2can be used to
en-compass the effect of light intensity on plant photosynthetic activity and transpiration as well as plant mediated trans-port fluxes of rhizosphere gases such as CH4 (Joabsson et
Recent attention has focused on CH4emission bursts
dur-ing the sprdur-ing and fall seasons from northern peatlands. Tokida et al. (2007) described episodic release of CH4from
bubbles in ice overlying an ombrotrophic bog in Japan dur-ing sprdur-ing melt, and Hargreaves et al. (2001) reported sprdur-ing- spring-melt FCH4 bursts from a Finnish minerotrophic flark fen dominated by graminoids. Fall freeze-upFCH4 bursts have also been reported to occur during freeze–thaw cycles in the same Finnish flark fen (Hargreaves et al., 2001) and in a graminoid fen in Greenland underlain by permafrost (Mas-tepanov et al., 2008).
Emission bursts could contribute substantially to annual FCH4,but they are ephemeral and spatially variable, and the drivers are still not clearly understood. More research is needed at northern circumpolar peatlands during the shoul-der seasons of spring melt and fall freeze-up to focus on un-derstanding the trends and magnitude ofFCH4and the associ-ated drivers of emissions over different spatial and temporal scales.
The objectives of this study were to determine ecosystem scale FCH4 from an eutrophic subarctic fen to understand (a) the magnitude of emissions during spring-melt and fall-freeze-up periods relative to the growing season, and (b) the environmental conditions contributing to emissions. We hy-pothesized thatFCH4 is a well-behaved function of temper-ature given favourable water table conditions in peatlands. We tested this through campaign measurements of whole-ecosystemFCH4 using an eddy-covariance (EC) flux tower during spring and fall campaigns and for four growing sea-sons from 2008 to 2011.
2 Methods
2.1 Site description
The study site is a eutrophic palsa fen (fen) (NWWG, 1997) near Churchill, Manitoba, Canada (58◦3905700N, 93◦4904800W). It is situated within the boreal forest–tundra ecotone, which is a transitional zone extending approxi-mately 10 km inland from the Hudson Bay coastline, and within the zone of continuous permafrost (Brown, 1970). The fen hosts three dominant landscape units: hummocks, sedge lawns, and hollows. The hummocks and sedge lawns have 30 to 40 cm of peat over carbonate-rich glaciomarine sediments (Rouse et al., 2002). The active layer can extend to more than 1.5 m in depth.
The sedge-lawn landscape unit is the most extensive, cov-ering approximately 55 % of the fen (Raddatz et al., 2009) and is dominated by the sedge Carex aquatilis Wahlenb., as well as other Carex spp., the grasses Eriophorum spp.,
Cala-magrostis spp., and Arctagrostis latifolia (R. Br.) Griseb.,
rushes Juncus spp., horsetail Equisetum variegatum Schle-ich. ex F. Weber & D. Mohr, and an understory of the moss,
Pseudocalliergon turgescens (Jensen) Loeske. The
sedge-lawn landscape unit is at the mean water table–peat surface interface at an elevation of 16.56±0.4 m (SD (standard de-viation),n=29 sample points) with the P. turgescens being submersed during periods of a high water table (often June, September and October), and exposed during periods of a low water table (often July and August). C. aquatilis is the principal vascular plant at the fen and can facilitate CH4
transport to the atmosphere (Schimel, 1995). New shoots emerge from mid- to late June; flowering occurs in mid-July and senescence begins in late August.
The vegetation of hummocks is dominated by the lichens
Cladina stellaris (Opiz) Brodo and Cladonia rangiferina
(L.) Nyl., the moss Dicranum elongatum Schwaegr., as well as heath vegetation Betula glandulosa Michx., Salix
arc-tophila Cock. ex Heller, Rhododendron tomentosum
Har-maja, Andromeda polifolia L., Rhododendron lapponicum (L.) Wahlenb., Vaccinium vitis-idaea L. ssp. minus (Lodd.) Hult´en, and V. uliginosum L. The hummocks are drier mounds that rise above the level of the sedge-peat surface by about 40 cm. The hollows were about 55 cm below the sedge-peat surface with mats of P. turgescens, and partially decomposed peat material at their base, overlying a mineral substrate. They typically were filled with water, except dur-ing extreme drought periods.
The water table for the fen fluctuates throughout the grow-ing season, with a typical annual variation of 15 cm below to 20 cm above the mean sedge-peat elevation. The maximum water table height usually occurs just after spring snowmelt as the result of the top-down melting of the fen, with water overlying ice at the peat surface. Snowmelt occurred from 23–26 May (day of year (DOY) 144–147) 2008, 11–13 June (DOY 162–164) 2009, 9–14 May (DOY 129–134) 2010 and 30 May–4 June (DOY 150–155) 2011. The fen was snow and ice covered by 26, 13 and 30 October (DOY 300, 286, 303) in 2008, 2009 and 2010 respectively, but ice covered on 23 Oc-tober (DOY 296) and snow covered on 7 November (DOY 311) 2011 (Table 1).
2.2 Eddy-covariance flux station
An eddy-covariance flux tower was established in June of 2008 to measureFCH4 and net ecosystem exchange (NEE). The station was off-grid, powered by wind (Model 200 Whis-per Wind Generator, Southwest Windpower Inc., Flagstaff, AZ), solar (five photovoltaic panels for 500 W combined), and gas power generation (EU2000i, Honda Inc. as supple-mental).
The CH4concentration in atmosphere was measured
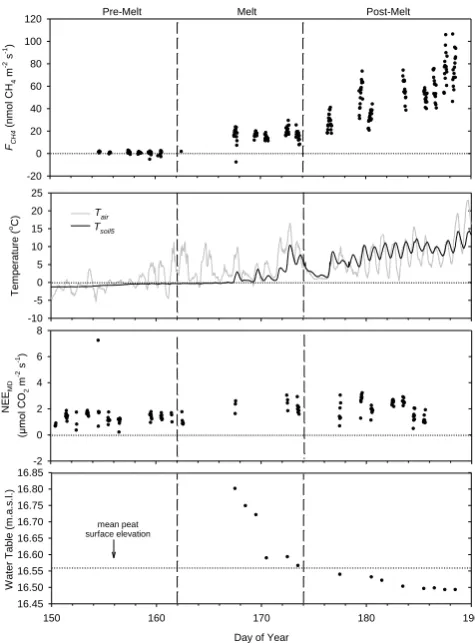
Table 1. Summary table of monthly mean air temperature (Tair)and total precipitation compared to the 1971–2000 climate normals for Churchill, Manitoba, obtained from Environment Canada, onset date of melt and freeze-up, duration of non-frozen period and measurement
period duration and % coverage. – represents no data available;∗represents 312 mm precipitation for June to November for use in 2009 and
2011 comparisons.
Non-Freeze- Frozen Measurement Measurement Season Melt up Period Period Period May Jun Jul Aug Sep Oct Nov Total (DOY) (DOY) (days) (DOY-DOY) Coverage (%) MeanTair(◦C)
2008 −0.5 7.3 12.5 13.8 5.2 1.5 −9.3 4.4 144 300 156 181–292 12 2009 −6.9 3.3 8.6 10.5 8.9 −0.3 −7.3 2.4 162 286 124 154–263 27 2010 −1.1 7.7 14.0 11.1 6.8 1.7 −8.1 4.6 129 303 174 195–312 32 2011 −2.2 7.7 14.2 13.0 10.3 1.7 −9.3 5.1 150 296 146 190–312 65
Normal # −0.7 6.6 12.0 11.7 5.6 −1.7 −12.6 3.0
Precipitation (mm)
2008 21 43.0 20.1 81.5 53.0 50.4 7.0 276.0 2009 – 45.9 91.5 21.6 65.3 25.4 14.4 264.1 2010 40.9 12.5 71.9 181.4 54.2 27.2 6.9 395.0 2011 – 42.9 59.8 80.2 24.2 102.0 12.8 321.9
Normal # 31.9 44.3 56.0 68.3 63.4 46.9 33.1 343.9∗
from 4.27 m above the fen surface to the analyser through a mesh screen (Cole Parmer, Vernon Hills, IL) and 7 µm in-line filter (Swagelok, Solon, OH), and 18 m of PTFE-Teflon tubing (6.35 mm id (inner diameter); Zeus Inc., Orangeburg, SC). An XDS 35i dry vacuum scroll pump (Edwards, Craw-ley, West Sussex, UK) drew the air stream at a flow rate of 28.5 L min−1during the 2008 field season with a sample lag
of 1.2 s. In 2009, this scroll pump failed and was replaced with two diaphragm vacuum pumps connected in parallel (LABOPORT N840.3, KNF Neuberger, Inc., Trenton, NJ) at a combined flow of 4.6 L min−1and a calculated lag of 7.5 s. This replacement of the high-flow pump with a more reliable lower-flow pump was also done by Detto et al. (2011) at their site. For us, the lower power draw was an added advantage of the slower pumps.
A 3-dimensional ultrasonic anemometer-thermometer (CSAT3, Campbell Scientific Inc., Logan, UT) was centre-mounted at the same height as the gas sample inlet facing north to measure wind velocities and air temperature. Addi-tionally, an open-path CO2/H2O analyser (LI-7500, LI-COR
Biosci., Lincoln, NE), centre-mounted at a 35◦angle facing north at the same height of the gas sample inlet and wind anemometer, was used to determine CO2 and water vapour
molar densities. Data were recorded at 10 Hz by a CR3000 data logger (Campbell Scientific Inc.).
Wind velocities, CO2 and H2O densities were recorded
nearly continuously. However, due to power generation and storage constraints, the CH4analyser and pumps could only
operate for campaign periods of 2 to 24 h before the battery storage bank was depleted for the 2008, 2009 and 2010 field seasons. In order to compensate for the power limitations and still capture diurnal trends inFCH4during the 2011 field sea-son, a relay turned the pumps on for 37 min to capture a 30 min campaign (5 extra minutes prior to and 2 min after
the half hour) starting at 00:00, 03:00, 09:00, 11:00, 15:00, 16:00, 17:00 and 21:00 LT (local time). We recognize that there are gaps in our flux measurements where an ephemeral release could have been missed.
2.3 Supporting environmental variables
Air temperature (Tair) was measured at a height of 1.8 m
(HMP45C, Vaisala Inc., Woburn, MA), horizontal wind speed (u) and direction at 4 m (Model 05103, R.M. Young Co., Traverse City, MI), photosynthetically active radiation (PAR) at 1 m (PAR Lite sensor, Kipp & Zonen, Bohemia, NY), and rainfall at 0.5 m (TR-525M, Texas Electronics Inc., Dallas, TX). Soil temperature was measured using thermo-couples in two wood dowels at 10, 20, 30, 40, 50, and 60 cm depths, placed in a sedge lawn (Tsed10,Tsed20,Tsed30,
Tsed40,Tsed50, andTsed60)and a hollow (Thol10,Thol20,Thol30,
Thol40,Thol50, andThol60). Three-junction averaging
thermo-couples were also placed at 5 cm depth in three hummocks, sedge lawns and hollows to provide an average near-surface temperature (Tsoil5). Environmental variables were recorded
half hourly using data loggers (CR5000, CR1000, CR23X, Campbell Scientific Inc.). Water table height was read daily from stationary rulers in three hollows during all four field seasons, and recorded half hourly by three pressure trans-ducers (HOBO U20 Water Level Data Loggers, Onset Com-puter Corporation, Inc., Pocasset, MA) in the 2011 field sea-son. Elevation of ruler tops and the sedge-peat surface (29 locations) were determined by GPS (TSC1 Asset Surveyor, Trimble Navigation Ltd., Sunnyvale, CA).
2.4 Data analysis
functions. Spikes in the measured high-frequency data were removed based on thresholds for each signal set to identify single spurious values. Block-average covariances were cal-culated without detrending and then coordinate rotated for each 30 min period (Tanner and Thurtell, 1969). The covari-ances were maximized half hourly by adjusting lag delays. High-frequency losses of the closed-path CH4analyser were
calculated by comparing the fractional loss of energy in the FCH4 spectrum to the spectrum for sensible heat flux. This resulted in a correction of 1.5 % for the high-volume pump in 2008 and 12 % for the low-volume pump in the other years. Density effects were corrected for water vapour for the closed-path CH4 system, and for both heat and water
vapour for the open-path CO2 system (Webb et al., 1980).
Self-heating of the LI-7500 analyser was included based on the corrections of Burba et al. (2008).
FCH4data from the CH4analyser were filtered to omit val-ues when only one of the two diaphragm pumps was running, the mirror ring-down value had declined more than 20 %, or when the internal pressure became<17.998 kPa. NEE data were filtered when rain and particles intercepted the sen-sor path based on the analyser’s diagnostic report. AllFCH4 determinations were filtered to remove half-hour periods at night (PAR <10 µmol m−2s−1)when the friction velocity (u∗) was below a threshold of 0.2 m s−1 (u∗threshold). NEE data were restricted to midday values from 11:00 to 15:00 LT (NEEMD), when plant productivity would be highest.FCH4 and NEEMDdata were filtered to remove half-hourly periods
when the cardinal wind direction was 135–225◦to exclude directions from the tower and gas power generator. Upward fluxes are defined as positive.
To observe seasonal trends and determine environmental drivers of FCH4 during the shoulder periods of spring and fall, as well as the growing season, the data was divided into different periods: spring of 2009 (DOY 150–190, 2009), all springs (DOY 150–190, 2008–2011), fall of 2011 (DOY 260–320, 2011), all falls (DOY 260–320, 2008–2011), and all shoulder+growing seasons (DOY 150–320, 2008–2011). Pearson’s product–moment correlation analysis was per-formed on all half-hourlyFCH4 data and Tair,Tsoil5,Tsed10, Tsed20,Tsed50,Thol10,Thol20,Thol50, NEEMD, water table and
PAR withP <0.0001 set as significant. Correlations were done to show relationships for spring of 2009, all springs, fall of 2011, all falls, and all shoulder+growing seasons. Visual inspection of relations betweenFCH4and environmental vari-ables indicated linear rather than exponential functions.The strength of the Pearson’s product–moment correlation was graded on a scale: strong correlation whenR≥ ±0.80, mod-erate correlation when±0.79≥R≥ ±0.50, and weak corre-lation whenR≤ ±0.49.
Temperature response ofFCH4 was determined using lin-ear regression analysis for 1◦C bin-averaged 30 min FCH4 data for all springs, all falls and all shoulder+growing sea-sons using both Tair and Tsoil5. The water table response
of FCH4 was determined using linear regression analysis
for 1 cm-height bin-averaged 30 min FCH4 for the same time periods. The strength of the linear relationship be-tween FCH4 and environmental variables was graded on a scale: strong linear relationship whenr2≥ ±0.80, moderate relationship when ±0.79≥r2≥ ±0.50, and weak relation-ship whenr2≤ ±0.49. The slope of the response ofFCH4 to a change in temperature (1FCH4
◦C−1) or water table
(1FCH4m
−1)was done using Student’ststatistic calculated
as the difference between slopes divided by the standard er-ror of the difference between slopes at n −4◦ of freedom (Kleinbaum and Kupper, 1978) using SigmaPlot 11.0 (Systat Software, Inc., San Jose, CA).
A multivariate model for methane emissions as a func-tion of the measured variables was developed using stepwise multiple linear regression and SigmaPlot 11.0. The dataset for all periods and years was partitioned based on water ta-ble height being above or below 16.61 m a.s.l. (5 cm above the mean sedge-peat surface). Partition was done because FCH4 was non-linear with respect to the water table where fluxes were very low (mean 16 nmol m−2s−1)when above 16.61 m a.s.l. Analysis was done using 30 min mean values for each data partition with an F=4000 (P=0.047) and F=3900 (P=0.050) for entry and removal of each variable in the model.
Mean dailyFCH4 values are reported from the average of 30 min emissions without gap-filling missing periods in a day. Cumulative annual methane emissions were estimated by summing the mean daily fluxes for all days when daily mean air temperature was ≥0◦C by (1) using linear in-terpolation to gap-fill missing days between mean daily fluxes of measured 30 min FCH4 (6FCH4−GF1), (2) using linear interpolation to fill 30 min gaps between measured FCH4 (6FCH4−GF2), and (3) modelling the missing 30 min FCH4 values using the Tsoil5 linear regression relationship withFCH4 (for all shoulder+growing seasons) up to 12
◦C
(6FCH4−GF3). Above this temperature, the flux was assumed constant at 47 nmol CH4m−2s−1 based on our
measure-ments. When daily mean air temperature was consistently <0◦CFCH4 was assumed constant at 0 nmol CH4m
−2s−1.
Gap-filling procedure 2 was used to more fully capture diur-nal variation since night-time (PAR<10 µmol m−2s−1)data capture ofFCH4 was 0–4 % of all potential night-time half-hour periods.
3 Results
3.1 Weather conditions
Monthly meanTairand total precipitation for the 2008 field
warmer, and had 67.9 mm less precipitation than the long-term average.
In 2009, winter air temperatures from January to April were normal (monthly mean temperatures of −24◦C to
−21◦C from January–March and −8◦C for April), then cooler and wetter than normal conditions were experienced early in the season from May to July, followed by warmer and drier conditions in the fall from September to Novem-ber. Seasonal totals indicate thatTair was 0.6◦C cooler and
had 47.9 mm less precipitation than the long-term average for May to November.
In 2010, conditions were warmer and wetter than nor-mal for July and August, with precipitation in August being 265 % greater than normal. Fall conditions from September to November were warmer and drier than normal. Season-ally, from May to NovemberTairwas 1.6◦C warmer, and had
51.1 mm more precipitation than the long-term average. The 2011 conditions showed that it was warmer than normal in July and throughout the fall from September to November. Drier than normal conditions occurred in Septem-ber and NovemSeptem-ber, while wetter than normal conditions oc-curred in October. Seasonal totals indicate that Tair was
2.1◦C warmer and had 9.9 mm more precipitation than the long-term average for May to November.
3.2 SpringFCH4
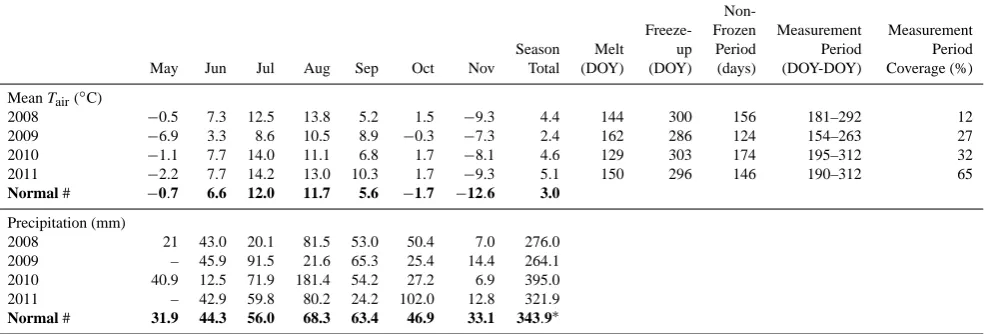
We were able to monitor the spring melt of 2009 (Fig. 1). In other years instrument and flux station repairs delayed mea-surements until after the spring-melt period. The spring of 2009 was categorized into three periods: the snow- and ice-covered “pre-melt” (DOY 150 to 161), the transitional “melt” period from snow and ice cover to open water (DOY 162 to 173), and “post-melt” (DOY 174 to 190) when no ice was present above the peat to inhibitFCH4diffusion.
During the 2009 pre-melt period,FCH4was near zero (−6 to 8 nmol CH4m−2s−1). Tair was mostly below 0◦C
un-til DOY 158, and temperatures at all soil depths were less than 0◦C. Midday net CO2flux (NEEMD)ranged from 0 to
2 µmol CO2m−2s−1.
Throughout the 2009 melt period,Tairwas mostly above
0◦C, with daytime highs between 5 and 15◦C. Soil temper-atures were less than 0◦C until DOY 168 whenTsoil5>0◦C
but the deeper soil remained frozen. By DOY 167, most of the fen surface thawed and was free of ice and snow and the water table dropped from 22 cm above the peat surface to <1 cm below the surface by DOY 172. During the melt pe-riodFCH4 increased from near zero to 20 nmol CH4m
−2s−1
and NEEMDranged from 1 to 3 µmol CO2m−2s−1.
In the 2009 post-melt period,FCH4 gradually increased to have midday peaks of 40 to 110 nmol CH4m−2s−1by DOY
188. A diurnal pattern inFCH4 was evident, and followedTair andTsoil5. Air temperature remained above 0◦C throughout
the period and daytime highs gradually increased from 10 to 23◦C;Tsoil5reached daytime highs of 14◦C by the end of the
Pre-Melt Melt Post-Melt
mean peat surface elevation
FCH4
(
nm
ol CH
4
m
-2 s -1)
-20 0 20 40 60 80 100 120
T
em
per
at
ur
e
(
oC)
-10 -5 0 5 10 15 20 25
Tair Tsoil5
N
EE
MD
(µ
m
ol CO
2
m
-2 s -1)
-2 0 2 4 6 8
Day of Year
150 160 170 180 190
W
at
er
T
able (m.
a.
s
.l.
)
16.45 16.50 16.55 16.60 16.65 16.70 16.75 16.80 16.85
[image:5.595.307.545.61.383.2]Tsoil5 Tair
Fig. 1. Spring of 2009 30 min CH4 flux (FCH4), air
tempera-ture (Tair), 5 cm soil temperature (Tsoil5), midday net CO2 flux
(NEEMD)and water table height for the fen from 30 May to 9 July
2009 (DOY 150 to 190).
period. The 10 cm soil depth thawed on DOY 177 and other soil depths remained frozen. The water table gradually low-ered to 8 cm below the peat surface by DOY 188 and NEEMD
emissions ranged from 1 to 3 µmol CO2m−2s−1.
FCH4 during the 2009 post-melt period was similar to FCH4 across all springs (Fig. 2); mean daily FCH4 ranged from 30 to 70 nmol CH4m−2s−1. Across all springsTsoil5
increased from−1 to 17◦C, withTsoil5for spring of 2009
be-ing within range but lowest of all sprbe-ings. NEEMDwas
dom-inated by respiration (0 to 3 µmol CO2m−2s−1)until DOY
180 across all springs. After DOY 180, uptake of CO2 by
the plants began to outweigh respiration; with the general trend across all springs showing NEEMDtransition from 2 to −2 µmol CO2m−2s−1by DOY 190 except for the spring of
FCH4 ( nm ol CH 4 m
-2 s -1) -20 0 20 40 60 80 100 120 140 160 2008 2009 2010 2011
Tso
il5 ( oC) -5 0 5 10 15 20 25 2008 2009 2010 2011 N EE MD (µ m ol CO 2 m
-2 s -1) -10 -8 -6 -4 -2 0 2 4 6
Day of Year
150 170 190 210 230 250 270 290 310
[image:6.595.51.288.60.367.2]W at er T able (m. a. s .l. ) 16.3 16.4 16.5 16.6 16.7 16.8 mean peat surface elevation
Fig. 2. Mean dailyFCH4(no gap-filling) for 30 min averaged
cam-paign periods (n=1 to 48)±1 SE (standard error) shown, and
mean dailyTsoil5, NEEMD and water table height for all
shoul-der+growing seasons (DOY 150–320, 2008–2011).
3.3 FallFCH4
The fall of 2011 provided the most extensive coverage of FCH4 due to the power relay automation of the flux sta-tion implemented in the 2011 field season, which conserved power (Fig. 3). This was divided into two periods: “pre-freeze” with senesced vegetation and mean dailyTair>0◦C
(DOY 260 to 289), and “freeze-up” when ice formed over standing water at the fen and mean dailyTair and soil
tem-peratures were≤0◦C by the end of the period (DOY 290 to 320).
During the pre-freeze period FCH4 ranged from 55 to 0 nmol CH4m−2s−1,Tairranged from 20 to−1◦C andTsoil5
was between 12 and 2◦C.F
CH4 gradually declined over the period following the decreasing temperature trend. The wa-ter table was 5 to 10 cm below the peat surface until DOY 286 then increased to 6 cm above the surface by the end of the period. NEEMDranged from 2 to−3 µmol CO2m−2s−1.
Freeze-up period surface ice cover developed quickly with a 10◦C drop in Tair (from 3 to −7◦C) over 3 days (DOY
290–293) then melted and froze again on DOY 294. The soil temperature profile reversed on DOY 290, after which the surface remained colder than lower depths until convergence
FCH4 ( nm ol CH 4 m
-2 s -1) -20 0 20 40 60 80 160
180 Pre-Freeze Freeze-Up
T em perat ure ( oC) -10 0 10 20 Tair Tsoil5 NEE MD (µ m ol CO 2 m
-2 s -1) -4 -3 -2 -1 0 1 2 3
Day of Year
260 270 280 290 300 310 320
[image:6.595.308.548.63.392.2]W at er T able (m .a. s.l. ) 16.40 16.44 16.48 16.52 16.56 16.60 16.64 16.68 mean peat surface elevation Tair Tsoil5
Fig. 3. Fall of 2011 30 minFCH4,Tair,Tsoil5, NEEMD and water table height for the fen from 17 September to 16 November 2011 (DOY 260–320). Open square indicates an anthropogenic emission burst, while open circles indicate natural emission bursts.
of 0–60 cm soil depths to 0◦C on DOY 317. By the end of the period, bothTairandTsoil5were at or below 0◦C. Average
over-winter (October–April) soil temperature from 0–60 cm depth was −2◦C. NEEMD emissions ranged from 0 to
1 µmol CO2m−2s−1and the final water table measurement
of the season on DOY 294 was 1 cm above the peat surface. Freeze-upFCH4 was minimal (<6 nmol CH4m
−2s−1
emis-sion) for most of the period, however emission bursts were observed on three occasions. Our visitation of the research site resulted in breaking through surface ice and a FCH4 emission burst on DOY 294 at 17:00 (161 nmol CH4m−2s−1
over 30 min period). Two non-disturbance related emission bursts were observed over 30 min periods on DOY 298 at 17:30 whereFCH4 was 20 nmol CH4m
−2s−1and on DOY
302 at 11:30 whereFCH4was 34 nmol CH4m
−2s−1. In both
instances of non-disturbance related emission bursts, wind speed was low (≤1.4 m s−1)for two hours leading up to and during the episodes.Tair had been below 0◦C for 3.5 days
Day of Year
190 200 210 220 230 240 250 260
FCH4
(
nmol C
H4
m
-2 s -1 )
R
ain
fall
(
m
m
)
0 20 40 60 80 100
Ts
oi
l5
(
o C)
8 12 16 20 24
Rainfall Tsoil5
FCH4
Day of Year
190 210 230 250
W
at
er
T
ab
le
(
m
.a
.s
.l
.)
[image:7.595.126.469.63.279.2]16.4 16.5 16.6 16.7
Fig. 4. Growing season mean dailyFCH4 (no gap-filling) (n=3 to 42)±1 SE shown, mean dailyTsoil5and total daily rainfall for the fen from 9 July to 17 September 2010 (DOY 190–260). Inset Figure: mean daily water table height for the fen 14 from 9 July to 17 September 2010 (DOY 190–260). Dotted line indicates the mean peat surface elevation.
went above 0◦C for 3 h before the emission burst on DOY 302.Tsoil5was at or above 0◦C before and during both
natu-rally occurring emission burst events.
FCH4 gradually decreased across all falls with mean daily FCH4 declining from 30 to 5 nmol CH4m
−2s−1 prior to
freeze and from 5 to−1 nmol CH4m−2s−1 during
freeze-up (Fig. 2). Fluxes during the fall of 2011 were within the range of those across all falls.Tsoil5gradually declined from
10 to−1◦C withTsoil5 being coolest in 2008 and warmest
in 2011. NEEMD became primarily emission again of 0 to
2 µmol CO2m−2s−1 over all falls as C. aquatilis senesced
and soil respiration outweighed photosynthetic uptake of the plants, however there was still some CO2uptake during the
fall of 2011 from DOY 260–270. NEEMD emissions across
all falls minimized to near zero during freeze-up. From DOY 260 to 290 across all falls, the water table was 1 to 10 cm be-low the mean peat surface; then increased precipitation prior to freeze-up raised the water table to 2 to 6 cm above the mean peat surface. In the fall of 2011, the water table was lower than in other years from DOY 260–280, and was higher than in other years from DOY 289–292.
3.4 Growing seasonFCH4
FCH4 peaked between DOY 190 and 230 with emissions ranging between 30 and 130 nmol CH4m−2s−1 in 2008,
2009 and 2011 (Fig. 2). This peak in emissions occurred dur-ing maximumTsoil5(5 to 17◦C), flowering of C. aquatilis,
peak CO2uptake (0 to−6 µmol CO2m−2s−1)by the
ecosys-tem, and water table residing 2 to 15 cm below the peat sur-face (Fig. 2).
Growing season FCH4 measurements in 2010 were very different than other growing seasons. In 2010, FCH4 was minimal between DOY 190 and 200, with emissions of 10 to 25 nmol CH4m−2s−1compared to other years where
the range was 30 to 90 nmol CH4m−2s−1 (Figs. 2, 4).
During the same time period in 2010, Tsoil5 ranged from
13 to 17◦C and NEEMD uptake ranged from near 0 to −5 µmol CO2m−2s−1. The water table was 5 to 6 cm
be-low the peat surface, and total rainfall was 8 mm (Fig. 4). The month prior to these measurements was warmer and drier than normal with a mean monthly Tair of 1.1◦C
above the 1971–2000 climate normal, and total monthly precipitation of 32 mm below the normal (Table 1). The 2010 growing season FCH4 then peaked between 35 and 65 nmol CH4m−2s−1 for DOY 200 to 210 with increasing
Tsoil5 and a re-wetting of the soil to create warm anaerobic
conditions (Figs. 2, 4). However,FCH4rapidly declined again to<12 nmol CH4m−2s−1between DOY 220 and 230,
coin-ciding with a dramatic cooling trend ofTsoil5from 23 to 8◦C.
Emissions continued to be suppressed from DOY 230 to 240 with a rapid rise in water table resulting from several multi-day rain events. A large rainfall event (110 mm in 24 h) on DOY 236 raised the water table 12 cm above the peat surface (Fig. 4). Coincidentally,FCH4 began to increase as the water table dropped, immediately following this event.
3.5 Cumulative annual CH4emissions
Cumulative annual CH4emissions varied by study year and
Table 2. Pearson’s product–moment correlation analysis for 30 min averaged FCH4data and environmental variables. Correlations are shown for spring of 2009 (DOY 150–190), all springs (DOY 150–190, 2008–2011), fall of 2011 (DOY 260–320), all falls (DOY 260–320, 2008–
2011) and all shoulder+growing seasons’ (DOY 150–320, 2008–2011) data. NS representsP >0.0001 (statistically insignificant) and
– represents data not available.
Tair Tsoil5 Thol10 Thol20 Thol50 Tsed10 Tsed20 Tsed50 NEEMD WT PAR
Spring R 0.68 0.84 0.87 0.88 0.85 0.89 – 0.70 0.53 −0.66 −0.27
2009 N 273 273 273 273 273 273 0 273 59 173 273
All R 0.72 0.85 0.85 0.72 0.84 0.81 NS 0.74 NS −0.70 NS
Springs N 311 311 311 311 311 311 38 311 77 203 311
Fall R 0.74 0.75 0.67 0.66 0.63 0.74 0.68 NS NS NS 0.55
2011 N 86 86 86 86 86 86 86 80 11 46 86
All R 0.77 0.86 0.82 0.83 0.82 0.83 0.82 0.76 0.57 NS 0.61
Falls N 333 312 312 312 312 312 309 306 61 72 333
All Shoulder R 0.57 0.52 0.30 NS −0.24 0.54 0.41 −0.26 NS −0.15 0.30
+Growing N 1515 1455 1465 1465 1404 1431 1137 1459 449 1021 1515
Table 3. Cumulative annual CH4emissions for all days when daily mean air temperature≥0◦C gap-filled by (1) using linear interpolation
to gap-fill missing days between measuredFCH4 (6FCH4−GF1), (2) using linear interpolation to fill 30 min gaps between measuredFCH4
(6FCH4−GF2), and (3) modelling the missing 30 minFCH4 values using theTsoil5linear regression relationship withFCH4 (for all
shoul-der+growing seasons) up to 12◦C and above this temperature, the daily flux was assumed constant at 47 nmol CH4m−2s−1(6FCH4−GF3).
Mean annual CH4emissions±1 SE for the study years 2008–2011 also shown.
2008 2009 2010 2011 Mean±1 SE
6FCH4−GF1 (g CH4m
−2yr−1) 9.5 6.4 4.3 8.0 7.1±1.1
6FCH4−GF2 (g CH4m
−2yr−1) 9.6 7.6 3.0 8.0 7.0±1.4
6FCH4−GF3 (g CH4m
−2yr−1) 6.6 4.8 7.2 7.6 6.5±0.6
from 6.6 to 9.6 g CH4m−2yr−1, while the 2010 study year
had the lowest cumulative annual CH4 emissions ranging
from 3.0 to 7.2 g CH4m−2yr−1. Despite the range in
cu-mulative annual CH4emissions estimated by the three
gap-filling methods on a yearly basis, the means among the three methods were within 9 % of each other when aver-aged over all four study years (mean±1 SE=6.5±0.6 to 7.1±1.1 g CH4m−2yr−1).
3.6 Association ofFCH4 and environmental variables
Pearson’s product–moment correlation analysis proved tem-perature to be the strongest driver of FCH4 during spring of 2009 and across all springs (Table 2) where 76 % of the data across all springs was represented by data from spring of 2009. In spring of 2009,Tair and soil temperatures to a
depth of 50 cm showed moderate to strong positive correla-tion (0.68≤R≤0.89), the water table had a moderate nega-tive correlation withFCH4(R= −0.66) indicating that as the water table droppedFCH4 increased and NEEMDhad a mod-erate positive correlation withFCH4 (R=0.53). Across all springs,Tairand soil temperatures to a depth of 50 cm showed
moderate to strong positive correlation (0.72≤R≤0.85); in
contrast the water table showed moderate negative correla-tion (R= −0.70) when compared to spring of 2009. All other variables were not significantly correlated withFCH4 across all springs.
The strongest driver of FCH4 during fall of 2011 and across all falls was soil temperature at 5 cm depth. In fall of 2011,FCH4 had a moderate positive correlation withTsoil5 (R=0.75) as well as withTairand all other soil temperatures
(0.63≤R≤0.74) and PAR (R=0.55). All other variables were not significantly correlated withFCH4 for fall of 2011. Across all falls,FCH4 had a strong positive correlation with Tsoil5(R=0.86) and with Thol10, Thol20, Thol50, Tsed10 and
Tsed20 (R=0.8).Tair,Tsed50, NEEMD and PAR had
moder-ate positive correlations withFCH4 (0.57≤R≤0.77) across all falls, while all other variables were not significantly cor-related withFCH4.
Over all shoulder+growing seasons,Tair,Tsoil5andTsed10
had moderate positive correlations (0.52≤R≤0.57) with FCH4. Other soil temperatures, water table and PAR had weak correlations withFCH4 and NEEMD was not a statis-tically significant driver ofFCH4.
[image:8.595.138.456.359.416.2]16.4 16.5 16.6 16.7 16.8 0
20 40 60 80
-5 0 5 10 15 20 25 30
0 20 40 60 80 100
16.4 16.5 16.6 16.7 16.8
0 20 40 60 80
AllSprings
Tsoil5 (oC)
-5 0 5 10 15 20 25 30
0 20 40 60 80 100
Tair (oC)
-10 -5 0 5 10 15 20 25 30
0 20 40 60 80 100
All Falls
mean peat surface elevation
All Shoulder + Growing
-5 0 5 10 15 20 25 30
0 20 40 60 80 100
-10 -5 0 5 10 15 20 25 30
0 20 40 60 80 100
-10 -5 0 5 10 15 20 25 30
FCH4
(
nm
ol
CH
4
m
-2 s -1)
0 20 40 60 80 100
Water Table (m.a.s.l.)
16.4 16.5 16.6 16.7 16.8
0 20 40 60 80 y = 5.26x + 4.31
r2 = 0.91
y = 1.73x + 5.37
r2 = 0.89
y = 3.12x + 7.11
r2 = 0.92
y= 3.98x + 2.69
r2 = 0.91 y = 0.88x + 7.48
r2 = 0.63
y = 2.54x + 5.76
r2 = 0.91
FCH4
(
nm
ol
CH
4
m
-2 s -1)
FCH4
(
nm
ol
CH
4
m
-2 s
-1) y = - 427x + 7111
r2 = 0.89
y = - 24x + 407
r2 = 0.03 y = - 214x + 3574
[image:9.595.131.468.62.471.2]r2 = 0.52
Fig. 5. Bin-averaged (1◦C) 30 minFCH4 ±1 SE in response toTsoil5andTairshown for all springs (DOY 150 to 190, 2008–2011), all falls
(DOY 260 to 320, 2008–2011) and all shoulder+growing seasons (DOY 150–320, 2008–2011). Bin-averaged (1 cm water table height)
30 minFCH4±1 SE in response to water table is shown for the same periods. Dotted line indicates the mean peat surface elevation.
12◦C for all falls (r2=0.89) and over all shoulder+growing seasons (r2=0.95) (Fig. 5). The slope of the linear regres-sion across all springs was more than triple that across all falls and the slopes were significantly different (P <0.001). Positive linear relationships withTair(from 0 to 30◦C) were
strong across all springs (r2=0.91) and across all shoulder
+growing seasons (r2=0.91) and moderate across all falls (r2=0.63). The slope of the regression across all springs was 4.5 times greater than across all falls and the slopes were sig-nificantly different (P <0.001).
FCH4 had a negative linear relationship with the water ta-ble from 13 cm below to 3 cm above the peat surface, with the strongest relationship for all springs (r2=0.89). A moder-ate linear relationship occurred across all shoulder+growing seasons (r2=0.52), but there was no linear relationship
across all falls (r2=0.03). The slope of the regression across all springs was significantly different (P <0.001) than the slope of the regression for all falls. Over the four study years, the highest FCH4 occurred when the water table was 2 to 15 cm below the mean peat surface. It was lowest when the water table was at or above the mean peat surface.
The stepwise linear model best predicting 30 min mean FCH4 when water table height was below 16.61 m a.s.l. (r2=0.76) was comprised of the variables Thol60
(par-tial r2=0.64), water table height (r2=0.06) and Tair
Measured FCH4 (nmol CH4 m-2 s-1)
0 20 40 60 80 100 120 140
Predi
c
ted
FCH4
(
nm
ol CH
4
m
-2 s -1)
0 20 40 60 80 100 120 140
y = 0.71(x) + 12.16 (r2 = 0.74, P < 0.0001)
[image:10.595.50.284.60.293.2]1 : 1
Fig. 6. Stepwise multiple linear model estimates of daily mean
FCH4in relation to daily mean measured values for all measurement
periods and years when water table height was below 16.61 m a.s.l.
The model is FCH4= (−9.8×Thol60)+(279.8×water
ta-ble)+(1.7×Tair)−4572.2.
when the water table height was above 16.61 m a.s.l. because no variable met the criteria to enter the analysis.
4 Discussion
4.1 FCH4 response to spring melt and fall freeze-up
A gradual increase in FCH4 with increasing Tair and near-surface soil temperature (Tsoil5 andTsed10), and lowering of
the water table was observed across all springs, whereas a gradual decline in FCH4 across all falls occurred with de-creasing Tair, soil temperature and rising water table. We
did not observe a FCH4 burst in spring of 2009 or across all springs as 76 % of the spring-melt data was represented by spring of 2009. However, we believe to have successfully captured two naturally occurring 30 min emission bursts of 20 to 34 nmol CH4m−2s−1(compared to background
emis-sions of<6 nmol CH4m−2s−1)during fall of 2011 despite
our non-continuous measurements.
These naturally occurring emission bursts in the fall of 2011 occurred during periods of low wind speed (<1.4 m s−1) when air temperature that was below 0◦C formed a thin ice layer over the standing water at the fen, then went above 0◦C for several hours causing the ice to melt. Surface soil temperatures were at or above 0◦C indicating that methane could still be produced and captured as bubbles under the ice, being released as the ice melted. A human-induced 30 min emission burst of 161 nmol CH4m−2s−1
measured after breaking through thin ice in the fall of 2011 showed that physical disturbance released trapped gas bub-bles to the atmosphere analogously to the naturally occur-ring melting of the ice, however since this disturbance was not only to the ice but to the underlying peat as well, a larger emission burst was observed than naturally occurring bursts at our fen.
Fall emission bursts from a similar fen environment un-derlain by continuous permafrost at Zackenberg, Greenland, have been reported by Mastepanov et al. (2008) and Tages-son et al. (2012). Mastepanov et al. (2008) used automated chambers and a closed path methane analyser to measure CH4 flux and observed several emission bursts of up to
313 nmol CH4m−2s−1 during freeze-up in early October
2008. Their fen was not inundated with water at the time of freeze-up. Mastepanov et al. (2008) described a freeze-up process whereby the active layer freezes from the top down and CH4production continues in the thawed peat trapped
be-tween the frozen active layer and the permafrost table. The CH4produced in the thawed peat layer gradually becomes
squeezed out through frost action during freeze-up or can move through the aerenchyma of senescent vascular plants (Kim et al., 2007; Mastepanov et al., 2008). Tagesson et al. (2012) measuredFCH4 in 2008 and 2009 using a com-bination of flux gradient and eddy-covariance methods. Fall emission bursts were not observed during onset of freezing in either year, but emission bursts up to 313 nmol CH4m−2s−1
were measured after the soil was frozen during storm events in late October of 2008. Tagesson et al. (2012) suggest that methane trapped in cavities and cracks in the soil during freeze-up were released in the late October 2008 storm which created a turbulence-induced ebullition event due to changes in air pressure and ventilation in the frozen peat matrix. Be-cause a snow cover was not present turbulent air could move through cracks and open pores in the peat. A similar late fall event was not observed in 2009 likely because the presence of snow cover protected the frozen peat matrix.
We have also observed bubbles within winter ice at the fen and ice of shallow lakes in the area, which have been reported by Duguay et al. (2002). These winter-trapped bub-bles did not cause abrupt fluxes from our fen in the spring. It is hypothesized that these gases were gradually released by diffusive processes through the ice over the winter period, and therefore were not released from the bubbles as emis-sion bursts during spring melt. We did not measure FCH4 over the winter period. While previous studies have found winter FCH4 to contribute up to 40 (Alm et al., 1999) and 10 % (Rinne et al., 2007) of the annual CH4budget, the
and ranged from−7 to 0◦C). Therefore we believe the
over-winter fluxes should be negligible at our fen, however we ac-knowledge further monitoring is required to have confidence in low winter fluxes.
Other groups have observed CH4 release during spring
melt in northern peatlands due to bubbles trapped in and under ice. Continuous spring-meltFCH4 measurements, us-ing eddy covariance with a tunable diode laser over a mesotrophic flark fen in Finland showed peak emission of 75 nmol CH4m−2s−1 over a six-hour period compared to
a range of 12 to 50 nmol CH4m−2s−1 for the other times
(Hargreaves et al., 2001). However, unlike our fen, no per-mafrost was present at the Finnish fen and soil was thawed from the surface to 40 cm depth. Wille et al. (2008) also used the eddy covariance with a tunable diode laser to de-termineFCH4 for wet low-centred polygonal tundra in the Lena River delta, Siberia, in pre- and post-melt periods. Dur-ing melt,FCH4 was highly variable with multiple emission bursts with 1- to 4 h-sustained peaks ranging from 87 to 104 nmol CH4m−2s−1 and then fluxes stabilized between −34 and 34 nmol CH4m−2s−1 after the melt. The region
was within the zone of continuous permafrost, and poly-gon centres were thawed>20 cm with standing water during the emission burst events. Tokida et al. (2007) used cham-bers to measure spring-melt emissions for an ombrotrophic peatland in Japan and found an emission burst as high as 439 nmol CH4m−2s−1over a 1 h period. Their ombrotrophic
peatland was not underlain by permafrost, and air tempera-tures throughout the winter and spring-melt period hovered around 0◦C resulting in diurnal freeze–thaw cycles and soil waterlogged conditions. Mastepanov et al. (2008) reported similar results as observed in our study for a graminoid fen underlain by continuous permafrost at Zackenberg Val-ley, northeastern Greenland. No emission bursts were ob-served during spring melt, rather CH4emissions were small,
but gradually increased to 35 nmol CH4m−2s−1 by
mid-summer..
It is suspected that sites without permafrost are more likely to be ones whereFCH4 emission bursts occur in the spring. Shallow frozen soil layers overlying unfrozen peat will be conducive to methane production and accumulation over winter and rapid surface thaw in spring facilitating emission bursts. This has been shown at a Finnish aapa mire (Harg-reaves et al., 2001) and at an ombrotrophic peatland in Japan (Tokida et al., 2007), both of which lacked permafrost. In contrast, it is suspected that for sites with permafrost there is a greater likelihood that the spring-meltFCH4 will be grad-ual. Active layer soil will be frozen to the permafrost table over winter which will impede methane production in winter and that surface thaw will be slower. This was observed at our fen and at the graminoid fen at Zackenberg Valley, Greenland (Mastepanov et al., 2008), both of which had continuous per-mafrost.
4.2 Controls ofFCH4
In the current study, the univariate analysis showed FCH4 was strongly associated with Tair and all soil temperatures
up to a depth of 50 cm during all springs, all falls, and all shoulder+growing seasons. The temperature response was significantly greater across all springs (represented mostly by spring 2009) than across all falls. Soil temperatures to a depth of 10 cm were found to be the most effective drivers ofFCH4 at our fen. The temperature response ofFCH4 across all springs, all falls and all shoulder+growing seasons was found to be a linear response up to a threshold. While pre-vious studies from similar sites without permafrost (Harg-reaves et al., 2001; Rinne et al., 2007; Long et al., 2009) and with discontinuous permafrost (Jackowicz-Korczynski et al., 2010) have found non-linear temperature response relation-ships, our fen site behaves similarly to the patterned fen un-derlain by continuous permafrost at Zackenberg, Greenland, (Tagesson et al., 2012) where a linear temperature response ofFCH4 was determined with near-surface soil temperature. Most studies have reported a singleFCH4–soil temperature relationship during the growing season, and very few have re-ported on spring-melt or fall-freeze-up periodFCH4 relation-ships. Our data indicate increased understanding of drivers when spring and fall relationships ofFCH4 withTairand soil temperature profiles to 50 cm depth are evaluated separately. For our palsa fen underlain by continuous permafrost, the near-surface active layer is the source of production leading to spring and fall FCH4 rather than release of trapped CH4 deeper in the soil. The greater response inFCH4 toTsoil5 dur-ing the sprdur-ing than fall may be related to the gradual release of labile carbon from plant roots, residues and microbial biomass broken down over winter and early spring freeze– thaw cycles as the soil profile thaws. Edwards et al. (2006) measured microbial biomass and available soil carbon, nitro-gen and phosphorus from late winter (Tsoil from 5 to 15 cm
depth below−10◦C), through 49 days of freeze–thaw cycles (1 April–19 May), and early spring (Tsoil from 5 to 15 cm
above 0◦C) of 2005 at a nearby wet sedge meadow dom-inated by Carex aquatilis at Churchill, Manitoba. Results from their study indicated that microbial biomass and nu-trient availability peaked during the freeze–thaw cycles and steadily declined in early spring. At our fen, the thick ice layer resulting from a high water table in fall insulated the soil and prolonged the thaw at 5 cm depth until mid-June and the 20 cm depth until mid-July. It is suspected that the peak in microbial biomass and available carbon are spread over the same time frame.
example, Zona et al. (2009) found the highest FCH4 when the water table was at the peat surface and soil tempera-ture at 10 cm≥4◦C at a wet sedge meadow tundra,
under-lain by continuous permafrost at Barrow, Alaska. Turetsky et al. (2008) used clear static chambers and showed the highest FCH4when the water table was 0 to 10 cm below the peat sur-face and soil temperature at 25 cm≥14◦C at a moderately rich fen near Fairbanks, Alaska, in the zone of discontinuous permafrost. Hendriks et al. (2010) used dark static chambers at a eutrophic peat meadow, not underlain by permafrost, at Horstermeer, the Netherlands, and found the highest FCH4 with surface soil temperature≥10◦C and a water table 20 to 40 cm below the peat surface. This range indicates that un-derstanding where CH4is being produced in the peat profile
and the transport mechanisms under varying water table po-sitions is important.
Multivariate analysis using stepwise linear regression re-vealed Thol60 to most influence FCH4 and less so water table height and Tair when water table height was below
16.61 m a.s.l. Co-linearity between air and surface tempera-tures likely accounted for temperature at greater depths than the surface being included in the multivariate model. Fur-ther, peat surface temperatures closely patternTair whereas
those of water-filled hollows did not. Chamber measured fluxes at the site showed emissions from water-filled hol-lows to be much greater for sedge-peat surfaces and fluxes being very low from hummocks (Churchill, 2007). Zona et al. (2009) also performed multiple linear regression analysis of potential environmental drivers ofFCH4 and reported soil temperature at 10 cm depth, thaw depth and soil moisture at 20–30 cm together explained 94 % of the variability inFCH4 at a wet sedge meadow tundra near Barrow, Alaska. Wille et al. (2008) generated a multivariate model forFCH4 using an exponential function incorporating soil temperature at 20 cm depth and wind friction velocity for a polygonal tundra in the Lena River delta, Siberia. Sachs et al. (2008) expanded the model by Wille et al. (2008) to include air pressure. These results reinforce the importance of soil temperature and wa-ter as drivers ofFCH4 from peatland environments underlain by continuous permafrost. The fen in the current study had a water table often near or above the mean peat surface, thus water table rather than soil moisture exerted some control overFCH4.
The lack of a significant model when water table height was >16.61 m a.s.l. was possibly due to a low population dataset of 30 min mean values or dampening in FCH4 re-sponse to environmental conditions.FCH4 was less when the water table rose above the mean sedge-peat surface of our fen. Zona et al. (2009) observed similar results for a wet sedge meadow tundra near Barrow, Alaska. In our study, a large, late summer rain (110 mm in 24 h in 2010) raised the water table 12 cm above the peat surface.FCH4 subsequently increased as the water table dropped. IncreasingFCH4with a drop in the water table position from the soil surface has also been reported for subarctic fens in northern Quebec
(Wind-sor et al., 1992) and Siberia (Heyer et al., 2002), tame pasture land in southeastern Manitoba (Tenuta et al., 2010), and ri-parian areas in a prairie pot-hole landscape in southcentral Manitoba (Dunmola et al., 2010). It is suggested that water above a peat surface forms an aquatic environment whereby transport of CH4through diffusion and ebullition is less
ef-ficient than transport through air (Zona et al., 2009). Heyer et al. (2002) proposed that the low solubility of CH4causes
bubble formation in near-surface soil overlain by water. As the water table lowers, release of hydrostatic pressure results in escape of bubbles through open soil pores connected to the atmosphere. We speculate that emission bursts of CH4were
not observed at our fen during spring melt partly as the result of the water table residing at or above the mean sedge-peat surface impeding the transport of CH4to the atmosphere.
An ice barrier impeded diffusion and ebullition of CH4
further during the melt period of 2009 at our fen. Snow that had accumulated on top of the ice in winter had melted out quickly and left open water over an ice layer that extended down 10 to 30 cm to the peat surface. The ice thawed from the top downwards over the course of the melt period and de-spiteTsoil5≥0◦C allowing for soil microbial activity, CH4
was trapped by this ice barrier and overlying water, slow-ing CH4release to the atmosphere. Hargreaves et al. (2001)
described a similar occurrence of an ice barrier layer dur-ing sprdur-ing melt at their permafrost-free aapa mire in Finland, however they observed FCH4 bursts which coincided with soil thawed>40 cm and the occurrence of gases bubbling out from cracks in the ice barrier layer.
Across all springs, NEEMD was not significantly
corre-lated toFCH4. NEEMDwas respiration dominated indicating that although new shoots from sedges were beginning to pho-tosynthesize and provide some carbon in root exudates, the soil microbial communities were more effectively metaboliz-ing over-winter-stored carbon, respirmetaboliz-ing from hummocks ex-posed above the water table, and emitting CO2by diffusion
through the water column from the aerobic peat–water inter-face. Methane was being produced in thawing anaerobic soils but in early spring the high water table inundated most of the fen. Methane could have been emitted through ebullition but we cannot be sure we captured these events during our cam-paigns. New sedge shoots were too small during spring melt to transfer much methane through their aerenchyma. Diffu-sion through the water column therefore dominated; a slow process due to methane’s low solubility in water. Addition-ally, because the thaw layer of peat was shallow during melt, it is suggested that methane produced in the anaerobic layer was largely consumed as it moved upwards into the shallow aerobic peat–water interface. Across all falls, NEEMDhad a
positive correlation withFCH4. At this time, the water table was mostly below the peat surface, plants had senesced and soil microbial communities were metabolizing labile carbon of roots and above-ground plant biomass, emitting both CO2
and CH4to the atmosphere at a decreasing rate as resources
4.3 Cumulative annual CH4emissions
Cumulative annual CH4emissions for our fen ranged from
3.0 to 9.6 g CH4m−2yr−1 between the study years of 2008
to 2011. We found the mean annual flux±1 SE over the four years ranging from 6.5±0.6 to 7.1±1.1 g CH4m−2yr−1
when comparing the three gap-filling techniques indicating that despite out attempts to better capture diurnal variabil-ity with our modelling methods the mean annual fluxes were all within 1 SE of each other and thus statistically similar. The cumulative annual CH4 emission results calculated in
this study are within range of fluxes measured from other northern peatland sites within the zone of continuous per-mafrost using the eddy-covariance technique. Tagesson et al. (2012) estimated cumulative annual CH4 emissions of
8.7 to 10 g CH4m−2yr−1 for their patterned fen at
Zack-enberg, Greenland, in 2008 and 2009 respectively. Wille et al. (2008) estimated 3.2 g CH4m−2yr−1for a wet polygonal
tundra at the Lena River delta, Siberia, from July 2003–2004, and Hargreaves et al. (2001) estimated 5.5 g CH4m−2yr−1,
modelled from data obtained during 1995, 1997 and 1998 field seasons at an aapa mire, Kaamanen, Finland. Larger cumulative annual CH4 emissions were found in zones of
discontinuous or no permafrost. Jackowicz-Korczynski et al. (2010) estimated 24.5 and 29.5 g CH4m−2yr−1 from
eddy-covariance measurements at a palsa mire underlain by discontinuous permafrost at Stordalen, Sweden, in 2006 and 2007 respectively, whereas Rinne et al. (2007) reported 12.6 g CH4m−2yr−1for 2005 from a boreal minerotrophic
fen with no permafrost at Siikaneva, Finland. Hendriks et al. (2007) estimated 41 and 44 g CH4m−2yr−1 from
chamber measurements at a permafrost-free abandoned peat meadow at Horstermeer, the Netherlands, for 2005 and 2006 respectively. Rouse et al. (1995) used dark vented 18-L chambers at our same fen site at Churchill, estimating an average dailyFCH4 of 22 and 62 mg CH4m
−2d−1 for
spe-cific times of year in 1989 and 1990 respectively. Our fluxes ranged from 25 to 92 mg CH4m−2d−1for that same time
pe-riod (21 June to 11 September) across all years showing good agreement.
5 Conclusions
Near-surface soil temperature and air temperature were the main controlling factors forFCH4 from the subarctic fen in northern Manitoba explaining about 90 % of the variation in fluxes during shoulder seasons.FCH4was essentially zero during frozen conditions. Emission bursts were not observed across all springs but two natural emission bursts were ob-served during fall of 2011. The seasonal pattern followed the temperature, and a temperature decrease coinciding with heavy rainfall inundating the fen during the growing season caused an immediate decrease inFCH4indicating that a high water table above the sedge-peat surface can overwhelm the
temperature relationship. The temperature response ofFCH4 was significantly greater in spring than fall, providing great insight into changing seasonal responses ofFCH4to environ-mental drivers. Multivariate stepwise regression showed in-creasing temperature in hollows to most relate toFCH4 and are less so to air temperature, and inversely to water table height. Cumulative annual CH4emissions ranged from 3.0
to 9.6 g CH4m−2yr−1 between the years 2008 and 2011,
with mean annual CH4emissions ranging between 6.6 and
7.1 CH4m−2yr−1using different gap-filling techniques. Our
annual CH4emissions are within the range of measurements
at other northern fen environments underlain by continuous permafrost.
Acknowledgements. We thank staff, researchers and volunteers
of the Churchill Northern Studies Centre, C. Basler, K. Davoli, J. Dunn, L. Fishback, R. Hermans, K. Jansen, S. Kuleza, C. Pad-dock, J. Rutter and A. Winegardner for field support, Z. Nesic (software), J. Rapai and K. Swystun for technical support. Funding was provided by the Natural Sciences and Engineering Council of Canada (NSERC) Discovery Program, the Canada Foundation for Innovation, the Canada Research Chair Program in Applied Soil Ecology and ArcticNet Network of Centres of Excellence of Canada. K. L. Hanis was supported by a NSERC Post-graduate scholarship, the Weston Award for Northern Research, the Northern Scientific Training Program, the Environment Canada Science Horizons Program and the Churchill Northern Studies Centre Northern Research Fund.
Edited by: K. Butterbach-Bahl
References
Alm, J. Saarnio, S., Nykanen, H., Silvola, J., and Martikainen, P. J.:
Winter CO2, CH4, and N2O fluxes on some natural and drained
boreal peatlands, Biogeochemistry, 44, 163–186, 1999. Baer, D. S., Paul, J. B., Gupta, M., and O’Keefe, A.: Sensitive
ab-sorption measurements in the near-infrared region using off-axis integrated-cavity-output spectroscopy, Appl. Phys. B, 75, 261– 265, 2002.
Baldocchi, D., Detto, M., Sonnentag, O., Verfaillie, J., The, Y. A., Silver, W., and Kelly, N. M.: The challenges
of measuring methane fluxes and concentrations over
peatland pasture, Agr. Forest Meteorol., 153, 177–187, doi:10.1016/j.agrformet.2011.04.013, 2011.
Brown, R. J. E.: Permafrost in Canada; its influence on Northern development, Canadian Building Series 4, University of Toronto Press, Toronto, 1970.
Burba, G. G., McDermitt, D. K., Grelle, A., Anderson, D. J. and Xu, L.: Addressing the influence of instrument surface heat
ex-change on the measurements of CO2from open-path gas
analyz-ers, Glob. Change Biol., 14, 1854–1876, 2008.
Churchill, J. A.: Spatial variation of soil methane and nitrous ox-ide emissions in subarctic environments of Churchill, Manitoba, M.Sc. Thesis, University of Manitoba, 2007.
measure methane fluxes using the eddy covariance method, Agr. Forest Meteorol., 151, 1312–1324, 2011.
Duguay, C. R., Pultz, T. J., Lafleur, P. M., and Drai, D.: RADARSAT backscatter characteristics of ice growing on shallow sub-Arctic lakes, Churchill, Manitoba, Canada. Hydrol. Process., 16, 1631– 1644, 2002.
Dunmola, A. S., Tenuta, M., Moulin, A. P., Yapa, P., and Lobb, D. A.: Pattern of greenhouse gas emission from a Prairie Pothole agricultural landscape in Manitoba, Canada, Can. J. Soil Sci., 90, 243–256, 2010.
Edwards, K. A., McCullough, J., Kershaw, G. P., and Jeffries, R. L.: Soil microbial and nutrient dynamics in a wet Arctic sedge meadow in late winter and early spring, Soil Biol. Biochem., 38, 2843–2851, 2006.
Environment Canada: National climate data and information archive, http://www.climate.weatheroffice.gc.ca, (last access: 10 November 2012), 2012.
Forster, P., Ramaswamy, V., Artaxo, P., Berntsen, T., Betts, R., Fa-hey, D. W., Haywood, J., Lean, J., Lowe, D. C., Myhre, G., Nganga, J., Prinn, R., Raga, G., Schulz, M., and Van Dorland, R.: Changes in Atmospheric Constituents and in Radiative Forc-ing, in: Climate Change 2007: The Physical Science Basis. Con-tribution of Working Group I to the Fourth Assessment Report of the Intergovernmental Panel on Climate Change, edited by: Solomon, S., Qin, D., Manning, M., Chen, Z., Marquis, M., Av-eryt, K. B., Tignor, M., and Miller, H. L., Cambridge University Press, Cambridge, UK and New York, USA, 2007.
Grondahl, L., Friborg, T., Christensen, T. R., Ekberg, A., Elberling, B., Illeris, L., Nordstrom, C., Rennermalm, A., Sigsgaard, C., and Sogaard, H.: Spatial and inter-annual variability of trace gas fluxes in a heterogeneous high-Arctic landscape, Adv. Ecol. Res., 40, 473–498, 2008.
Hargreaves, K. J., Fowler, D., Pitcairn, C. E. R., and Aurela, M.: An-nual methane emission from Finnish mires estimated from eddy covariance campaign measurements, Theor. Appl. Climatol., 70, 203–213, 2001.
Hendriks, D. M. D., Dolman, A. J., van der Molen, M. K., and van Huissteden, J.: A compact and stable eddy covari-ance set-up for methane measurements using off-axis integrated cavity output spectroscopy, Atmos. Chem. Phys., 8, 431–443, doi:10.5194/acp-8-431-2008, 2008.
Hendriks, D. M. D., van Huissteden, J., and Dolman, A. J.: Multi-technique assessment of spatial and temporal variability of methane fluxes in a peat meadow, Agr. Forest Meteorol., 150, 757–774, 2010.
Heyer, J., Berger, U., Kuzin, I. L., and Yakovlev, O. N.: Methane emissions from different ecosystem structures of the subarctic tundra in Western Siberia during midsummer and during the thawing period, Tellus B, 54, 231–249, 2002.
Jackowicz-Korczynski, M., Christensen, T. R., Backstrand, K., Crill, P., Friborg, T., Mastepanov, M., and Strom, L.: Annual cy-cle of methane emission from a subarctic peatland. J. Geophys. Res. Biogeosci., 115, G02009, doi:10.1029/2008JG000913, 2010.
Joabsson, A., Christensen, T. R., and Wallen, B.:Vascular plant con-trols on methane emission from northern peatforming wetlands, Trends Ecol. Evol., 14, 385–388, 1999.
Kim, Y., Ueyama, M., Nakagawa, F., Tsunogai, U., Harazono, Y.
and Tanaka, N.: Assessment of winter fluxes of CO2and CH4
in boreal forest soils of central Alaska estimated by the profile method and the chamber method: a diagnosis of methane emis-sion and implications for the regional carbon budget, Tellus B, 59, 223–233, 2007.
Kleinbaum, D. G. and Kupper, L. L.: Applied Regression Analysis and Other Multivariable Methods, Duxberry Press, North Scitu-ate, MA, 1978.
Long, K. D., Flanagan, L. B., and Cai, T.: Diurnal and seasonal vari-ation in methane emissions in a northern Canadian peatland mea-sured by eddy covariance, Glob. Change Biol., 16, 2420–2435, 2009.
Los Gatos Research: Methane Analyzers: Fast – Low Power
– High Precision, http://www.lgrinc.com/documents/
Methane-Analyzers-web.pdf, (last access: 25 March 2010), 2009.
Mastepanov, M., Sigsgaard, C., Dlugokencky, E. J., Houweling, S., Strom, L., Tamstorf, M. P., and Christensen, T. R.: Large tundra methane burst during onset of freezing, Nature, 456, 628–630, 2008.
McGuire, A. D., Anderson, L. G., Christensen, T. R., Dallimore, S., Guo, L., Hayes, D. J., Heimann, M., Lorenson, T. D., Macdon-ald, R. W., and Roulet, N.; Sensitivity of the carbon cycle in the Arctic to climate change, Ecol. Monogr., 79, 523–555, 2009. National Wetlands Working Group: The Canadian Wetland
Classi-fication System: Second Edition, Wetland Research Centre, Uni-versity of Waterloo, Ontario, 1997.
Pickett-Heaps, C. A., Jacob, D. J., Wecht, K. J., Kort, E. A., Wofsy, S. C., Diskin, G. S., Worthy, D. E. J., Kaplan, J. O., Bey, I., and Drevet, J.: Magnitude and seasonality of wetland methane emis-sions from the Hudson Bay Lowlands (Canada), Atmos. Chem. Phys., 11, 3773–3779, doi:10.5194/acp-11-3773-2011, 2011 Raddatz, R. L., Papakyriakou, T. N., Swystun, K. A., and Tenuta,
M.: Evapotranspiration from a wetland tundra sedge fen: surface resistance of peat for land-surface schemes, Agr. Forest Meteo-rol., 149, 851–861, 2009.
Rinne, J., Riutta, T., Pihlatie, M., Aurela, M., Haapanala, S., Tuovi-nen, J. P., Tuittila, E. S., and Vesala, T.: Annual cycle of methane emission from a boreal fen measured by the eddy covariance technique, Tellus B, 59, 449–457, 2007.
Rouse, W. R., Holland, S., and Moore, T. R.: Variability in methane emissions from wetlands at northern treeline near Churchill, Manitoba, Arctic Alpine Res., 27, 146–156, 1995.
Rouse, W. R., Bello, R. L., D’Souza, A., Griffis, T. J., and Lafleur, P. M.: The annual carbon budget for fen and forest in a wetland at Arctic treeline, Arctic, 55, 229–237, 2002.
Sachs, T. Wille, C., Boike, J., and Kutzbach, L.: Environmental
con-trols on ecosystem-scale CH4emission from polygonal tundra in
the Lena River Delta, Siberia, J. Geophys. Res.-Biogeo., 113, G00A03, doi:10.1029/2007JG000505, 2008.
Schimel, J. P.: Plant transport and methane production as controls on methane flux from Arctic wet meadow, Biogeochemistry, 28, 183–200, 1995.
Shindell, D. T., Galuvegi, G., Koch, D. M., Schmidt, G. A., Unger, N., and Bauer, S. E.: Improved attribution of climate forcing to emissions, Science, 326, 716–718, 2009.
ecosys-tem, Glob. Change Biol., 18, 1928–1940, doi:10.1111/j.1365-2486.2012.02647.x, 2012.
Tanner, C. B. and Thurtell, G. W.: Sensible heat flux mea-surements with a yaw sphere and thermometer: anemocli-nometer measurements of Reynolds stress and heat trans-port in the atmospheric surface layer, TR Ecom 66-G22-F, http://www.dtic.mil/cgi-bin/GetTRDoc?Location=U2&doc= GetTRDoc.pdf&AD=AD0689487, Dept. Soil Science, Univ. Wisconsin, Madison, WI, 1969.
Tarnocai, C., Canadell, J. G., Schuur, E. A. G., Kuhry, P., Mazhi-tova, G., and Zimov, S.: Soil organic carbon pools in the north-ern circumpolar permafrost region, Global Biogeochem. Cy., 23, GB2023, doi:10.1029/2008GB003327, 2009.
Tenuta, M., Mkhabela, M., Tremorin, D., Coppi, L., Phipps, G., Flaten, D., and Ominski, K.: Nitrous oxide and methane emis-sion from a coarse-textured grassland soil receiving hog slurry, Agr. Ecosys. Environ., 138, 35–43, 2010.
Tokida, T., Mizoguchi, M., Miyazaki, T., Kagemoto, A., Nagata, O., and Hatano, R.: Episodic release of methane bubbles from peatland during spring thaw, Chemosphere, 70, 165–171, 2007. Turetsky, M. R., Treat, C. C., Waldrop, M. P., Waddington, J.
M., Harden, J. W., and McGuire, A. D.: Short-term response of methane fluxes and methanogen activity to water table and soil warming manipulations in an Alaskan peatland, J. Geophys. Res.-Biogeosci., 113, G00A10, doi:10.1029/2007JG000496, 2008.
Updegraff, K., Bridgham, S. D., Pastor, J., Weishampel, P., and
Harth, C.: Response of CO2and CH4emissions from peatlands
to warming and water table manipulations, Ecol. Appl., 11, 311– 326, 2001.
Verville, J. H., Hobbie, S. E., Chapin, F. S., and Hooper, D. U.:
Response of tundra CH4and CO2flux to manipulation of
tem-perature and vegetation, Biogeochemistry, 41, 215–235, 1998. Webb, E. K., Pearman, G., and Leuning, R.: Correction of flux
mea-surements for density effects due to heat and water vapour trans-fer, Q. J. Roy. Meteorol. Soc., 106, 85–100, 1980.
Wille, C., Kutzbach, L., Sachs, T., Wagner, D., and Pfeiffer, E. M.: Methane emission from Siberian Arctic polygonal tundra: eddy covariance measurements and modeling, Glob. Change Biol., 14, 1395–1408, 2008.
Windsor, J., Moore, T. R., and Roulet, N. T.: Episodic fluxes of methane from subarctic fens, Can. J. Soil Sci., 72, 441–452, 1992.