www.ann-geophys.net/24/2403/2006/ © European Geosciences Union 2006
Annales
Geophysicae
3-D GCM modelling of thermospheric nitric oxide during the 2003
Halloween storm
A. L. Dobbin, E. M. Griffin, A. D. Aylward, and G. H. Millward
Atmospheric Physics Laboratory, Department of Physics and Astronomy, University College London, Gower street, London, WC1E 6BT, UK
Received: 4 January 2006 – Revised: 19 June 2006 – Accepted: 4 July 2006 – Published: 20 September 2006 Part of Special Issue “Twelfth EISCAT International Workshop”
Abstract. Numerical modelling of thermospheric tempera-ture changes associated with periods of high geomagnetic ac-tivity are often inaccurate due to unrealistic representation of nitric oxide (NO) densities and associated 5.3-µm radiative cooling. In previous modelling studies, simplistic param-eterisations of NO density and variability have often been implemented in order to constrain thermospheric tempera-ture predictions and post storm recovery timescales during and following periods of high auroral activity. In this pa-per we use the University College London (UCL) 3-D Cou-pled Thermosphere and Middle Atmosphere (CMAT) Gen-eral Circulation Model to simulate the 11-day period from 23 October to 3 November 2003, during which the Earth experienced some of the largest geomagnetic activity ever recorded; the so called “Halloween storm”. This model has recently been updated to include a detailed self consistent calculation of NO production and transport. Temperatures predicted by the model compare well with those observed by the UCL Fabry Perot Interferometer at Kiruna, northern Swe-den, when changes in solar and auroral activity are taken into account in the calculation of NO densities. The spatial dis-tribution of predicted temperatures at approximately 250-km altitude is also discussed. Simulated NO densities at approx-imately 110 km are presented. Large quantities of NO are found to be present at to the equator, one to two days after the most intense period of geomagnetic activity. This is the first 3-D GCM simulation of NO production and transport over the 2003 Halloween storm period.
Keywords. Atmospheric composition and structure (Thermosphere-composition and chemistry; Pressure, density, and temperature; Airglow and aurora)
Correspondence to: A. L. Dobbin ([email protected] )
1 Introduction
A well established link between auroral energy input and thermospheric nitric oxide (NO) concentration has been demonstrated by numerous observational and modelling studies (e.g. Gerard and Barth, 1977; Barth, 1992; Solomon et al., 1999; Baker et al., 2001; Barth et al., 2003; Dobbin et al., 2006). The abundance of high latitude NO is directly affected by the flux of precipitating electrons which act to ionise and dissociate molecular nitrogen. These processes result in enhanced concentrations of excited state atomic ni-trogen, which in turn leads to enhanced levels of NO pro-duction in the lower thermosphere. During periods of high geomagnetic activity, Joule heating also contributes to in-creased NO production via the temperature sensitive reaction between ground state atomic nitrogen and molecular oxy-gen. Enhancements in temperature and molecular oxygen density lead to excess NO at altitudes above 140 km. Siskind et al. (1989) and Richards (2004), suggested that mid lat-itude peak NO densities (occurring around 110 km) could be enhanced as excess NO created above 140 km diffuses to lower altitudes. Recent modelling and observational stud-ies suggest that meridional winds act to transport excess NO produced at auroral latitudes to both mid and low latitudes (Barth and Bailey, 2004; Barth et al., 2003; Dobbin et al., 2006). Considering the chemical and radiative properties of NO, the density distribution may give some indication of the temporal and spatial distribution of energy deposition in the thermosphere.
2404 A. L. Dobbin et al.: 3-D GCM modelling of thermospheric nitric oxide influences the collisional excitation of NO, which occurs
pri-marily via inelastic collisions with atomic oxygen. A change in the abundance of O is consequently accompanied by a change in the amount of excited NO molecules. Increases in the background temperature associated with Joule heat-ing can act to increase the rate of collisional excitation. Re-cent observations of infrared radiance by the SABER in-strument onboard the Thermosphere-Ionosphere Mesosphere Energetics and Dynamics (TIMED) satellite, show dramatic increases in 5.3-µm emission during periods of enhanced so-lar and geomagnetic activity (Mlynczak et al., 2003). In-creases in 5.3-µm cooling act to damp thermospheric tem-perature increases arising from increased geomagnetic activ-ity, and reduce timescales of temperature relaxation in the recovery phase of a storm.
From the processes described above, it follows that any attempt to simulate the thermal response of the atmosphere to auroral forcing, must include a reasonable representation of NO chemistry and transport. While numerous modelling studies of the response of the thermosphere and ionosphere to geomagnetic storms have been performed (e.g. Fuller-Rowell et al., 1994; Fuller-Rowell et al., 1996a; Fujiwara et al., 1996; Field et al., 1998; Burns et al., 2004), few have in-cluded a comprehensive self consistent calculation of NO production and transport. Maeda et al. (1989) used an em-pirical formula to derive a geomagnetic activity dependence for NO density in a zonally averaged thermospheric model. The study showed that the activity dependent variability of NO must be taken into account in order to reasonably sim-ulate both the response and recovery of thermospheric tem-peratures to changing geomagnetic activity. When auroral NO production was not included in their simulations of in-creased geomagnetic activity, the modelled temperature re-sponse was drastically overestimated. The simulated relax-ation time following subsidence of activity was also consid-erably slower than that of observations. Modelling studies of the ionospheric response to geomagnetic forcing also ex-hibit prolonged recovery times in simulated peak electron densities (NmF2) when odd nitrogen chemistry is not well represented (Fuller-Rowell et al., 2000). Wells et al. (1997) showed that when the effects of NO cooling were included in the CTIP model, via application of an “effective heating efficiency”, the representation of quiet time neutral temper-atures, composition and maximum plasma frequency (foF2) were substantially improved in the summer hemisphere.
The purpose of this paper is to describe the results of a GCM simulation of the 11-day period from 23 October to 3 November 2003 during which the Earth experienced one of the largest geomagnetic storms ever recorded, commonly referred to as the “Halloween storm”. The response of the thermosphere to this period of enhanced geomagnetic activ-ity has been simulated using the CMAT model which has re-cently been updated to include a fully self-consistent calcu-lation of odd nitrogen chemistry and transport (Dobbin et al., 2006; Dobbin, 2005). In order to assess the importance and
accuracy of the CMAT modelled NO densities on the ther-mal response and recovery of the thermosphere, two CMAT simulations have been performed. In the first, NO densities were calculated by the CMAT chemical scheme, taking into account activity dependent changes in solar and auroral NO production. The second simulation used CMAT NO densities calculated on the first day of the simulation when activity lev-els were low, for the full 11 day period. A brief description of the CMAT GCM is given in the next section, along with de-scriptions of the simulations performed. Comparison of sim-ulated temperatures at 250-km altitude with those measured by the University College London Fabry Perot Interferometer at Kiruna, northern Sweden (67.8◦N, 20.4◦E in geographic coordinates) are then presented. The horizontal distribution of temperature changes at 250-km altitude arising from the high energy forcing are presented in Sect. 4, followed by the time varying peak NO distribution (at 110-km altitude) cal-culated by the model. While there has been much speculation on the horizontal distribution of NO following high geomag-netic activity (Barth and Bailey, 2004; Marsh et al., 2004), no 3-D modelling simulations of a major storm event have been performed to date. These results comprise the first pre-dictions of the spatial and temporal distribution of NO over the “2003 Halloween storm”.
2 The CMAT GCM time-dependent storm simulation
The coupled middle atmosphere and thermosphere model (CMAT) is an extension of the University College Lon-don time dependent 3-D Coupled Thermosphere Ionosphere Plasmasphere (CTIP) model (see Fuller-Rowell et al., 1996b; Millward et al., 1996). The model solves the nonlinear equa-tions of energy, momentum and continuity on a model grid of 2◦ latitude, 18◦longitude and a third scale height, from 10 mbar (∼30 km) to 7.6 pbar (∼300–600 km). A compre-hensive mesosphere-thermosphere chemical scheme is in-cluded. Radiative cooling due to 5-µm emission from ex-cited NO is calculated as described in Kockarts (1980), with a collisional deactivation rate of 2.4×10⁻¹¹cm3s−1(Dodd et al., 1999). The model has been presented in detail in Har-ris (2001) and Dobbin (2005). A description of the version used in this study can be found in Dobbin et al. (2006).
The distribution of particle precipitation and energy flux in CMAT are taken from the statistical model of Fuller-Rowell and Evans (1987) and are based on the TIROS/NOAA au-roral particle measurements. Cross-polar-cap electric fields are taken from the model of Foster et al. (1986). Both auro-ral particle precipitation and cross-polar-cap electric fields are related to a power index (PI), as detailed in Evans et al. (1988). Using 3 hourly planetaryKpindex values (taken
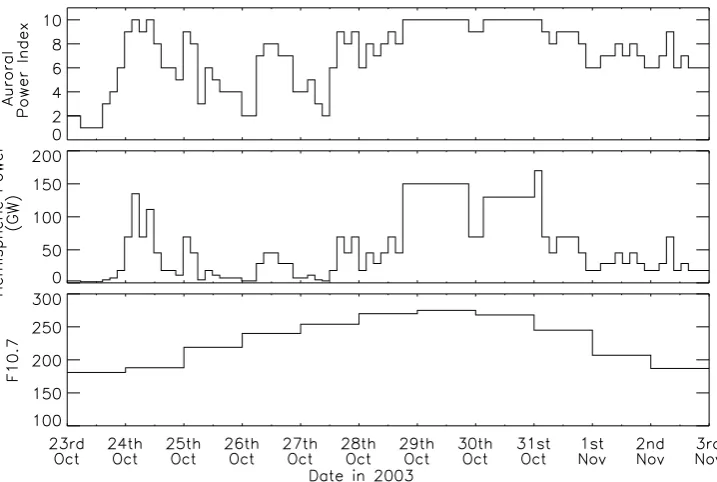
Fig. 1. Auroral power index, hemispheric power and F10.7 inputs used in the CMAT model for simulation of the period from 12:00 UT on 23 October to 12:00 UT on 3 November 2003.
of geomagnetic activity that included one of the largest geo-magnetic storms ever recorded. The PI time series was used to determine the flux, energy and distribution of particle pre-cipitation, along with patterns of high latitude convection fields used in the CMAT simulation. The extremely high
Kpvalues measured over the 29–31 October exceeded those
represented by the statistical patterns used in the model. For these levels of activity, precipitation and electric field pat-terns of the highest power index (10) were used along with enhanced values of the total hemispheric precipitating power input. The values of hemispheric power used were extrapo-lated from available data for lower levels of activity, as given by Foster et al. (1986), the total power input to a single hemi-sphere increasing exponentially with activity. The resulting convection patterns are the same shape to those derived from the highest PI value, but the cross-polar-cap potential and thus energy input is increased. The result is an increase in the magnitude of the electric fields used. The total ionisation rate due to particle precipitation is also increased in proportion to the increase in hemispheric power input. In order to main-tain model stability during prolonged periods of very high activity, the hemispheric power input was capped at 150 GW over the 29 and 30 October when the highest levels of ac-tivity were measured. The hemispheric power measured by the NOAA POES satellites during this time actually reached a maximum of 554.5 GW in the Northern Hemisphere. The average hemispheric power measured over this time period was 173 GW.
The daily solar flux inputs to the CMAT model are derived from the SOLAR2000 empirical model (Tobiska et al., 2000) and are based on the F10.7 proxy for solar activity, also taken from http://www.sec.noaa.gov. The time series of 3 hourly auroral power index and total hemispheric power inputs used in the CMAT simulations are shown in Fig. 1, along with F10.7 values used.
In order to demonstrate the impact of using activity depen-dent, self-consistently derived NO densities in the calculation of NO radiative cooling rates, a second CMAT run was con-ducted. In the first simulation, NO cooling was calculated using time-varying self consistently calculated NO densities, taking into account changes in solar and auroral production of NO. In the second however, the NO profile calculated for day 1 of the simulation period (23 October 2003) was used on all subsequent model days. Thus the abundance of NO was unchanged from day to day and unaffected by the changes in solar and auroral energy inputs. In the sections that follow, the first and second CMAT simulations will be referred to as having “variable” and “stable” NO densities respectively.
3 Neutral temperature over Kiruna
2406 A. L. Dobbin et al.: 3-D GCM modelling of thermospheric nitric oxide
Fig. 2. Neutral temperature at 250-km altitude over Kiruna, northen Sweden, from 12:00 UT on 23 October to 12:00 UT on 3 November 2003, as measured by the UCL FPI and as calculated by the CMAT GCM with daily varying (red line) and constant (blue line) NO densities.
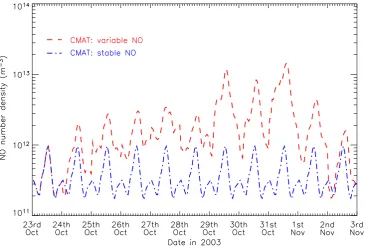
Fig. 3. Nitric oxide number density (m−3) at 250-km altitude over Kiruna, northern Sweden, from 12:00 UT on 23 October to 12:00 UT on 3 November 2003, as calculated by the CMAT GCM for the variable NO (red line) and stable NO (blue line) simulations.
wavelength, temperatures and winds at an altitude of around 250km can be derived (Aruliah et al., 2005). Neutral temperature measurements taken by the FPI at Kiruna be-tween 12:00 UT 23 October 2003 and 12:00 UT 3 November 2003 are shown in Fig. 2. Also shown are temperatures at
[image:4.595.116.482.355.605.2]rapid temperature changes occur in response to increases or decreases in geomagnetic activity.
For the first six days of the simulated period, the match between variability in measured and calculated temperatures is good for both CMAT model simulations. As expected, the temperatures predicted by both simulations are identical for the first 24 h of the simulation period, during which the NO concentrations are the same. This trend continues for a further 14 h, after which the temperature predicted by the “stable NO” run starts to increase over that predicted by the “variable NO” run. From this time onwards, temperatures predicted by the CMAT run with “stable” NO densities are higher than those predicted when “variable” NO densities are used. Figure 3 shows the NO number density at approx-imately 250-km altitude above Kiruna, as calculated by the CMAT model in each model simulation. For the “variable NO” simulation, increases in auroral energy input result in an increase in the abundance of high latitude NO. This in turn leads to an increase in the level of cooling due to 5.3µm radiative emission from collisionally excited NO. The dif-ference in temperatures predicted by the two CMAT simu-lations can therefore be attributed to the difference in NO cooling, arising from the enhanced concentrations of NO in the “variable NO” model run.
On 29 October, the 3-hourlyKpindex changed from 4◦,
for 03:00 UT to 06:00 UT, to 9◦, for 06:00 UT to 09:00 UT. Geomagnetic activity remained at extremely high levels un-til 15:00 UT on 31 October, after which a reasonably steady decrease to moderate activity occurred. Temperatures mea-sured by the FPI increased dramatically from around 1100 K at 04:00 UT to over 2000 K at 20:00 UT on 29 October. At 16:00 UT on 31 October, the observed temperature had re-laxed to around 1200 K. As activity levels continued to de-crease, so too did the observed temperature, which reached around 950 K at 00:00 UT on 3 November. For this pe-riod, temperatures predicted by the two CMAT simulations are dramatically different. The “variable NO” model run continues to show a diurnal cycle and although the very high temperatures measured on 29 and 30 October are not reached, the temperatures predicted by the model between 31 October and 3 November agree well with the FPI ob-servations. In contrast, the “stable NO” CMAT run pre-dicts an overall increase in temperature between 12:00 UT on 29 and 12:00 UT on 31 October, reaching a maximum of 1800 K, approximately 600 K greater than that measured by the FPI. The slow rate of thermal recovery that follows the very high activity of 29 to 31 October is a result of insuffi-cient NO cooling associated with the fixed low NO concen-tration. The realistic post storm thermal recovery predicted by the “variable NO” CMAT model run is thought to be a di-rect result of accurate calculation of NO concentrations and associated cooling.
As mentioned above, the very high temperatures measured by the FPI between 16:00 UT on 29 and 04:00 UT on 31 Oc-tober are not reproduced by the “variable NO” CMAT
simu-lation, which reaches a maximum of 1500 K on 29 October. This is the result of limitations in the statistical auroral en-ergy inputs to the model which do not account for the very high levels of geomagnetic activity encountered on those dates. Over periods of moderate to high geomagnetic activ-ity, such as occurred between 18:00 UT on 25 and 06:00 UT on 29 October, the magnitude and variability of the CMAT predicted temperatures are in good agreement with the FPI data.
4 Meridional variation in thermal response
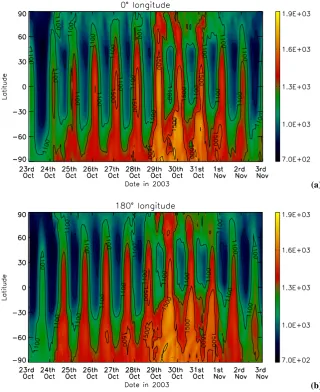
The neutral temperature at approximately 250 km calculated by the “variable NO” CMAT model simulation is shown as a function of geographic latitude and time in Fig. 4, for the period 12:00 UT on 23 October to 12:00 UT on 3 Novem-ber 2003. As described above, this simulation uses nitric oxide densities that have been calculated self consistently and updated every model time step, taking changes in ge-omagnetic and solar activity into account. Plots are shown for 0◦and 180◦longitude. The distribution of energy depo-sition will be different in each longitude sector, depending on the convection and particle precipitation patterns used. A detailed comparison of temperatures in the two plots would therefore be misleading. A qualitative view of the merid-ional extent of temperature enhancements in the two sectors can however be gained from each plot.
As might be expected, temperatures are generally greater in the Southern Hemisphere which is exposed to greater lev-els of solar radiation than the Northern Hemisphere at this time of year. Joule heating leads to high latitude tempera-ture enhancements in both hemispheres. The level of Joule heating is directly affected by changes in geomagnetic activ-ity and so therefore, is the temperature of the high latitude thermosphere. Increases of up to 450 K and 500 K occur in the high latitude Northern and Southern Hemispheres respec-tively in response to the dramatic changes in geomagnetic ac-tivity on 24 October. In the Northern Hemisphere, the auro-rally induced temperature changes are fairly localised and do not extend equatorward of about 60◦latitude. In the Southern Hemisphere, the offset between the geographic and geomag-netic poles is greater, meaning aurorally induced temperature enhancements extend further towards the equator, to around –40◦ latitude. Where increased Joule heating occurs in the day-lit sector of the Southern Hemisphere, temperature en-hancements are seen to extend all the way from the pole to the equator. Low and mid latitude locations undergo large increases in heating though the absorption of solar radiation. As expected, a correlation exists between thermospheric tem-perature and solar activity, via the F10.7 values used in the model.
2408 A. L. Dobbin et al.: 3-D GCM modelling of thermospheric nitric oxide
(a)
[image:6.595.136.457.63.456.2](b)
Fig. 4. CMAT calculated neutral temperature at 250-km altitude as a function of latitude and time at 0◦(a) and 180◦(b) longitude. The time axis covers the period from 12:00 UT 23 October to 12:00UT 3 November 2003. Contour intervals are every 200K.
region reach up to 1750 K. In the Northern Hemisphere, tem-peratures of just under 1600 K are predicted. Very high lev-els of solar heating result from the large F10.7 values used to determine solar flux inputs to the model. As a result, equa-torial temperatures reach over 1600 K. At 180◦longitude in the Southern Hemisphere, aurorally induced temperature en-hancements reach within 10◦ latitude of the equator in the
early hours of 1 November. While expansion of the auroral oval will contribute to the equatorward spread of Joule heat-ing, the large temperatures predicted at these low latitudes are almost certainly the result of transport. Strong merid-ional winds are induced by pressure gradients that result from Joule heating. These winds act to transport energy and chem-ical constituents to lower latitudes (e.g. Fuller-Rowell et al., 1994).
5 Evolution of nitric oxide distribution
Figure 5 shows the nitric oxide number densities calculated by the “variable NO” CMAT simulation at approximately 110-km altitude as a function of geographic latitude and time. Plots are shown for 0◦and 180◦longitude. The time series covers the period from 12:00 UT on 23 October to 12:00 UT on 3 November 2003. Different scales have been used for the 0◦ and 180◦ longitude plots so as to ensure
(a)
[image:7.595.133.461.65.473.2](b)
Fig. 5. CMAT calculated nitric oxide number density (×1014m−3) at approximately 110km altitude as a function of latitude and time at 0◦ (a) and 180◦(b) longitude. The time axis covers the period from 12:00 UT 23 October to 12:00 UT 3 November 2003. Contour intervals are every 1.5×10¹⁴m−3.
Hemisphere polar lower mesosphere. In the middle to up-per mesosphere, maximum enhancements were observed be-tween 30 and 31 October.
The concentrations of NO at high latitudes are greater than those at low latitudes due to enhanced production of NO associated with particle precipitation. Peak densities in the Northern Hemisphere occur closer to the pole than those in the south. This is a result of the increased offset between geo-graphic and geomagnetic poles in the Southern Hemisphere. The NO abundance clearly responds to changes in geomag-netic activity. At 0◦longitude, maximum concentrations of just under 9.0×10¹⁴m−3occur in the Southern Hemisphere between –30◦and –40◦geographic latitude, around midday on the 31 October and 1 November. On the same dates,
maxima of nearly 14×1014m−3are predicted to exist in the Southern Hemisphere at 180◦ longitude, between –10◦ and –30◦ latitude. The maxima occur between 12:00 UT and 22:00 UT. While the greatest increases in temperature oc-curred very rapidly after changes in geomagnetic activity, the maximum NO concentrations occur one to two days after the onset of a period of high activity.
2410 A. L. Dobbin et al.: 3-D GCM modelling of thermospheric nitric oxide
(a)
[image:8.595.136.461.66.444.2](b)
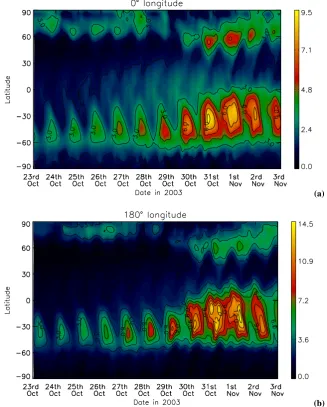
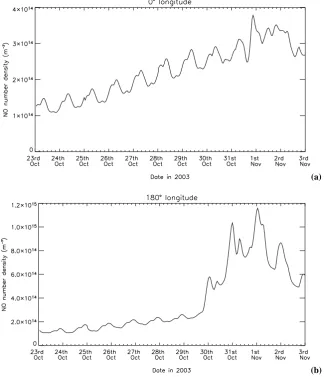
Fig. 6. Equatorial nitric oxide number density (m−3) at approximately 110-km altitude, for 0◦(a) and 180◦(b), as calculated by the CMAT model for the period 12:00 UT 23 October to 12:00 UT 3 November 2003.
that longitudinal differences in the spatial distribution and strength of these energy inputs will result in different NO concentrations. Photodissociation by solar UV is a primary NO destruction mechanism. The amount of time for which NO is exposed to day light has an important effect on its life-time and availability for transport. As discussed in Dobbin et al. (2006), the time lag in the maximum response of NO density to high energy auroral forcing is dependent on geo-graphic location in relation to the region of energy input, and possibly the local time at which auroral forcing occurs.
For the time period modelled here, the high latitude re-gions of the Northern Hemisphere are less affected by so-lar radiation than equivalent latitudes in the Southern Hemi-sphere. This means the effects of aurorally produced NO can be more easily recognized than in the Southern Hemisphere where the sources of NO production are indistinguishable. The geographic latitudes at which NO maxima occur in the
Northern Hemisphere range between 80◦on the 28 October, and 50◦on the 31 October. The peak clearly moves towards the equator as geomagnetic activity is increased. Expansion of the auroral oval will contribute to this equatorward pro-gression, as will transport of NO by strong meridional winds and diffusion of NO from above.
At mid and low latitudes, the calculated concentrations of NO increase dramatically over the simulation period. Figure 6 shows the equatorial NO number density at approx-imately 110-km altitude for 0◦and 180◦longitude. The
input to the model, as determined by the F10.7. At around 22:00 UT on 23 and 29 October, peaks in the NO density of 1.5 and 2.9×10¹⁴m−3are predicted. The F10.7 values used on these dates are 181 and 275, respectively (see Fig. 1). On 1 November, a peak NO number density of just under 3.3×10¹⁴m−3is predicted to occur at around 08:00 UT. The F10.7 used for this day was 245. The fact that this large NO peak is created at 08:00 UT on a day when the trend in F10.7 is downward indicates that there is a significant contribution from aurorally produced NO.
At 180◦longitude, the equatorial NO density also displays a strong diurnal variability from 23 to 29 October, with peak NO densities of 1.5 and 2.6×10¹⁴m−3 occurring close to 10:00 UT on the 24 and 29 October respectively. In the early hours of 30 October, a large increase in NO density is pre-dicted, approximately 20 h after the start of the very intense storm period. By 12:00 UT on 1 November, the NO density has reached a peak of 11.6×10¹⁴m−3. This very high num-ber density is attributed to aurorally produced NO that has been transported from high to low latitudes, and to the down-ward diffusion of NO produced above 140 km. While the equatorial NO density does start to drop after this peak, large concentrations are still present at the end of the simulation period.
6 Conclusions
The UCL CMAT GCM has been used to simulate the period from 12:00 UT on 23 October to 12:00 UT on 3 November 2003, during which the Earth experienced extremely high levels of geomagnetic activity. Neutral temperatures calcu-lated by the CMAT model in two simulations were compared with FPI measurements made in Kiruna in northern Sweden. The first simulation used time varying, activity dependent NO densities, as calculated by the CMAT chemical scheme. The second used quiet time, diurnally repeatable NO densi-ties. The magnitude and variability of the CMAT predicted temperatures matched the FPI data well when activity depen-dent NO densities were used, although the very high temper-atures recorded at the peak of the largest storm were under-estimated by the model. When the NO concentration was maintained at a quiet time daily profile, temperatures pre-dicted were higher than those observed and the timescales of post-storm recovery were overestimated. The improved tem-perature variability modelled by CMAT with variable NO is attributed to the inclusion of realistic self-consistent calcula-tion of NO concentracalcula-tion and associated radiative cooling.
The meridional distribution of temperature enhancements resulting from the geomagnetic storm at approximately 250-km altitude has been assessed. For the dates in ques-tion, high latitudes in the Northern Hemisphere are less in-fluenced by solar radiation than the equivalent latitudes in the south. Temperatures are therefore generally greater in the south than in the north. High latitude temperatures
re-spond to changes in geomagnetic activity as the associated level of Joule heating changes. In the Northern Hemisphere, temperature changes associated with the rapid increase in ge-omagnetic activity on 24 October are restricted to latitudes poleward of about 60◦ geographic latitude. In the Southern Hemisphere, aurorally induced temperature enhancements remain at latitudes poleward of about –40◦ latitude. Dur-ing the period of maximum activity from 29 to 31 Octo-ber, CMAT predicted temperatures reached up to 1750 K and 1600 K in the Southern and Northern Hemispheres, respec-tively. Aurorally induced temperature enhancements reached 10◦south of the equator in the early hours of 1 November. This is the result of strong meridional winds associated with high levels of Joule heating. Increases in the F10.7 solar ac-tivity proxy throughout the first 7 days of the simulation lead to enhanced equatorial temperatures of up to 1600 K.
Nitric oxide number densities at the peak altitude of 110 km respond to changes in the solar and geomagnetic en-ergy inputs. The magnitude and location of NO density peaks are highly variable, depending on location with respect to the auroral oval, transport of NO by meridional winds, diffusion of NO from altitudes above 140 km and changes in solar flux and particle precipitation inputs. The latitude at which max-ima occur moves towards the equator as geomagnetic activity increases and the auroral oval expands. Maximum concen-trations modelled by the CMAT model reach just less than 14×1014m−3and occur between –10◦and –30◦geographic latitude, 180◦ longitude in the Southern Hemisphere. The peaks in NO concentration occur one to two days after the onset of a period of high activity.
Prior to the large increases in geomagnetic activity seen on the 29 October, equatorial NO densities are largely controlled by diurnal variations in the solar energy input. A steady in-crease in low latitude NO abundance occurs over the simula-tion period as a result of increases in solar activity, described by the F10.7 proxy. Enhancements in the equatorial NO bud-get start to occur 1 day after the onset of the strongest storm forcing, depending on location. These enhancements arise as NO produced at high latitudes is transported equatorward by strong meridional winds. A contribution from downward diffusion of NO is also possible. Maximum equatorial NO densities of 3.3 and 11.6×10¹⁴m−3are predicted to occur at 08:00 UT and 12:00 UT on 1 November, at longitudes of 0◦ and 180◦, respectively.
Acknowledgements. The research was supported by grants from the U.K. Particle Physics and Astronomy Research Council (PPARC). The CMAT simulations were carried out on the Enigma supercom-puter at the UCL HiPerSPACE computing centre, which is funded by PPARC. SOLAR2000 Research Grade V2.27 historical irradi-ances are provided courtesy of W. K. Tobiska and SpaceWx. These historical irradiances have been developed with funding from the NASA UARS, TIMED, SOHO, and SDO missions as well as the JSDAP and LWS programs.
2412 A. L. Dobbin et al.: 3-D GCM modelling of thermospheric nitric oxide References
Aruliah, A. L., Griffin, E. M., Aylward, A. D., Ford, E. A. K., Kosch, M. J., Davis, C. J., Howells, V. S. C., Pryse, S. E. , Mid-dleton, H. R., and Jussila, J.: First direct evidence of meso-scale variability on ion-neutral dynamics using co-located tristatic FPIs and EISCAT radar in Northern Scandinavia, Ann. Geo-phys., 23, 147–162, 2005,
http://www.ann-geophys.net/23/147/2005/.
Baker, D. N., Barth, C. A., Mankoff, K. E., Kanekal, S. G., Bailey, S. M., Mason, G. M., and Mazur, J. E.: Relationship between precipitating auroral zone electrons and lower thermopsheric ni-tric oxide densities: 1998–2000, J. Geophys. Res., 106 (A11) 24 465–24 480, 2001.
Barth, C. A.: Nitric Oxide in the Lower Thermosphere, Planet. Space. Sci., 40, No 2/3, 315–336, 1992.
Barth, C. A. and Bailey, S. M.: Comparison of a thermospheric pho-tochemical model with Student Nitric Oxide Explorer (SNOE) observations of nitric oxide, J. Geophys. Res., 109, A03304, doi:10.1029/2003JA010227, 2004.
Barth, C. A., Mankoff, K. D., Bailey, S. M., and Solomon, S. C.: Global Observations of Nitric Oxide in the Thermosphere, J. Geophys. Res., 108 (A1), 1027, doi:10.1029/2002JA009458, 2003.
Burns, A. G., Killeen, T. L., Wang, W., and Roble, R. G.: The solar-cycle-dependent response of the thermosphere to geomagnetic storms, J. Atmos. Sol. Terr. Phys., 66, 1–14, 2004.
Dobbin, A. L.: Modelling studies of possible coupling mechanisms between the upper and middle atmosphere, Ph.D. Thesis, Uni-versity of London, London, UK, 2005.
Dobbin, A. L., Aylward, A. D., and Harris, M. J.: 3D GCM Model-ing of nitric oxide in the lower thermosphere, J. Geophys. Res., 111, A07314, doi:10.1029/2005JA011543, 2006.
Dodd, J. A., Lockwood, R. B., Hwang, E. S., Miller, S. M., and Lip-son, S. J.: Vibrational relaxation of NO(ν=1) by oxygen atoms, J. Chem. Phys. 111, 3498–3507, 1999.
Evans, D. S., Fuller-Rowell, T. J., Maeda, S., and Foster, J. C.: Specification of the heat input to the thermosphere from mag-netic proceses using TIROS/NOAA auroral particle observa-tions, Advances in Astronautical Science, 65, 1649–1667, 1988. Field, P. R., Rishbeth, H., Moffett, R. J., Idenden, D. W., Fuller-Rowell, T. J., Millward, G. H., and Aylward, A. D.: Mod-elling composition changes in F-layer storms, J. Atmos. Sol. Terr. Phys., 60, 5, 523–543, 1998.
Foster, J. C., Holt, J. M., Musgrove, R. G., and Evans, D. S.: Iono-spheric convection associated with discrete levels of particle pre-cipitation, Geophys. Res. Lett., 13, 656–659, 1986.
Fuller-Rowell, T. J. and Evans, D. S.: Height-integrated Pedersen and Hall conductivity patterns inferred from the TIROS-NOAA satellite data, J. Geophys. Res., 92, 7606, 1987.
Fuller-Rowell, T. J., Codrescu, M. V., Moffett, R. J., and Quegan, S.: Response of the thermosphere and ionosphere to geomagnetic storms. J. Geophys. Res., 99 (A3), 3893–3914, 1994.
Fuller-Rowell, T. J., Codrescu, M. V., Risbeth, H., Moffett, R. J., and Quegan, S.: On the seasonal response of the thermosphere and ionosphere to geomagnetic storms, J. Geophys. Res., 101 (A2), 2343–2353, 1996a.
Fuller-Rowell, T. J., Rees, D., Quegan, S., Moffett, R. J., Codrescu, M. V., and Millward, G. H.: A coupled thermosphere ionosphere model (CTIM), Solar terrestrial energy program (STEP), Hand-book of ionospheric models, edited by: Schunk, R. W., 1996b.
Fuller Rowell, T. J., Codrescu, M. V., and Wilkinson, P.: Quantita-tive modeling of the ionospheric response to geomagnetic activ-ity, Ann. Geophys., 18, 766–781, 2000,
http://www.ann-geophys.net/18/766/2000/.
Fujiwara, H., Maeda, S., Fukunishi, H., Fuller-Rowell, T. J., and Evans, D. S.:Global variations of thermospheric winds and tem-peratures caused by substorm energy injection, J. Geophys. Res., 101(A1), 225–240, 1996.
Gerard, J. C. and Barth, C. A.: High-latitude nitric oxide in the lower thermosphere, J. Geophys. Res., 82, 674–680, 1977. Harris, M. J.: A new coupled middle atmosphere and thermosphere
circulation model: Studies of dynamic, energetic and photo-chemical coupling in the middle and upper atmosphere, PhD. Thesis, University of London, 2001.
Jackman, C. H., DeLand, M. T., Labow, G. J., Fleming, E. L., Weisenstein, D. K., Ko, M. K. W., Sinnhuber, M., and Russell, J. M.: Neutral atmospheric influences of the solar proton events in October–November 2003, J. Geophys. Res., 110, A09S27, doi:10.1029/2004JA010888, 2005.
Kockarts, G.: Nitric Oxide Cooling in the terrestrial Thermosphere, Geophys. Res. Lett., 7, No. 2, 137–140, 1980.
Maeda, S., Fuller-Rowell, T. J., and Evans, D. S.: Zonally averaged dynamical and compositional response of the thermosphere to auroral activity during September 18–24, 1984, J. Geophys. Res., 94, 16 869–16 883, 1989.
Maeda, S., Fuller-Rowell, T. J., and Evans, D. S.: Heat budget of the thermosphere and temperature variations during the recov-ery phase of a geomagnetic storm, J. Geophys. Res., 97 (A10), 14,947–14,957, 1992.
Marsh, D. R., Solomon, S. C., and Reynolds, A. E.: Empirical model of nitric oxide in the lower thermosphere, J. Geophys. Res., 109, A07301, doi:10.1029/2003JA010199, 2004.
Millward, G., Moffett, R. J., Quegan, S., and Fuller-Rowell, T. J.: A Coupled Thermosphere-Ionosphere-Plasmasphere Model (CTIP), Solar Terrestrial Energy Program (STEP) Handbook, edited by: Schunk, R. W., 1996.
Mlynczak, M., Martin-Torres, F. J., Russell, J., et al.: The natural thermostat of nitric oxide emission at 5.3µm in the thermosphere observed during the solar storms of April 2002, Geophys. Res. Lett., 30(21), 2100, doi:10.1029/2003GL017693, 2003. Richards, P. G.: On the increase in nitric oxide density at
mid-latitudes during ionospheric storms, J. Geophys. Res., 109, doi:10.1029/2003JA010110, 2004.
Siskind, D. E., Barth, C. A., and Roble, R. G.: The response of ther-mospheric nitric oxide to an auroral storm: 1. Low and middle latitudes, J. Geophys. Res., 94(A12), 16 885–16 898, 1989. Solomon, S. C., Barth, C. A., and Bailey, S. M.: Auroral production
of nitric oxide measured by the SNOE satellite, Geophys. Res. Lett., 26, 1259–1262, 1999.
Tobiska, K. W., Woods, T., Eparvier, F., Viereck, R., Floyd, L., Bouwer, D., Rottoman, G., and White, O. R.: The SOLAR2000 empirical solar irradiance model and forecast tool, J. Atmos. Sol. Terr. Phys., 62, 1233–1250, 2000.
Wells, G. D., Rodger, A. S., Moffett, R. J., Bailey, G. J., and Fuller-Rowell, T. J.: The effects of nitric oxide cooling and the photodissociation of molecular oxygen on the thermo-sphere/ionosphere system over the Argentine Islands, Ann. Geo-phys., 15, 355–365, 1997,