www.ann-geophys.net/33/1349/2015/ doi:10.5194/angeo-33-1349-2015
© Author(s) 2015. CC Attribution 3.0 License.
Interhemispheric structure and variability of the 5-day planetary
wave from meteor radar wind measurements
H. Iimura1, D. C. Fritts1, D. Janches2, W. Singer3, and N. J. Mitchell4 1GATS Inc., Boulder, Colorado, USA
2Space Weather Lab., GSFC/NASA, Goddard, Maryland, USA
3Leibniz-Institute of Atmospheric Physics, University of Rostock, Kühlungsborn, Germany 4Department of Electronic and Electrical Engineering, The University of Bath, Bath, UK
Correspondence to: H. Iimura ([email protected])
Received: 20 February 2015 – Revised: 13 October 2015 – Accepted: 14 October 2015 – Published: 6 November 2015
Abstract. A study of the quasi-5-day wave (5DW) was per-formed using meteor radars at conjugate latitudes in the Northern and Southern hemispheres. These radars are located at Esrange, Sweden (68◦N) and Juliusruh, Germany (55◦N) in the Northern Hemisphere, and at Tierra del Fuego, Ar-gentina (54◦S) and Rothera Station, Antarctica (68◦S) in the Southern Hemisphere. The analysis was performed us-ing data collected durus-ing simultaneous measurements by the four radars from June 2010 to December 2012 at altitudes from 84 to 96 km. The 5DW was found to exhibit significant short-term, seasonal, and interannual variability at all sites. Typical events had planetary wave periods that ranged be-tween 4 and 7 days, durations of only a few cycles, and infre-quent strongly peaked variances and covariances. Winds ex-hibited rotary structures that varied strongly among sites and between events, and maximum amplitudes up to∼20 m s−1. Mean horizontal velocity covariances tended to be largely negative at all sites throughout the interval studied.
Keywords. Meteorology and atmospheric dynamics (Mid-dle atmosphere dynamics)
1 Introduction
The quasi-5-day planetary wave (hereafter 5DW) in the atmosphere, which has an observed period varying from ∼4 to 7 days, has been analyzed in various data span-ning more than 4 decades. These include sea-surface pres-sure (Madden and Jullian, 1972), temperature (Mechoso and Hartmann, 1982; Prata, 1989; Rogers, 1976), stratospheric height and thickness (Hirota and Hirooka, 1984),
geopoten-tial height (Lawrence and Randel, 1996), mesospheric air-glow (Sivjee et al., 1994), and winds in the mesosphere and lower-thermosphere (MLT) (Clark et al., 2002; Jiang et al., 2008; Wu et al., 1994). 5DW influences have also been ob-served in stratospheric ozone (Belova et al., 2008a, b, 2009; Rosenlof and Thomas, 1990), water vapor mixing ratio (Son-nermann et al., 2008), chemical species (Pendlebury et al., 2008), polar mesosphere summer echoes (PMSEs) (Kirk-wood et al., 2002), mesospheric temperature (von Savigny et al., 2007), noctilucent clouds (NLCs) or polar mesospheric clouds (PMCs) (Merkel et al., 2003, 2008; Nielsen et al., 2010), and ionospheric parameters (Fraser, 1977; Kokourov et al., 2009; Takahashi et al., 2006). Hough function theory predicts that the 5DW corresponds the first symmetric nor-mal mode westward-propagating Rossby wave with (s,n– s)=(1, 1), wheresis a zonal wavenumber andnis a merid-ional index (Forbes, 1995; Pedatella et al., 2012). (2, 1), (1, 2), and (1, 3) correspond the 4-, 10-, and 16-day waves, re-spectively (Longuet-Higgins, 1968; Salby, 1981a, b, 1984).
Lieberman et al. (2003) suggested that the 6.5-day wave is amplified by instability of the mesospheric winds. Rig-gin et al. (2006) concluded that the 5DW is generated in the winter hemisphere, leading to cross-equatorial propa-gation into the summer hemisphere, where it is amplified by baroclinic instability, based on an analysis of data ob-tained using the Sounding of the Atmosphere using the Broadband Emission Radiometry (SABER) instrument on-board the Thermosphere-Ionosphere-Mesosphere Energetics and Dynamics (TIMED) satellite and MLT radars. Finally, Miyoshi and Hirooka (1999) proposed that heating due to moist convection is an important 5DW source and this was subsequently confirmed using lightning data by Chronis et al. (2007).
Using TIMED/SABER temperature measurements, Pancheva et al. (2010) reported that the 5DW amplitude increased with altitude and maximized at midlatitudes near equinoxes with a latitudinally symmetric structure. Their analysis suggested that mean amplitudes are larger in the Northern Hemisphere, but with significant interannual vari-ability. Riggin et al. (2006) addressed the global structure of the 5DW in May 2003 and found larger amplitudes in the Northern Hemisphere with a maximum at lower altitudes than in the Southern Hemisphere. Wu et al. (1994) used UARS/HRDI wind measurements between May 1992 and June 1994 to infer a 5DW amplitude that was larger in the zonal component than in the meridional component, with both exhibiting a Rossby (1, 1) structure at low and middle latitudes. They also noted that 5DW amplitudes were larger in the summer hemisphere when the response was anti-symmetric about the equator. Similarly, Hirooka (2000) analyzed the 5DW in November in geopotential height using the Improved Stratosphere and Mesosphere Sounder (ISAMS) onboard UARS and reported larger amplitudes in the Southern Hemisphere than in the Northern Hemisphere.
MLT radar wind measurements have also been used by various authors for 5DW and 6.5-day wave studies. Kovalam et al. (1999) demonstrated that the 6.5-day wave is west-ward propagating with zonal wavenumber 1 and has an en-hanced amplitude in April and September using MF radars at the equatorial sites of Pontianak (0◦, 109◦E) and Christmas Island (2◦N, 157◦W). The 6.5-day wave at Pontianak and Christmas Island was compared with that observed at Yama-gawa (32◦N, 131◦E) by Isoda et al. (2002), and all yielded similar enhancements from mid-April to mid-May. Kishore et al. (2004) reported an enhancement of the 6.5-day wave from September to October, as well as from April to May, es-pecially in the zonal component employing MF radar winds at Tirunelveli (9◦N, 78◦E). Lima et al. (2005) observed the 6.5-day wave using a meteor radar at Cachoeira Paulista (23◦S, 45◦W) and found significant interannual variability in the zonal component, with maximum amplitudes occur-ring from winter to spoccur-ring. Jiang et al. (2008) employed radar winds at six low- and mid-latitude sites and concluded that enhancement of the 6.5-day wave from April to May is a
global-scale phenomenon, maximizing at subequatorial lati-tudes in the Northern Hemisphere. Furthermore, Kishore et al. (2006) employed stratospheric temperature measurements by a Rayleigh lidar at Gadanki (14◦N, 79◦E) and confirmed a stronger 6.5-day wave at lower altitudes than in the MLT.
The 5DW observed at Bear Lake Observatory (42◦N, 111◦W) by Day et al. (2012) using a meteor radar exhibited enhancements in winter and late summer. In contrast, Mer-zlyakov et al. (2013) found a strong response of the 5DW in autumn using a meteor radar at Obninsk (55◦N, 37◦E). Most ground-based measurements to date have occurred in the Northern Hemisphere, hence assessments of interhemi-spheric variability of the 5DW have been limited. One study by Day and Mitchell (2010) employing meteor radar winds at Esrange (68◦N, 21◦E), Sweden, and Rothera Station (68◦S, 68◦W), Antarctica found similar wave activity in each
hemi-sphere, with enhanced amplitudes in winter and late summer in each case.
Here, we further explore interhemispheric variability of the 5DW at middle and high latitudes determined from meteor radar winds at four nearly conjugate Northern and Southern Hemisphere sites. Section 2 describes our measure-ments and analysis methodology. Section 3 describes repre-sentative results. Our discussion and summary are presented in Sects. 4 and 5.
2 Measurements and data analysis 2.1 Meteor radars
The 5DW was analyzed employing meteor radar wind mea-surements at four sites: Esrange, Juliusruh (55◦N, 14◦E), Tierra del Fuego (TdF, 54◦S, 68◦W), and Rothera Sta-tion. All of these radars are All-Sky Interferometric Me-teor Radars (SkiYMet) (Hocking and Vandepeer, 2001). De-tails of the individual systems are provided by Mitchell et al. (2002), Day and Mitchell (2010), and Sandford et al. (2010) for the Esrange system, Singer et al. (2003) and Hoffmann et al. (2010) for the Juliusruh system, Fritts et al. (2010, 2012) for the TdF system, and Younger et al. (2002) and Mitchell and Beldon (2009) for the Rothera system.
The TdF radar began operations most recently, in May 2008. The Esrange radar suffered an interruption of mea-surements from March 2009 to June 2010. Given this, 5DW analysis efforts focused on the interval from 4 June 2010 to 31 December 2012. During this interval, only brief interrup-tions of data acquisition occurred: from 30 April to 15 May 2011 and from 22 October to 8 November 2012 at Esrange, from 17 February to 4 March 2012 at Juliusruh, and from 9 February to 1 March 2011 at TdF.
2.2 Analysis methodology
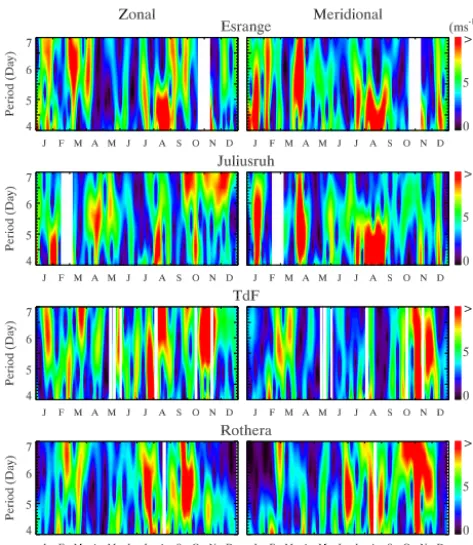
Figure 1. S-transform amplitudes for periods between 4 and 7 days
from hourly mean zonal (left) and meridional (right) winds at 90 km for 2012. Esrange, Juliusruh, Tierra del Fuego, and Rothera are from top to bottom.
al. (2012) for 3 km altitude intervals centered from 84 to 96 km. Hourly wind estimates were judged useful if there were at least five meteor echoes with radial velocities less than 150 m s−1and zenith angles between 10 and 70◦. While Fritts et al. (2012) restricted data to zenith angles between 15 and 50◦, we accepted more echoes by widening the zenith an-gle range in the current analysis, yielding increases of 100 % for Esrange, 110 % for Juliusruh, 60 % for TdF, and 90 % for Rothera, compared to Fritts et al. (2012). However, we have confirmed that results of our 5DW analysis do not ex-hibit large differences between the two ranges of zenith an-gles. Mean echo counts per hour at 90 km were 29 for Es-range, 86 for Juliusruh, 163 for TdF, and 52 for Rothera. Mean standard deviations of hourly mean winds were 8.6, 6.9, 7.5, and 8.6 m s−1, respectively. 5DW fits were deter-mined using a band pass filter with 3dB points at periods of 4.375 and 7.0 days. We have confirmed that structure of the resulting 5DW in the horizontal wind fields was identical with and without considering vertical winds in a determina-tion of hourly winds.
[image:3.612.49.286.65.338.2]3 Results 3.1 S-transforms
Figure 1 shows S-transform amplitudes in a period range be-tween 4 and 7 days from hourly mean zonal and meridional winds at 90 km for the four sites during 2012. For the zonal wind, the S-transforms exhibit unique features at each site. Oscillations at periods > 5 days had amplitudes > 10 m s−1 in late January, early March and April, and early and late September at Esrange. Additionally, oscillations at periods < 5.5 days were enhanced in July and August. At Juliusruh, amplitude enhancements with > 10 m s−1 occurred at peri-ods < 5 days from late January to early February, early Au-gust, and mid-October and at periods centered near 5.5 days in April. From late September to mid-December, oscillations at periods > 6 days also had large amplitudes with > 10 m s−1. At TdF, amplitudes were enhanced with > 10 m s−1at pe-riods > 5 days in January, March, August, and from late Oc-tober to mid-November, and at periods < 6.5 days during late July. Amplitudes with > 10 m s−1 were also at periods > 6 days in late February, < 6.5 days in July, and > 4.5 days from late September to mid-October at Rothera.
Primary periods of the meridional wind oscillations were < 6.5 days in mid-January, the full range from 4 and 7 days in April, and < 5.5 days in mid-July, August to early Septem-ber, mid-NovemSeptem-ber, and mid-December at the two sites in the Northern Hemisphere. Amplitude enhancements at peri-ods from 4 to 7 days were observed in early February only at Esrange. In the Southern Hemisphere, large amplitudes oc-curred at periods from 4 to 7 days from October to November. Additional amplitude enhancements were observed only at Rothera in summer. We note, in particular, that S-transforms of the meridional winds exhibit significant similarities in the same hemisphere, but differences between the hemispheres, suggesting that the anti-symmetric modes with respect to the equator appear to be major contributors to the large-scale wind fields.
3.2 Variances and horizontal momentum fluxes
Figure 2. 5-day mean variances of the 5DW as a function of altitude
between 84 and 96 km over Esrange, Juliusruh, Tierra del Fuego, and Rothera from top to bottom.
were larger at midlatitudes than at high latitudes in both hemispheres. Maxima at midlatitudes occurred earlier than at high latitudes (late July to early August at Juliusruh and mid-August at Esrange in the Northern Hemisphere, and mid- to late-July at TdF, and late July to early August at Rothera in the Southern Hemisphere). In 2012, variances were enhanced at all sites and the enhancements lasted to September. Max-ima occurred in late July at TdF, early August at Esrange, late August at Juliusruh, and early September at Rothera. There-fore, enhancements of 5DW variances during the Northern Hemisphere summer can be regarded as symmetric with re-spect to the equator, however latitudinal structure in a hemi-sphere was different for each year.
Variances > 100 m2s−2were observed in November 2010, and January and April 2012 only in the Northern sphere, and in November 2012 only in the Southern Hemi-sphere. Due to missing data in February 2011 at TdF and in February 2012 at Juliusruh, it is impossible to estimate lati-tudinal symmetry during these intervals.
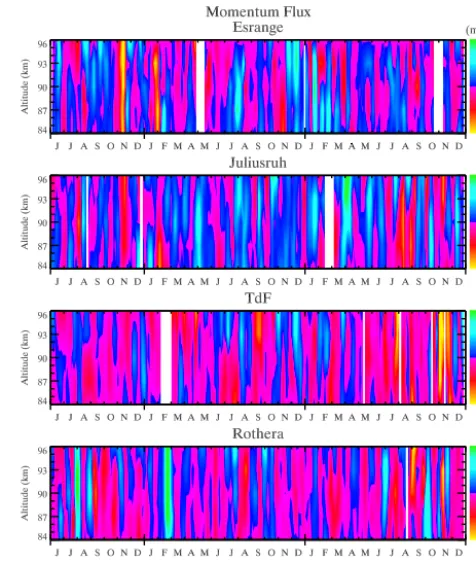
[image:4.612.49.283.66.351.2]Figure 3 shows 5DW horizontal momentum fluxes, <u0v0> (where brackets donate a 5-day average) at the four sites. In all cases, positive momentum fluxes indicate north-ward transport of eastnorth-ward momentum. This figure shows that 80 % of momentum fluxes are within ±15 m2s−2 and there are not clear intervals showing interhemispherically
Figure 3. 5-day mean horizontal momentum fluxes of the 5DW as a
function of altitude between 84 and 96 km over Esrange, Juliusruh, Tierra del Fuego, and Rothera from top to bottom.
symmetric or anti-symmetric structure. However, there are multiple occasions when large positive or negative fluxes oc-cur, and these most often accompany the large variances seen in Fig. 2. These include July and August for the 3 years, November 2010 and 2012, February 2011, and January and April 2012.
For the intervals from July to August, the momentum flux in 2010 achieved a maximum of 62 m2s−2at 93 km in late July at Rothera followed by a maximum of 35 m2s−2 at 96 km at Esrange and 30 m2s−2at 90 km in mid-August at Juliusruh. The momentum flux in early August 2011 was anti-symmetric, achieving maxima of 46 m2s−2at 87 km at Esrange and 31 m2s−2at 93 km at Juliusruh. For the North-ern Hemisphere summer in 2012, large momentum fluxes were observed at midlatitudes in both hemispheres. Posi-tive maxima were observed at upper altitudes in late July and mid-August at Juliusruh, and negative maxima were ob-served at lower altitudes in early and late August. A negative maximum was also observed at upper altitudes in late July at TdF. The second positive maxima at Juliusruh and nega-tive maxima at TdF in 2012 coincide with variance maxima shown in Fig. 2.
Figure 4. Hourly 5DW winds at altitudes between 84 and 96 km
for July and August of 2010 (left), 2011 (center), and 2012 (right) over Esrange, Juliusruh, Tierra del Fuego, and Rothera from top to bottom. Zonal and meridional winds are in black and red.
November 2012 at TdF and Rothera. These coincide with anti-symmetric variances shown in Fig. 2. When variances maximized in late November 2012 at TdF and Rothera, momentum fluxes showed large negative and positive values at TdF and Rothera, respectively. In contrast, when variances were enhanced in January and April 2012 in the Northern Hemisphere momentum fluxes were large and positive at both Esrange and Juliusruh.
3.3 Interannual variability
[image:5.612.309.545.68.249.2]Hourly 5DW zonal and meridional winds from 84 to 96 km at the four sites are displayed in Fig. 4 for July and August of 2010 to 2012 to illustrate its interannual variability. In 2010, the 5DW exhibited larger amplitudes at higher latitudes be-ginning in mid- to late-July, somewhat smaller amplitudes at lower latitudes beginning in early August, and a successive amplitude maximum at Esrange extending to late August. Phase relations between the two components suggested ap-proximate quadrature, with the meridional component lead-ing the zonal component where both amplitudes were large, e.g., in late July at TdF and Rothera, early August at Julius-ruh, and mid-August at Esrange.
Figure 5. Hodographs of hourly 5DW winds at 90 km for August in
2010, 2011, and 2012 from top to bottom. Esrange, Juliusruh, Tierra del Fuego, and Rothera are shown from left to right.
5DW structure and variability in 2011 were quite different from 2010, tending to be more variable in altitude and time at all sites, perhaps suggesting a superposition of different modes. Strong earlier responses occurred at higher altitudes in the meridional component at Esrange and in the zonal component at TdF, again with the meridional phase leading the zonal phase at both sites. Seen at both TdF and Rothera was a progression of the largest amplitudes from higher to lower altitudes with time, but beginning∼10 days earlier at TdF and exhibiting a shorter period in the meridional compo-nent than in the zonal compocompo-nent (again suggesting a mode superposition). During stronger responses in early August at Esrange and in late July at Juliusruh, relative phases showed the meridional component leading (lagging) the zonal com-ponent at Esrange (Juliusruh).
The 5DW structure for 2012 also exhibited very significant variability from 2010 and 2011. This included (1) large am-plitude disparities between components in late June and early July at Rothera and mid- to late-July at TdF and Rothera, (2) a sustained response from mid-July through August at Juliusruh, but having different periods in the two compo-nents, and (3) a similar long response at Esrange, but which appeared to have the same period in both components.
sim-Figure 6. Same as Fig. 4, but from March to May 2012 for Esrange
and Juliusruh and from October to December 2012 for Tierra del Fuego and Rothera.
ilar wave periods between the components most of the time. Hodograph in 2012 does not exhibit clear circulation at TdF due to small amplitudes of the meridional 5DW at TdF.
3.4 Seasonal comparison
Because variances in Fig. 2 revealed maxima in April 2012 in the Northern Hemisphere and in November 2012 in the Southern Hemisphere, time evolution of the 5DW in the zonal and meridional winds is shown in Fig. 6 from March to May 2012 for the Northern Hemisphere and from Octo-ber to DecemOcto-ber 2012 for the Southern Hemisphere, and hodographs at 90 km for April and November 2012 at the four sites are shown in Fig. 7.
In the Northern Hemisphere, enhancements of the 5DW in the two components which occurred from late March were slightly earlier at Esrange than at Juliusruh, with a larger amplitude in the meridional component, but lasted longer at lower (higher) altitudes at Esrange (Juliusruh). Hodographs reveal a clockwise circulation throughout the month at both Esrange and Juliusruh. However, the phase relation at Julius-ruh was nearly inphase at the beginning of the month and anti-phase at the end of the month, again suggesting a
super-Figure 7. Same as Fig. 5, but for April (top) and November (bottom)
in 2012.
position of modes having different periods and meridional structure.
In the Southern Hemisphere, the 5DW in the two compo-nents was enhanced from late October to early November and was slightly earlier at TdF than at Rothera, with larger ampli-tudes at higher altiampli-tudes at both sites. Hodographs reveal an anti-phase relation at early November at TdF and a clockwise circulation with a quadrature relation with the zonal compo-nent leading the meridional compocompo-nent at Rothera.
To summarize, meridional amplitudes were larger than zonal amplitudes in both hemispheres, with increasing am-plitudes with altitude. The amplitude enhancement was also earlier at the higher latitude in the Northern Hemisphere but was later at the higher latitude in the Southern Hemisphere.
3.5 Oscillations
Figure 8 shows S-transform 5DW amplitudes at 90 km. Be-cause amplitudes of oscillations having periods longer than 200 days, including annual oscillations, were < 1.6 m s−1at all sites, only amplitudes for periods from 10 to 200 days are shown. S-transforms exhibit different features of the 5DW amplitude oscillations between the two components at all sites. Oscillations of the zonal component at Esrange over the interval from September 2010 to January 2011 reveal an amplitude with∼5 m s−1for a range of periods from∼30 to 100 days with a maximum at a period of∼43 days in late De-cember 2010, with another peak with∼4.5 m s−1at a period of∼15 days in January 2011. For the meridional component, on the other hand, maximum oscillations occurred from De-cember 2011 to January 2012 at a period of∼18 days. Os-cillations with amplitudes ∼4 m s−1 were observed in the meridional component at Juliusruh at periods of∼18 days in August 2010 and 2011, and at a period of∼40 days in March 2012.
[image:6.612.50.286.64.366.2] [image:6.612.311.545.68.199.2]Figure 8. S-transform amplitudes of 5DW amplitudes at 90 km in
the zonal (left) and meridional (right) winds over Esrange, Julius-ruh, Tierra del Fuego, and Rothera from top to bottom.
and 2012 in the meridional component, with larger ampli-tudes in 2012 at both TdF and Rothera.
4 Discussion
Murphy et al. (2007) studied seasonal variations of the 4– 8-day wave using MF radar wind measurements at Davis Station (69◦S), Antarctica from 1997 to 2005 and found wave enhancements from July to August. Williams and Av-ery (1992) reported an enhancement of the 5DW in July 1984 using a mesosphere-stratosphere-troposphere (MST) radar at Poker Flat (65◦N), Alaska. These are consistent with our results of enhancements in the Northern Hemisphere sum-mer. Furthermore, spectral characteristics of MF radar wind measurements at Tromsø (70◦N) in the spring 1997 by Hall et al. (1998) showed the existence of the 5DW in the zonal component in February and March. Our S-transform results for 2012 in Fig. 1 exhibit amplitude enhancements at periods > 4.5 days in March at Esrange but spring enhancements of the 5DW in 2011 occurred in February (not shown), suggest-ing possible interannual variability of the enhancements.
Murphy et al. (2007) showed that a maximum amplitude in a month can be larger than monthly median by 3 times, sug-gesting large amplitude variations in time. Our study exhib-ited an interannual variation in amplitude in Northern Hemi-sphere summer at all sites and intervals having enhanced
am-plitudes were often less than a month. A previous study of the 5DW at Esrange (1999 to 2008) and Rothera (2005 to 2008) by Day and Mitchell (2010) also showed significant inter-annual variation, e.g., several years without Northern Hemi-sphere summer enhancements. Lawrence and Jarvis (2003) also reported years with both strong and weak responses of the 5DW during the austral winter between 1997 and 1999 using Imaging Doppler Interferometer (IDI) wind measure-ments at Halley (76◦S).
A wavelet analysis of radar wind measurements at low-to mid-latitudes by Jiang et al. (2008) exhibited nearly si-multaneous amplitude enhancements at latitudes between Adelaide (35◦S) and Platteville (40◦N) from April to May 2003. Riggin et al. (2006) reported that S-transform am-plitudes for a∼5-day period in May at Saskatoon (52◦N) were < 10 m s−1 for the meridional component at altitudes between 88 and 92 km and were even smaller at Tromsø. By comparison, our S-transform amplitudes in May 2012 were < 5 m s−1for the meridional component at Esrange and even smaller at Juliusruh in May but larger at Juliusruh in June. These differences are additional evidence of the large inter-annual variations of the 5DW.
If the 5DW can be amplified by baroclinic instability (Meyer and Forbes, 1997), interannual variability of the 5DW may be associated with interannual variability of the vertical shear because baroclinic instability is associated with a strong vertical shear in the zonal wind. The vertical shear is related to the 11-year solar cycle (Fritz and Angell, 1976) and even has a multi-decadal variability (Aiyyer and Thorn-croft, 2011). It is well known that the vertical shear is also influenced by the quasi-biennial oscillation (QBO) (Baldwin et al. 2001) and Kishore et al. (2004) reported a dependency of 5DW amplitudes on the QBO. Additionally, Walsh and Syktus (2003) showed differences of the vertical shear be-tween El Niño and La Niña years. The interval we studied here, mid-2010 to 2012, spanned a weakening of La Niña from 2010 to 2011 and a transition to weak El Niño in 2012. Energy for an amplification of the 5DW by the instabil-ity can be transferred from the mean zonal flow (Mayer and Forbes, 1997) and interannual variability and long-period os-cillations of the zonal wind have been reported by various studies. Among these studies, Iimura et al. (2011) showed trends, and 28-, 66- and 132-month oscillations of the zonal wind over Antarctic and Arctic and larger amplitudes of these oscillations over the Arctic than the Antarctic at most alti-tudes.
The 5DW in geopotential height was simulated in the Gen-eral Circulation Model (GCM) developed at Kyushu Uni-versity by Miyoshi (1999). The GCM predicted maximum amplitudes at ∼40 to 50◦in latitude and ∼100 km in alti-tude, and these results were supported by a global 5DW anal-ysis using UARS/ISAMS temperature measurements (Hi-rooka, 2000). Based on their results, 5DW (1, 1) amplitudes should be larger at Juliusruh and TdF than at Esrange and Rothera. However, our results often exhibited larger ampli-tudes at high latiampli-tudes (Esrange and Rothera) than at midlat-itudes (Juliusruh and TdF). Furthermore, time-latitude cross Sects. of 5DW amplitudes in geopotential height using GCM by Miyoshi (1999) and in temperature using TIMED/SABER measurements by Pancheva et al. (2010) showed latitudinal symmetry with respect to the equator during enhancements. Our results, on the other hand, often exhibited amplitude en-hancements only in one hemisphere, suggesting a major con-tribution of anti-symmetric modes.
From limited ground-based measurements, it is impossi-ble to extract only the Rossby normal mode (1, 1) 5DW, and hence it is very plausible that our results contain influences by other modes. Pancheva et al. (2010) reported a clima-tology of a global distribution of the eastward-propagating zonal wavenumber 1 (E1) 5.5-day wave in the tempera-ture field from TIMED/SABER measurements from 2002 to 2007. Due to the latitudinal coverage of the SABER mea-surements, they reported the E1 5.5-day wave only equator-ward of 50◦, however their results suggest that the E1 5.5-day wave also exists at higher latitudes. The E1 5DW was also found in the meridional wind as a winter phenomenon using meteor radar wind measurements at the South Pole during 1995 by Palo et al. (1998). Simulation using the extended Canadian Middle Atmosphere Model (CMAM) by McLan-dress et al. (2006) predicted E1 quasi-4-day wave during aus-tral winter between 63 and 85◦S, as observed by Lawrence et al. (1995), Prata (1984) and Venne and Stanford (1979, 1982), although Hough function theory predicts that the quasi-4-day wave corresponds to (2, 1) (Hirota and Hirooka, 1984; Salby, 1984; Talaat et al., 2002). Discrepancies be-tween our results and previous 5DW studies from ground-based radar measurements introduced above may also be a longitude variability caused by a mixture of these different wave modes.
Riggin et al. (2006) investigated a climatological global structure of the 5DW using TIMED/SABER satellite and ground-based radar observations in May and concluded that the 5DW originates in the winter hemisphere and propagates to the summer hemisphere to create a symmetrical structure with respect to the equator. Our results show enhancements at the four sites from July to August and the 5DW would prop-agate from the Southern Hemisphere to the Northern Hemi-sphere according to the cross-equatorial propagation theory. However, momentum fluxes in June and July in Fig. 3 do not exhibit consistent northward transport of the eastward mo-mentum, likely because the momentum fluxes reflect
differ-ing mean-flow (or possibly wave-wave) interactions in the different winter and summer environments.
5 Summary
Meteor radar wind measurements at Esrange and Juliusruh (∼68 and 55◦N) and at Tierra del Fuego and Rothera (∼68 and 54◦S) were employed for a study of the interhemispheric and interannual variability of the quasi-5-day wave (5DW) at altitudes from 84 to 96 km spanning simultaneous operations from June 2010 to December 2012. Enhancements of 5DW variances were observed after the Northern Hemisphere sum-mer solstice from June to August during a short period of less than a month. The enhancements were larger at high lat-itudes in 2010, midlatlat-itudes in 2011, and somewhat similar at all sites in 2012 based on variances of horizontal winds. En-hancements of the 5DW variances also occurred in February 2011 only at high latitudes, in January and April 2012 only in the Northern Hemisphere, and in November 2012 only in the Southern Hemisphere.
Clear and consistent correlations were not found between variances and horizontal momentum fluxes. Large positive (> 50 m2s−2)momentum fluxes were found during July and August in 2010 at Rothera, and 2011 at Esrange, but nega-tive (<−50 m2s−2)momentum fluxes were found in 2012 at TdF. Negative momentum fluxes were also found in Novem-ber 2010 at Esrange and in NovemNovem-ber 2012 at TdF, while positive momentum fluxes were found in February 2011 at Rothera and in April 2012 at Juliusruh. As above, we sug-gest that these inconsistent momentum fluxes may be more likely indicative of differing interaction conditions in the two hemispheres.
Our results also indicate large (short- and long-period, lat-itudinal, and interhemispheric) variations of the phase rela-tions between the zonal and meridional components of the 5DW, or a possible superposition of the 5DW and other modes. Strong variability of the 5DW may also be indica-tive of strong interactions with other planetary waves and/or the zonal mean flow, given its small zonal phase speed.
Acknowledgements. This research was supported by NSF under grant OPP-0839084 and AGS-1112830, and by NASA under con-tract NNH12CF02C. We wish to thank the EARG personnel for their invaluable help with the operation of SAAMER.
The topical editor A. J. Kavanagh thanks two anonymous refer-ees for help in evaluating this paper.
References
Aiyyer, A. and Thorncroft, C.: Interannual-to-Multidecadal Vari-ability of Vertical Shear and Tropical Cyclone Activity, J. Cli-mate, 24, 2949–2962, doi:10.1175/2010JCLI3698.1, 2011. Baldwin, M. P., Gray, L. J., Dunkerton, T. J., Hamilton, K., Haynes,
Horinouchi, T., Jones, D. B. A., Kinnersley, J. S., Marquardt, C., Sato, K., and Takahashi, M.: The quasi-biennial oscillation, Rev. Geophys., 39, 179–229, doi:10.1029/1999RG000073, 2001. Belova, A., Kirkwood, S., Murtagh, D., Mitchell, N., Singer, W.,
and Hocking, W.: Five-day planetary waves in the middle at-mosphere from Odin satellite data and ground-based instru-ments in Northern Hemisphere summer 2003, 2004, 2005 and 2007, Ann. Geophys., 26, 3557–3570, doi:10.5194/angeo-26-3557-2008, 2008a.
Belova, A., Kirkwood, S., Raffalski, U., Kopp, G., Hochschild, G., and Urban, J.: Five-day planetary waves as seen by the Odin satellite and the ground-based Kiruna millimeter wave ra-diometer in January–March 2005, Can. J. Phys., 86, 459–466, doi:10.1139/P07-172, 2008b.
Belova, A., Kirkwood, S., and Murtagh, D.: Planetary waves in ozone and temperature in the Northern Hemisphere winters of 2002/2003 and early 2005, Ann. Geophys., 27, 1189–1206, doi:10.5194/angeo-27-1189-2009, 2009.
Chronis, T. G., Williams, E., and Anagnostou, E. N.: Evi-dence of Tropical Forcing of the 6.5-Day Wave from Light-ning Observations over Africa, J. Atmos. Sci., 64, 3717–3721, doi:10.1175/JAS4021.1, 2007.
Clark, R. R., Burrage, M. D., Franke, S. J., Manson, A. H., Meek, C. E., Mitchell, N. J., and Muller, H. G.: Observations of 7-d plane-tary waves with MLT radars and the UARS-HRDI instrument, J. Atmos. Sol.-Terr. Phy., 64, 1217–1228, doi:10.1016/S1364-6826(02)00070-6, 2002.
Day, K. A. and Mitchell, N. J.: The 5-day wave in the Arctic and Antarctic mesosphere and lower thermosphere, J. Geophys. Res.-Atmos., 115, D01109, doi:10.1029/2009JD012545, 2010. Day, K. A., Taylor, M. J., and Mitchell, N. J.: Mean winds,
temper-atures and the 16- and 5-day planetary waves in the mesosphere and lower thermosphere over Bear Lake Observatory (42◦N, 111◦W), Atmos. Chem. Phys., 12, 1571–1585, doi:10.5194/acp-12-1571-2012, 2012.
Forbes, J. M.: Tidal and Planetary Waves, The upper Mesosphere and Lower Thermosphere: A Review of Experiment and Theory, Geoph. Monog. Series, 87, 67–87, 1995.
Fraser, G. J.: The 5-day wave and ionospheric absorption, J. Atmos. Terr. Phys., 39, 121–124, 1977.
Fritts, D. C., Janches, D., and Hocking, W. K.: Southern Ar-gentina Agile Meteor Radar: Initial assessment of gravity wave momentum fluxes, J. Geophys. Res.-Atmos., 115, D19123, doi:10.1029/2010JD013891, 2010.
Fritts, D. C., Iimura, H., Lieberman, R., Janches, D., and Singer, W.: A conjugate study of mean winds and planetary waves employing enhanced meteor radars at Rio Grande, Argentina (53.8◦S) and Juliusruh, Germany (54.6◦N), J. Geophys. Res.-Atmos., 117, D05117, doi:10.1029/2011JD016305, 2012.
Fritz, S. and Angell, J. K.: Temperature and wind variation in the tropical upper stratosphere and lower mesosphere during a sunspot cycle, J. Geophys. Res., 81, 1051–1055, doi:10.1029/JC081i006p01051, 1976.
Hall, C. M., Manson, A. H., and Meek, C. E.: Spectral character-istics spring arctic mesosphere dynamics, Ann. Geophys., 16, 1607–1618, doi:10.1007/s00585-998-1607-3, 1998.
Hirooka, T.: Normal Mode Rossby Waves as Revealed by UARS/ISAMS Observations., J. Atmos. Sci., 57, 1277–1285,
doi:10.1175/1520-0469(2000)057<1277:NMRWAR>2.0.CO;2, 2000.
Hirota, I. and Hirooka, T.: Normal mode Rossby waves ob-served in the upper stratosphere. I – First symmetric modes of zonal wavenumbers 1 and 2, J. Atmos. Sci., 41, 1253–1267, doi:10.1175/1520-0469(1984)041<1253:NMRWOI>2.0.CO;2, 1984.
Hocking, W. K. and Vandepeer, B.: Real-time determination of meteor-related parameters utilizing modern digital technology, J. Atmos. Sol.-Terr. Phy., 63, 155–169, doi:10.1016/S1364-6826(00)00138-3, 2001.
Hoffmann, P., Becker, E., Singer, W., and Placke, M.: Sea-sonal variation of mesospheric waves at northern middle and high latitudes, J. Atmos. Sol.-Terr. Phy., 72, 1068–1079, doi:10.1016/j.jastp.2010.07.002, 2010.
Iimura, H., Fritts, D. C., Tsutsumi, M., Nakamura, T., Hoffmann, P., and Singer, W.: Long-term observations of the wind field in the Antarctic and Arctic mesosphere and lower-thermosphere at conjugate latitudes, J. Geophys. Res.-Atmos., 116, D20112, doi:10.1029/2011JD016003, 2011.
Isoda, F., Tsuda, T., Nakamura, T., Murayama, Y., Igarashi, K., Vincent, R. A., Reid, I. M., Nuryanto, A., and Manurung, S. L.: Long-Period wind oscillations in the mesosphere and lower thermosphere at Yamagawa (32◦N, 131◦E), Pontianak (0◦N, 109◦E) and Christmas Island (2◦N, 157◦W), J. Atmos. Sol.-Terr. Phy., 64, 1055–1067, doi:10.1016/S1364-6826(02)00057-3, 2002.
Jiang, G., Xu, J., Xiong, J., Ma, R. Ning, B., Murayama, Y., Thorsen, D., Gurubaran, S., Vincent, R. A., Reid, I., and Franke, S. J.: A case study of the mesospheric 6.5-day wave ob-served by radar systems, J. Geophys. Res.-Atmos., 113, D16111, doi:10.1029/2008JD009907, 2008.
Kirkwood, S., Barabash, V., Brändström, B. U. E., Moström, A., Stebel, K., Mitchell, N., and Hocking, W.: Noctilucent clouds, PMSE and 5-day planetary waves: A case study, Geophys. Res. Lett., 29, 50-1–50-4 , doi:10.1029/2001GL014022, 2002. Kishore, P., Namboothiri, S. P., Igarashi, K., Gurubaran, S.,
Srid-haran, S., Rajaram, R., and Venkat Ratnam, M.: MF radar ob-servations of 6.5-day wave in the equatorial mesosphere and lower thermosphere, J. Atmos. Sol.-Terr. Phy., 66, 507–515, doi:10.1016/j.jastp.2004.01.026, 2004.
Kishore, P., Namboothiri, S. P., Igarashi, K., Sivakumar, V., Thu-lasiraman, S., Subba Reddy, I. V., Mizutani, K., Narayana Rao, D., Rao, S. V. B., and Bhavani Kumar, Y.: Rayleigh lidar ob-servations of planetary waves in the middle atmosphere over Gadanki (13.5◦N, 79.2◦E), J. Atmos. Sol.-Terr. Phy., 688, 901– 910, doi:10.1016/j.jastp.2006.01.010, 2006.
Kokourov, V. D., Vergaqsova, G. V., and Kazimirovsky, E. S.: Os-cillations with planetary wave periods in variations in the iono-spheric parameter over Eastern Siberia, Geomagn. Aeron., 49, 994–1001, doi:10.1134/S0016793209070263, 2009.
Kovalam, S., Vincent, R. A., Reid, I. M., Tsuda, T., Naka-mura, T., Ohnishi, K., Nuryanto, A., and Wiryosumarto, H.: Longitudinal variations in planetary wave activity in the equatorial mesosphere, Earth Planets Space, 51, 665–674, doi:10.1186/BF03353224, 1999.
Lawrence, B. N. and Randel, W. J.: Variability in the meso-sphere observed by the Nimbus 6 pressure modulator radiometer, J. Geophys. Res., 101, 23475–23490, doi:10.1029/96JD01652, 1996.
Lawrence, B. N., Fraser, G. J., Vincent, R. A., and Phillips, A.: The 4-day wave in the Antarctic mesosphere, J. Geophys. Res., 100, 18899–18908, doi:10.1029/95JD01168, 1995.
Lieberman, R. S., Riggin, D. M., Franke, S. J., Manson, A. H., Meek, C., Nakamura, T., Tsuda, T., Vincent, R. A., and Reid, I.: The 6.5-day wave in the mesosphere and lower thermosphere: Evidence for baroclinic/barotropic instability, J. Geophys. Res.-Atmos., 108, 4640, doi:10.1029/2002JD003349, 2003.
Lima, L. M., Batista, P. P., Clemesha, B. R., and Takahashi, H.: The 6.5-day oscillations observed in meteor winds over Ca-choeira Paulista (22.7◦S), Adv. Space Res., 36, 2212–2217, doi:10.1016/j.asr.2005.06.005, 2005.
Longuet-Higgins, M. S.: The Eigenfunctions of Laplace’s Tidal Equations over a Sphere, Philos. T. R. Soc. Lond., 262, 511–697, doi:10.1098/rsta.1968.0003, 1968.
Madden, R. and Jullian, P.: Further Evidence of Global-Scale 5-Dat Pressure Waves, J. Atmos. Sci., 29, 1464–1469, doi:10.1175/1520-0469(1972)029<1464:FEOGSD>2.0.CO;2, 1972.
McLandress, C., Ward, W. E., Fomichev, V. I., Semeniuk, K., Beagley, S. R., McFarlane, N. A., and Shepherd, T. G.: Large-scale dynamics of the mesosphere and lower thermo-sphere: An analysis using the extended Canadian Middle At-mosphere Model, J. Geophys. Res.-Atmos., 111, D17111, doi:10.1029/2005JD006776, 2006.
Mechoso, C. R. and Hartmann, D. L.: An Observational Study of Traveling Planetary Waves in the Southern Hemi-sphere., J. Atmos. Sci., 39, 1921–1935, doi:10.1175/1520-0469(1982)039<1921:AOSOTP>2.0.CO;2, 1982.
Merkel, A. W., Thomas, G. E., Palo, S. E., and Bailey, S. M.: Obser-vations of the 5-day planetary wave in PMC measurements from the Student Nitric Oxide Explorer Satellite, Geophys. Res. Lett., 30, 1196, doi:10.1029/2002GL016524, 2003.
Merkel, A. W., Garcia, R. R., Bailey, S. M., and Russell, J. M.: Ob-servational studies of planetary waves in PMCs and mesospheric temperature measured by SNOE and SABER, J. Geophys. Res.-Atmos., 113, D14202, doi:10.1029/2007JD009396, 2008. Merzlyakov, E. G., Solovjova, T. V., and Yudakov, A. A.: The
in-terannual variability of a 5–7 day wave in the middle atmo-sphere in autumn from ERA product data, Aura, MLS data, and meteor wind data, J. Atmos. Sol.-Terr. Phy., 102, 281–289, doi:10.1016/j.jastp.2013.06.008, 2013.
Meyer, C. K. and Forbes, J. M.: A 6.5-day westward propagat-ing planetary wave: Origin and characteristics, J. Geophys. Res., 102, 26173–26178, doi:10.1029/97JD01464, 1997.
Mitchell, N. J. and Beldon, C. L.: Gravity waves in the Mesopause region observed by meteor radar: 1. A simple mea-surement technique, J. Atmos. Sol.-Terr. Phy., 71, 866–874, doi:10.1016/j.jastp.2009.03.011, 2009.
Mitchell, N. J., Pancheva, D., Middleton, H. R., and Hagan, M. E.: Mean winds and tides in the Arctic mesosphere and lower thermosphere, J. Geophys. Res.-Space, 107, 2-1–2-14 , doi:10.1029/2001JA900127, 2002.
Miyoshi, Y.: Numerical Simulation of the 5-day and 16-day waves in the Mesopause region, Earth Planets Space, 51, 763–784, doi:10.1186/BF03353235, 1999.
Miyoshi, Y. and Hirooka, T.: A Numerical Experiment of Excitation of the 5-Day Wave by a GCM., J. Atmos. Sci., 56, 1698–1707, doi:10.1175/1520-0469(1999)056<1698:ANEOEO>2.0.CO;2, 1999.
Murphy, D. J., French, W. J. R., and Vincent, R. A.: Lon-period planetary waves in the mesosphere and lower thermosphere above Davis, Antarctica, J. Atmos. Sol.-Terr. Phy., 69, 2118– 2138, doi:10.1016/j.jastp.2007.06.008, 2007.
Nielsen, K., Siskind, D. E., Eckermann, S. D., Hoppel, K. W., Coy, L., McCormack, J. P., Benze, S., Randall, C. E., and Hervig, M. E.: Seasonal variation of the quasi 5 day wave: Causes and conse-quences for polar mesospheric cloud variability in 2007, J. Geo-phys. Res., 115, D18111, doi:10.1029/2009JD012676, 2010. Palo, S. E., Portnyagin, Y. I., Forbes, J. M., Makarov, N. A., and
Merzlyakov, E. G.: Transient eastward-propagating long-period waves observed over the South Pole, Ann. Geophys., 16, 1486– 1500, doi:10.1007/s00585-998-1486-7, 1998.
Pancheva, D., Mukhtarov, P., Andonov, B., and Forbes, J. M.: Global distribution and climatological features of the 5-6-day planetary waves seen in the SABER/TIMED temper-atures (2002–2007), J. Atmos. Sol.-Terr. Phy., 72, 26–37, doi:10.1016/j.jastp.2009.10.005, 2010.
Pedatella, N. M., Liu, H.-L., and Hagan, M. E.: Day-to-day migrating and nonmigrating tidal variability due to the six-day planetary wave, J. Geophys. Res., 117, A06301, doi:10.1029/2012JA017581, 2012.
Pendlebury, D., Shepherd, T. G., Pritchard, M., and McLandress, C.: Normal mode Rossby waves and their effects on chemical com-position in the late summer stratosphere, Atmos. Chem. Phys., 8, 1925–1935, doi:10.5194/acp-8-1925-2008, 2008.
Pogoreltsev, A. I., Fedulina, I. N., Mitchell, N. J., Muller, H. G., Luo, Y., Meek, C. E., and Manson, A. H.: Global free oscillations of the atmosphere and secondary planetary waves in the mesosphere and lower thermosphere region during Au-gust/September time conditions, J. Geophys. Res.-Atmos., 107, 4799, doi:10.1029/2001JD001535, 2002.
Prata, A. J.: The 4-day wave. J. Atmos. Sci., 41, 150–155, doi:10.1175/1520-0469(1984)041<0150:TDW>2.0.CO;2, 1984. Prata, A. J.: Observations of the 5-Day Wave in the Stratosphere and Mesosphere., J. Atmos. Sci., 46, 2473–2477, doi:10.1175/1520-0469(1989)046<2473:OOTWIT>2.0.CO;2, 1989.
Riggin, D. M., Liu, H. -I, Lieberman, R. S., Roble, R. G., Rus-sell III, J. M., Mertens, C. J., Mlynczak, M. G., Pancheva, D., Franke, S. J., Murayama, Y., Manson, A. H., Meek, C. E., and Vincent, R. A.: Observations of the 5-day wave in the meso-sphere and lower thermomeso-sphere, J. Atmos. Sol.-Terr. Phy., 68, 323–339, doi:10.1016/j.jastp.2005.05.010, 2006.
Rodgers, C. D.: Evidence for the Five-Day Wave in the Upper Stratosphere, J. Atmos. Sci., 33, 710–711, doi:10.1175/1520-0469(1976)033<0710:EFTFDW>2.0.CO;2, 1976.
Rosenlof, K. H. and Thomas, R. J.: Five-day mesospheric waves observed in Solar Mesosphere Explorer ozone, J. Geophys. Res., 95, 895–899, doi:10.1029/JD095iD01p00895, 1990.
doi:10.1175/1520-0469(1981)038<1803:RNMINB>2.0.CO;2, 1981a.
Salby, M. L.: Rossby Normal Modes in Nonuniform Back-ground Configurations, Part II, Equinox and Solstice Con-ditions, J. Atmos. Sci., 38, 1827–1840, doi:10.1175/1520-0469(1981)038<1827:RNMINB>2.0.CO;2, 1981b.
Salby, M. L.: Survey of planetary scale traveling waves: the state of theory and observations, Rev. Geophys. Space Phys., 22, 209– 236, doi:10.1029/RG022i002p00209, 1984.
Sandford, D. J., Beldon, C. L., Hibbins, R. E., and Mitchell, N. J.: Dynamics of the Antarctic and Arctic mesosphere and lower thermosphere – Part 1: Mean winds, Atmos. Chem. Phys., 10, 10273–10289, doi:10.5194/acp-10-10273-2010, 2010.
Singer, W., Bremer, J., Hocking, W. K., Weiss, J., Latteck, R., and Zechal, M.: Temperature and wind tides around the summer Mesopause at middle and arctic latitudes, Adv. Space Res., 31, 2055–2060, doi:10.1016/S0273-1177(03)00228-X, 2003. Sivjee, G. G., Walterscheid, R. L., and McEwen, D. J.:
Plane-tary wave disturbances in the Arctic winter Mesopause over Eu-reka (80◦N), Planet. Space Sci., 42, 973–986, doi:10.1016/0032-0633(94)90057-4, 1994.
Sonnermann, G. R., Hartogh, P., Grygalashvyly, M., Li, S., and Berger, U.: The quasi 5-day signal in the mesospheric water va-por concentration at high latitudes in 2003-a comparison between observations at ALOMAR and calculations, J. Geophys. Res.-Atmos., 113, D04101, doi:10.1029/2007JD008875, 2008. Takahashi, H., Wrasse, C. M., Pancheva, D., Abdu, M. A., Batista,
I. S., Lima, L. M., Batista, P. P., Clemesha, B. R., and Sh-iokawa, K.: Signatures of 3–6 day planetary waves in the equato-rial mesosphere and ionosphere, Ann. Geophys., 24, 3343–3350, doi:10.5194/angeo-24-3343-2006, 2006.
Talaat, E. R., Yee, J. H., and Zhu, X.: Observations of the 6.5-day wave in the mesosphere and lower thermosphere, J. Geophys. Res.-Atmos, 106, 20715–20723, doi:10.1029/2001JD900227, 2001.
Talaat, E. R., Yee, J.-H., and Zhu, X.: The 6.5-day wave in the trop-ical stratosphere and mesosphere, J. Geophys. Res.-Atmos., 107, 1-1–1-5, doi:10.1029/2001JD000822, 2002.
Venne, D. E. and Stanford, J. L.: Observation of a 4-day temperature wave in the polar winter stratosphere, J. Atmos. Sci., 36, 2016–2019, doi:10.1175/1520-0469(1979)036<2016:OOATWI>2.0.CO;2, 1979.
Venne, D. E. and Stanford, J. L.: An observational study of high-latitude stratospheric planetary waves in win-ter, J. Atmos. Sci., 39, 1026–1034, doi:10.1175/1520-0469(1982)039<1026:AOSOHL>2.0.CO;2, 1982.
von Savigny, C., Robert, C., Bovensmann, H., Burrows, J. P., and Schwartz, M.: Satellite observations of the quasi 5-day wave in noctilucent clouds and Mesopause temperatures, Geophys. Res. Lett., 34, L24808, doi:10.1029/2007GL030987, 2007.
Walsh, K. J. E. and Syktus, J.: Simulations of observed interannual variability of tropical cyclone formation east of Australia, At-mos. Sci. Lett., 4, 28–40, doi:10.1016/S1530-261X(03)00004-5, 2003.
Williams, C. R. and Avery, S. K.: Analysis of long-period waves using the mesosphere-stratosphere-troposphere radar at Poker Flat, Alaska, J. Geophys. Res., 97, D18, 20855–20861, doi:10.1029/92JD02052, 1992.
Wu, D., Hays, L. B., and Skinner, W. R.: Observations of the 5-day wave in the mesosphere and lower thermosphere, Geophys. Res. Lett., 21, 2733–2736, doi:10.1029/94GL02660, 1994.