www.ann-geophys.net/30/1611/2012/ doi:10.5194/angeo-30-1611-2012
© Author(s) 2012. CC Attribution 3.0 License.
Annales
Geophysicae
Observations of NO in the upper mesosphere and lower
thermosphere during ECOMA 2010
J. Hedin1, M. Rapp2,*, M. Khaplanov1, J. Stegman1, and G. Witt1
1Department of Meteorology, Stockholm University, Stockholm, Sweden 2Leibniz-Institute for Atmospheric Physics, K¨uhlungsborn, Germany
*now at: Deutsches Zentrum f¨ur Luft- und Raumfahrt, Institut f¨ur Physik der Atmosph¨are, Oberpfaffenhofen, Germany Correspondence to: J. Hedin ([email protected])
Received: 31 July 2012 – Revised: 24 October 2012 – Accepted: 6 November 2012 – Published: 28 November 2012
Abstract. In December 2010 the last campaign of the German-Norwegian sounding rocket project ECOMA (Exis-tence and Charge state Of Meteoric smoke particles in the middle Atmosphere) was conducted from Andøya Rocket Range in northern Norway (69◦N, 16◦E) in connection with the Geminid meteor shower. The main instrument on board the rocket payloads was the ECOMA detector for studying meteoric smoke particles (MSPs) by active photoionization and subsequent detection of the produced charges (particles and photoelectrons). In addition to photoionizing MSPs, the energy of the emitted photons from the ECOMA flash-lamp is high enough to also photoionize nitric oxide (NO). Thus, around the peak of the NO layer, at and above the main MSP layer, photoelectrons produced by the photoionization of NO are expected to contribute to, or even dominate above the main MSP-layer, the total measured photoelectron current. Among the other instruments on board was a set of two pho-tometers to study the O2(b16g+−X36
−
g) Atmospheric band
and NO2continuum nightglow emissions. In the absence of
auroral emissions, these two nightglow features can be used together to infer NO number densities. This will provide a way to quantify the contribution of NO photoelectrons to the photoelectron current measured by the ECOMA instru-ment and, above the MSP layer, a simultaneous measure-ment of NO with two different and independent techniques. This work is still on-going due to the uncertainties, especially in the effort to quantitatively infer NO densities from the ECOMA photoelectron current, and the lack of simultane-ous measurements of temperature and density for the photo-metric study. In this paper we describe these two techniques to infer NO densities and discuss the uncertainties. The peak NO number density inferred from the two photometers on
as-cent was 3.9×108cm−3at an altitude of about 99 km, while
the concentration inferred from the ECOMA photoelectron measurement at this altitude was a factor of 5 smaller. Keywords. Atmospheric composition and structure (Air-glow and aurora; Middle atmosphere – composition and chemistry; Instruments and techniques)
1 Introduction
1.1 Nitric oxide in the middle atmosphere
The presence of nitric oxide (NO) in the upper atmosphere was first suggested by Kaplan (1939) and later confirmed by Barth (1964). It has since then been a species of major in-terest for the aeronomy of the middle atmosphere. NO has a low ionization threshold and controls the ion composition of the ionospheric E-region. In addition, its photoionization by direct solar (and geocoronal) Lyman-αradiation creates the ionospheric D-region (Nicolet, 1945). NO is also an impor-tant source of radiative cooling as it emits efficiently in the infrared at 5.3 µm (e.g. Kockarts, 1980; L´opez-Puertas and Taylor, 2001). As for neutral chemistry in the middle atmo-sphere, NO is a major player in determining the odd-oxygen budget. Altogether, this makes NO an important player in the energy balance and temperature structure of the upper meso-sphere and lower thermomeso-sphere.
production mechanism in the lower thermosphere, at the peak of the NO layer around 110 km, is the reaction of excited atomic nitrogen, N(2D), with O2. At higher
alti-tudes, above∼140 km, the dominant production mechanism is the strongly temperature dependent reaction of ground state atomic nitrogen, N(4S), with O2. Both reactions occur
in the atmosphere but the reaction of N(2D) with O2is much
faster at the temperatures in the lower thermosphere. Loss mechanisms are the reactions with N(4S) (primary), O+2 or through photodissociation by solar UV radiation. N(2D,4S) is produced in the reaction of N+2 with O, through impact dissociation of N2by energetic electrons (auroral secondary
electrons and fast photoelectrons due to solar soft X-rays) and through dissociative recombination of NO+or N+
2 with
ambient electrons. This results in a production of NO at high latitudes that is mostly under geomagnetic control and thus highly variable in space and time. At lower latitudes the pro-duction is mostly under solar control showing clear 27-day and 11-year variations (Barth, 1992), although Joule heating events connected to geomagnetic storms can result in an in-crease in the lower thermosphere also at low latitudes (Barth et al., 2009).
The diffusion transport lifetime of NO in the lower ther-mosphere is about one day, while the chemical lifetime in sunlit conditions is approximately 0.8 day (19 h) (Barth, 1992; Barth et al., 2001). Since the solar energy input into the atmosphere varies throughout the day, the amount of NO at one time is effectively a measure of the level of solar irra-diance and auroral energy deposition over the previous day. Especially at winter polar latitudes NO has a long chemical lifetime and can be efficiently transported downward in the nighttime winter polar vortex into the stratosphere where it can affect ozone-related chemistry (e.g. Solomon et al., 1982; Siskind et al., 2000; Randall et al., 2009; Funke et al., 2005). This is a prominent example of downward influence in the middle atmosphere.
Another important reaction cycle is the conversion be-tween NO and NO2(or recycling of the NOxspecies) in the
middle atmosphere, including the NO+O “air afterglow” reaction
NO+O(+M)→NO2(+M)+hv. (R1) This results in a broad emission feature in the Earth’s vis-ible and near infrared nightglow spectrum, the NO2
night-glow continuum. This emission can be used, together with knowledge about the local O concentration and in the ab-sence of auroral emissions, to infer NO number densities in the upper mesosphere and lower thermosphere region (Sharp, 1978; Witt et al., 1981; McDade et al., 1986a; von Savigny et al., 1999; Gattinger et al., 2010; Enell et al., 2011; Sheese et al., 2011). An attempt to do this was made by adding a set of two photometers to each of the three payloads in the last campaign of the ECOMA project in December 2010. This approach is similar to the set of photometers described by Enell et al. (2011), but without the N+2 1st Neg. band
auroral photometer. The reasons for adding the two night-glow photometers to the ECOMA payloads were twofold: (1) to try to quantify the contribution from NO photoelec-trons to the photoelectron current measured by the ECOMA detector, and (2) to measure the NO abundance simultane-ously with two independent techniques. Unfortunately only the first payload, launched in the early morning on 4 Decem-ber (04:21 UT), gave useable photometer data. The ECOMA project is briefly described in the following section below, the measurements are presented in Sect. 2 and the results are discussed in Sect. 3.
1.2 The ECOMA project
The German-Norwegian ECOMA project (Existence and Charge state Of Meteoric smoke particles in the middle Atmosphere) was a set of nine sounding rockets in four campaigns launched from Andøya Rocket Range in north-ern Norway (69◦N, 16◦E) from 2006 to 2010. The aim of ECOMA was to study meteoric smoke particles (MSPs) in the middle atmosphere during different seasons and un-der various atmospheric conditions (Strelnikova et al., 2009; Rapp et al., 2010, 2012). MSPs are tiny nanometre sized par-ticles that are thought to be formed through chemical con-version and subsequent re-condensation and coagulation of the meteoric material that originate from meteoroid abla-tion in the 70–120 km altitude (Rosinski and Snow, 1961; Hunten et al., 1980; Plane, 2003; Gabrielli et al., 2004; Meg-ner et al., 2008). Estimates of the amount of meteoric ma-terial that enters the Earth’s atmosphere each day vary from less than 10 to more than 100 t (Love and Brownlee, 1993; Mathews et al., 2001; von Zahn, 2005). Indirect evidence of the existence of MSPs is available from measurements of heavy charge carriers from sounding rockets and incoher-ent scatter radar experimincoher-ents (e.g. Rapp et al., 2007; Strel-nikova et al., 2007; Fentzke et al., 2009). Despite the lack of knowledge, these MSPs have been suggested to play key roles in several mesospheric processes, such as the forma-tion and evoluforma-tion of mesospheric ice particles (i.e. noctilu-cent clouds and polar mesosphere summer echoes) (Rapp and Thomas, 2006), heterogeneous HOxchemistry (Summers et
al., 2001), mesospheric metal chemistry (Plane, 2004), and the D-region charge balance (Rapp and L¨ubken, 2001). In addition, they are thought to be transported down into the stratosphere where they may take part in the formation of polar stratospheric clouds and, hence, are involved in the de-struction of ozone during polar spring (Voigt et al., 2005). Accurate measurements of MSPs are thus of high impor-tance.
Strelnikova, 2009). In this way, the detector continuously measures the currents produced by the a-priori charged par-ticles and, after each flash of the Xenon flash lamp, the cur-rents produced by fast photoelectrons excited by the UV pho-tons. The direct particle measurement is affected by aero-dynamics, which results in an altitude and particle size de-pendent detection efficiency (Hedin et al., 2007; Strelnikova et al., 2009), while the photoelectron measurement is not. However, it can be contaminated by photoelectrons from the photoionization of other atmospheric constituents. The photons from the flash lamp have a broad spectrum with a minimum wavelength of 110 nm, or maximum energy of 11.2 eV, which is enough to ionize, for example, FeO, NO and O2(a11g)with ionization thresholds of 8.56, 9.25 and 11.1 eV, respectively. Photoelectrons from the ionization of NO are in fact expected to be a significant contribution to the measured signal at altitudes above∼90–95 km (Strelnikova et al., 2009). In Sect. 2 below we present the measurements made by the photometers and the ECOMA detector and de-scribe how to infer NO number densities from them.
2 Measurements and results
2.1 NO from the photometric measurements
The NO+O air afterglow reaction that gives rise to the NO2
nightglow continuum is known to occur along two-body and three-body reaction paths simultaneously (e.g. Becker et al., 1972). At high altitudes (low pressure), the chemilumines-cence is believed to arise solely from the two-body radiative recombination reaction:
NO+O k
λ 1
−→NO2+hυ, (R2)
wherekλ1 is the bimolecular differential chemiluminescence rate coefficient for emission at wavelengthλ. At low alti-tudes (high pressure), the three-body reaction involving the production of an electronically excited NO2molecule is the
major pathway: NO+O+Mk
λ,M 2
−→NO∗2+M, (R3)
NO∗2+Mk
λ,M q
−→NO2+M, (R4)
NO∗2 k
λ r
−→NO2+hυ, (R5)
whereMdenotes the third body (N2or O2),k2λ,Mis the
ter-molecular rate coefficient for the formation of a stabilised electronically excited NO2molecule capable of emission at
wavelength λ with a transition probability krλ.kqλ,M is the
[image:3.595.314.538.95.201.2]wavelength dependent combined electronic quenching and vibrational deactivation coefficient. The number densities of the third body at nightglow altitudes are such that nei-ther of the two pathways dominates over the onei-ther. McDade
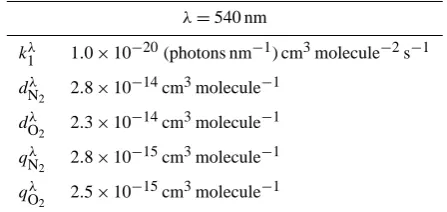
Table 1. Adopted parameters used in Eq. (4) for calculatingkλ, the total bimolecular rate coefficient for the NO2chemiluminescence.
λ=540 nm
k1λ 1.0×10⁻²⁰(photons nm−1) cm3molecule−2s−1
dNλ
2 2.8×10
−14cm3molecule−1
dOλ 2 2.3
×10−14cm3molecule−1
qNλ
2 2.8×10
−15cm3molecule−1
qOλ
2 2.5×10
−15cm3molecule−1
et al. (1986a) defined a total effective bimolecular rate co-efficient for the chemiluminescence based on the work of Becker et al. (1972), including the temperature dependence of the three-body reaction,F3(T ), reported by Whytock et al. (1976) and the possible temperature dependence of the two-body reaction,F2(T ), suggested by Sharp (1984), as
kλ,M=k1λ
F2(T )+dMλ [M]F3(T ) 1+qMλ [M] , (1)
F2(T )=exp530 1296−1T , (2)
F3(T )=exp 584 1
T−1
296 . (3)
The parameters dMλ and qMλ are associated with k2λ,M.kλ1
andkqλ,M .
krλ, respectively, and are listed (forM=O2 and
N2)together withk1λ in Table 1 forλ=540 nm (from Mc-Dade et al., 1986a). The temperature dependence of the two-body reaction suggested by Sharp (1984) has not yet been confirmed and we will here, in accordance with McDade et al. (1986a) and von Savigny et al. (1999), define two cases for this temperature dependence: “case A” that does not include a temperature dependence (i.e.F2(T )=1), and “case B” that
does. The total effective bimolecular rate coefficient for the NO2chemiluminescence can then be written as
kλ=kλ1
F2(T )+
dNλ
2[N2]+d λ O2[O2]
e
n
584T1− 1
296
o
1+qNλ
2[N2]+q λ O2[O2]
10−1 100 101 80
85 90 95 100 105 110 115
Altitude [km]
kλ [*10−21 (phot/Å) cm3 molecule−2 s−1]
3−body (T−dep.)
2−body (case A: T−dep.)
2−body (case A: T−indep.)
Total (case B)
[image:4.595.83.253.63.205.2]Total (case A)
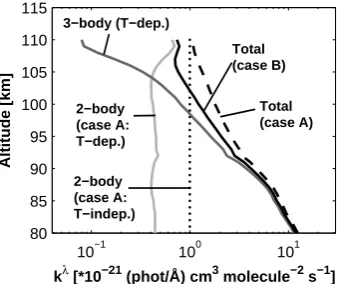
Fig. 1. The two-body, three-body and total effective rate
coeffi-cients for the NO2chemiluminescence at around 540 nm. The light grey profile is the temperature dependent two-body rate coefficient (k1λ·F2(T )); the dotted line is the temperature independent two-body rate coefficient, i.e.k1λ; the dark grey profile is the temper-ature dependent three-body rate coefficient (essentially Eq. 4 with F2(T )=0); the dashed black profile is the total effective bimolecu-lar rate coefficient with no temperature dependence in the two-body reaction (“case A” in the text, i.e. Eq. 4 withF2(T )=1); and the black profile is the total effective bimolecular rate coefficient with the temperature dependence in both the two- and three-body reac-tions (“case B” in the text).
the corresponding temperature) is taken from the September– October climatology by Rapp et al. (2001). The change in atmosphere density and temperature between September– October to the beginning of December is not expected to be larger than the typical variability. The sensitivity of the NO and O retrievals to changes in the atmospheric den-sity and temperature is discussed later in this section. The O2 and N2 fraction of the total density is estimated from
the volume mixing ratios for the two species given by the NRLMSISE-00 empirical atmospheric model (Picone et al., 2002) for the time of the launch.
If the NO+O air afterglow reaction is the only process that results in an emission in the night sky around 540 nm, the local NO concentration is related to the NO2continuum
volume emission rate,VCont., and the local O number density
as
[NO]=VCont.kλ[O]. (5)
The O2(b16g+−X36g−)Atmospheric band (the O2A-band)
nightglow emission is directly related to the atomic oxygen abundance and can be used to derive the O number den-sity (e.g. McDade et al., 1986b; Meriwether, 1989; Murtagh, 1989; Hedin et al., 2009). Atomic oxygen formed through O2photolysis during the day recombines to form excited O2
molecules during the night. The O2A-band emitting state is
thought to form through an energy transfer mechanism from the precursor state (formed in the three-body recombination reaction) with O2as the transfer agent. The volume emission
Table 2. Adopted rate coefficients and excitation parameters used in
Eq. (6) for the retrieval of O from the measured O2A-band night-glow emission.CO andCO2 are the excitation parameters derived empirically from the ETON data and describe the quenching of the precursor state by O and O2, respectively. All coefficients are in the usual units in terms of molecules, cm3, and seconds.
Coefficient Value
k1 4.7×10⁻³³(300/T)2
kO2
2 4.0×10
−17
kN2
2 2.2×10
−15
k2O 8.0×10⁻¹⁴
A1 0.079
A2 0.083
CO2 6.6±0.4
CO 19±2
rate of the O2A-band at 761.9 nm can be expressed as VAband=
A1·k1[O]2· {[O2]+[N2]} ·[O2] n
A2+kO22 [O2]+kN22 [N2]+k2O[O] o
·
CO2[O
2]+CO[O]
,
(6) whereA1is the O2
b16+g
(0-0) band transition probabil-ity,A2is the inverse radiative lifetime of O2
b16g+, v=0,
k1is the temperature dependent rate coefficient for the
three-body recombination of atomic oxygen, andkO2 2 ,k
N2 2 andk
O 2
are the rate coefficients for the quenching of O2
b16+gby O2, N2and O, determined from lab measurements.CO2 and COare excitation parameters for the quenching of the precur-sor state by O2and O. These were derived empirically from
the measurements in the ETON rocket campaign (Greer et al., 1986; McDade et al., 1986b). The values of the rate co-efficients and excitation parameters to be used in Eq. (6) are listed in Table 2 and more details can be found in e.g. Mc-Dade et al. (1986b), Murtagh (1989) or Hedin et al. (2009). Equation (6) can be inverted to retrieve the O number density for input into Eq. (5).
[image:4.595.359.497.138.294.2]0 1000 2000 3000 60
80 100 120 140
Rayleigh
Altitude [km]
Ascent Descent
100 150 200 250
60 80 100 120 140
Rayleigh
Altitude [km]
[image:5.595.127.467.64.188.2]Ascent Descent
Fig. 2. The measured column emission in units of Rayleigh, R (the radiance in photons cm−2str−1s−1multiplied by 4π×10−6), for the (0-0) band of the O2A-band system centred at 761.9 nm (left panel) and the NO2continuum at around 540 nm (right panel) as a function of altitude for both the ascent (darker colour) and descent (lighter colour) part of the flight. The profiles are interval averaged with 1 km vertical resolution and the error bars show the error of the mean. Note that the background sky emissions have not been subtracted (i.e. the signal above the nightglow layer does not tend to zero). Note also the weak continuum emission of∼90 R (5.4 R nm−1) compared to the∼130 R (7.8 R nm−1) background.
0 500 1000 1500 2000 2500
70 80 90 100 110 120 130
Volume emission rate [photons cm−3 s−1]
Altitude [km]
Ascent Descent
0 20 40 60
70 80 90 100 110 120 130
Volume emission rate [photons cm−3 s−1]
Altitude [km]
Ascent Descent
Fig. 3. The volume emission rates of the O2Atmospheric band (left panel, 1 km resolution) and the NO2continuum (right panel, 4 km resolution) nightglow emissions as determined from the photometric measurements on ECOMA7 (with the error bars showing the error of the mean).
and above the emission layer only background emissions are present (e.g. the zodiacal and galactic light). A profile can normally be obtained also on the descent part of the flight, since the payload will keep its attitude down to an altitude of about 70 km before it starts to tumble due to the increased atmospheric density. The measured photon flux is then trans-lated to radiance using the pre-flight calibration, and cor-rected for attitude and converted to vertical profiles. The ver-tical profiles are then differentiated to yield the volume emis-sion rate of the emitting layer as a function of altitude. The two photometers on board the ECOMA payloads monitored the (0-0) band nightglow emission of the O2A-band system
centred at 761.9 nm and the NO2nightglow continuum in a
wavelength region around 540 nm (16.6 nm filter full width at half maximum), respectively. Figure 2 shows the measured column emissions in units of Rayleigh, R (the radiance in photons cm−2str−1s−1multiplied by 4π×10−6), for the O2
A-band (left panel) and the NO2continuum (right panel) as
a function of altitude for both the ascent (darker colour) and descent (lighter colour) part of the flight. The overhead
radi-ances of the nightglow layers are∼2.5 kR for the total (0-0) band of the O2A-band system and∼90 R, or∼5.4 R nm−1,
for the green nightglow continuum around 540 nm. The pro-files are interval averaged with 1 km vertical resolution and the error bars show the error of the mean. It should be noted that the NO2continuum emission is very weak and that the
background emissions from the galactic and zodiacal light in this wavelength region can be of the same order of magnitude (see Fig. 2). These background emissions are not constant but vary depending on which part of the night sky is in the field of view (Witt et al., 1981; Leinert et al., 1998).
The left panel in Fig. 3 shows the volume emission rate of the O2A-band (1 km resolution), while the volume emission
rate of the NO2continuum (4 km resolution) is shown in the
[image:5.595.131.466.281.408.2]0 1 2 3 4 5 80
85 90 95 100 105 110 115
O number density [1011 cm−3]
Altitude [km]
Ascent Descent
0 2 4 6 8 10
80 85 90 95 100 105 110 115
NO number density [108 cm−3]
Altitude [km] Ascent (A)
[image:6.595.125.467.62.192.2]Descent (A) Ascent (B) Descent (B)
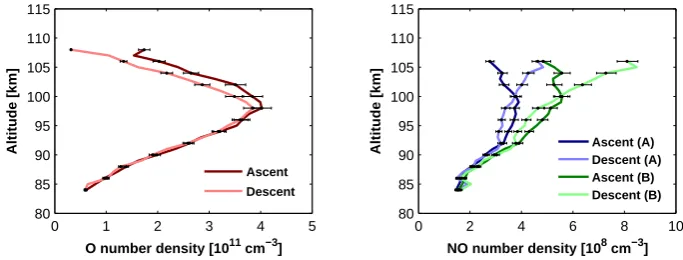
Fig. 4. Left panel: the retrieved O profiles from the O2A-band ascent and descent emission measurements. The error bars show the possible errors in the retrieval due to the uncertainties of the rate coefficients. Right panel: the inferred NO concentrations plotted for the “case A” (with a temperature independent two-body reaction) in blue colours and “case B” (with a temperature dependent two-body reaction) in green colours. The darker colour profiles are the ascent measurements and the lighter colour profiles are the descent measurements. The error bars show also here the possible errors in the retrieval due to the uncertainties of the rate coefficients in the O retrieval.
emission measurements are shown in the left panel of Fig. 4. The derived peak O concentrations during ascent and descent are 3.8×1011cm−3and 4.0×1011cm−3, respectively, both at an altitude of about 98 km. The error bars show the possi-ble errors in the retrieval due to the uncertainties of the rate coefficients. In the right panel the inferred NO concentra-tions are plotted for the “case A” (temperature independent two-body reaction) in blue colours and “case B” (tempera-ture dependent two-body reaction) in green colours. It can be seen that the “case B” NO densities (ascent and descent) are significantly larger at all altitudes. The peak NO concentra-tions during ascent are 3.9×108cm−3and 5.8×108cm−3at an altitude of about 99 km for “case A” and “case B”, respec-tively. The error bars show also here the possible errors in the retrieval due to the uncertainties of the rate coefficients in the O retrieval. The sensitivity of the O and NO retrieval to atmo-spheric temperature and density variability can be estimated using the temperature climatology of Rauthe et al. (2008) and the atmospheric density of Rapp et al. (2001). At the peaks of the O and NO profiles the temperature variability in Decem-ber is typically±6 K which yields a variability in the O and NO densities of±4 % and±2 %, respectively. A temperature increase results in an increase in both O and NO densities. At the same altitude the atmospheric density variability is typi-cally±15 % for the autumn months (September to October) resulting in a variability in the O density of±12 %, but no change in the NO peak density. Both the O and NO profiles are shifted by±1 km due to the atmospheric density variabil-ity. While the O profile is shifted downwards by an increase in the atmospheric density, the NO profile is shifted upwards. The advantage of this photometric technique is its sim-plicity. The disadvantage is the limited accuracy due to un-certainties of the underlying chemical rate coefficients and that especially the NO2continuum measurement is limited
to auroral-free conditions. The geomagnetic conditions the days before and during the launch of ECOMA7 were very
calm and there are no indications of any contaminating auro-ral emissions in either of the two wavelength regions defined by the photometer passbands.
Very recently, Evans et al. (2010) reported on the discov-ery of the orange bands of excited FeO in the low latitude nightglow spectrum. The excited FeO is the result of the re-action between Fe and O3 and the wavelength region
cov-ered by the FeO emission is from∼520 nm to longer than 700 nm, i.e. it coincides spectrally with the NO2continuum
emission. However, because of the chemistry involved in the production of the two species, the altitudes of emission are separated with the NO2 continuum emission peaking some
5–10 km higher than the FeO. Evans et al. (2010) restricted the observations to latitudes equatorward of 40◦ where the NO2continuum emission is believed to be only a minor
con-tributor and the FeO emission to be the major concon-tributor to the nightglow continuum. At auroral latitudes it is more likely the opposite situation, with the NO2continuum
emis-sion as the major contributor. The photometric measurement at 540 (±8) nm is at the very edge of the short wavelength tail of the FeO emission spectrum and it is not likely that the measurement is contaminated. For future studies of the NO2continuum, it is however recommended to go to slightly
shorter wavelengths to avoid auroral and chemiluminescent emissions as much as possible.
10−1 100 101 80
90 100 110 120
Current [nA]
Altitude [km]
ECOMA photoelectron current 1 km averaged photoelectron current
[image:7.595.126.468.64.206.2]Scale height of the atmosphere Typical scale height of NO
Fig. 5. The photoelectron measurement by the ECOMA detector on the ascent part of the flight. The solid grey profile is the complete
data while the solid black line is the 1 km interval averaged data. The dotted grey and blue lines show the decrease of the neutral atmo-sphere and NO densities with increasing altitude indicating their scale heights of∼5 km and∼18 km, respectively. Photoelectrons from the photoionization of NO are thought to dominate the signal above∼95 km, i.e. above the main meteoric smoke particle layer.
107 108 109
90 95 100 105 110 115
NO number density [cm−3]
Altitude [km]
Photoelectron measurement Photometric (case A, ascent) Photometric (case B, ascent) Scale height of the atmosphere Typical scale height of NO
Fig. 6. The solid grey profile is the NO concentration inferred from the photoelectron measurement by the ECOMA detector (the solid
black profile is the 1 km interval averaged inferred NO concentration). The solid blue and green profiles are the “case A” and “case B” NO concentrations inferred from the photometric study on the ascent part of the flight, respectively. The dotted grey line is the scaled atmospheric density showing the decrease of the neutral atmosphere with increasing altitude (scale height∼5 km around 105 km) while the two dotted blue lines show the typical decrease of the NO concentration with altitude above the peak (typical scale height∼18 km).
2.2 The ECOMA measurements
As mentioned in the introduction, the ECOMA instrument measures meteoric smoke particles by actively photoionizing them with a xenon flash lamp followed by detection of the resulting photoelectrons (Rapp and Strelnikova, 2009). The instrument has two measurement channels: one slow for the continuous charge signal from the naturally charged MSPs that are heavy enough to reach all the way to the detector electrode, and one fast for the very short charge pulses due to the photoelectrons excited by the UV flash. It is believed that not only MSPs are photoionized by the UV flash, but also other species of which NO is the top candidate (Rapp and Strelnikova, 2009). The photons from the flash lamp have a broad spectrum with a maximum energy of 11.2 eV, which is enough to ionize NO. Hence, above ∼85–90 km, the measured charge signal by the fast channel is most likely
[image:7.595.127.468.277.420.2]Imax=
ve·1t
Z
2.5 cm hc Z
110 nm
Wi dF
dλ·σi(λ)·P·ni·dλ·dl
·
e
1t
≈
Ftoti · ¯σi·ni ve·1t
Z
2.5 cm P·dl
·
e
1t , (7)
whereve is the velocity of the photoelectron,1t=10 µs is the sampling interval in the fast data channel,his Planck’s constant, and c is the speed of light. dF /dλ is the num-ber of photons per wavelength interval emitted in one flash,
P =S/(4π l2) is the probability that the photoelectron is emitted towards the detector electrode with areaS, andl is the distance from the particle detector.Wi is the threshold
energy for the photoionization of speciesi,ni is the number
density of speciesi,σi(λ)is the cross section for
photoion-ization of speciesi at wavelengthλ, andeis the charge of an electron. For the analysis, it is assumed that the integral over the wavelength may be approximated asFtoti · ¯σi where Ftoti is the total number of photons emitted in one flash with an energy larger thanWi and σ¯i is the average cross
sec-tion over the corresponding wavelength interval. Determin-ingFtoti , using the cross section for the photoionization of NO from Watanabe et al. (1953), and calculating the proba-bility of a photoelectron to reach the detector surface within one 10 µs sampling interval, the maximum photocurrent due to the photoionization of NO (Eq. 7) can be expressed as
Imax=1.2×10⁻⁸·[NO] nA. (8)
Considering the ECOMA photoelectron measurement it is possible that photoelectrons from the photoionization of FeO could contribute to the measured photocurrent as its photoionization threshold is 8.56 eV (Metz et al., 2005). However, the mesospheric NO concentration is significantly larger than the FeO concentration (∼100–1000 cm−3 or a factor of∼10–100 less than the Fe concentration at the peak around 80–85 km (Kane and Gardner, 1993)). Hence, it can be concluded that there should be no contribution to the mea-sured photoelectron current due to photoelectrons from the photoionization of FeO.
3 Discussion and conclusion
Considering the uncertainties in the rate coefficients and ex-citation parameters in the nightglow O retrieval, the possi-ble temperature dependence of the two-body reaction path (Reaction R2, Eq. 2), and the variability of the neutral atmo-sphere density and temperature, the peak NO number density inferred from the photometric measurements on ECOMA7 is between 3.7×108cm−3and 6.0×108cm−3. This is in agree-ment with other measureagree-ments at high latitudes reported from both rockets (Witt et al., 1981; Iwagami and Ogawa,
1980; McDade et al., 1986a) and satellites (Stevens et al., 1997; von Savigny et al., 1999; Barth et al., 2001; Gardner et al., 2007; Kerzenmacher et al., 2008; Gattinger et al., 2010; Sheese et al., 2011). Using different techniques (NOγ-band UV dayglow, NO2 continuum nightglow+O, solar
occul-tation in the IR, NO 5.3 µm emission), these measurements show peak NO number densities of 1–7×108cm−3in the au-roral region. At low latitudes the peak number densities are in general an order of magnitude smaller than at high latitudes, which is consistent with the production and loss mechanisms at high and low latitudes.
[image:8.595.45.287.76.159.2]The NO number densities inferred from the simultaneous photoelectron measurement by the ECOMA detector above the main MSP layer do not, however, agree with the densities inferred from the photometric measurements. Figure 6 shows that the NO density inferred from the photoelectron current using Eqs. (7) and (8) is significantly smaller than those in-ferred from the photometers in the 95–110 km altitude range. The solid grey profile in Fig. 6 is the NO concentration in-ferred from the photoelectron measurement by the ECOMA detector. The solid blue and green profiles are the “case A” and “case B” NO concentrations inferred from the photomet-ric study on the ascent part of the flight, respectively. As in Fig. 5, the dotted grey line is the scaled atmospheric den-sity showing the decrease of the neutral atmosphere with in-creasing altitude (scale height∼5 km around 105 km) while the two dotted blue lines show the typical decrease of the NO concentration with altitude above the peak (typical scale height ∼18±5 km). A scale height of 18 km is also what we see for the “case A” NO density profile at 100–105 km. Due to the low emission rates of the O2 A-band and NO2
continuum above the main emission layer it was not feasible to retrieve O and NO number densities above∼107 km. It is possible that the scale height of the NO profile becomes smaller above∼105 km as is indicated by both “case A” and “case B” NO profiles. The scale height of the photoelectron measurement above∼98 km is significantly larger than the expected scale height of the MSP profile but smaller than the typical 18 km scale height of NO. Thus, photoelectrons from NO is the major, but not the only, contributor to the photo-electron measurement above 100 km.
from the photoionization of NO to that of the MSPs, or use the ECOMA photoelectron measurements to derive NO num-ber densities, Eq. (7), and in particular the probability factor
P, must be re-evaluated. The possibility that payload charg-ing may influence the detection probability by affectcharg-ing the photoelectrons must also be considered.
Based mainly on the current uncertainties in Eq. (7), and to some extent the fact that both the local and ground based at-mospheric density and temperature measurements failed, we cannot say anything qualitative about a possible temperature dependence in the two-body reaction path of the NO+O air afterglow reaction that give rise to the NO2 nightglow
con-tinuum.
NO is an important species in the atmosphere and it is desirable to have measurements with high spatial resolu-tion. The photoionization technique is potentially very use-ful since it seems to be the only technique that can be used both daytime and nighttime and at the same time provide high spatial resolution. Optical techniques, on the other hand, only work either nighttime (NO2continuum) or daytime (NO γ-band resonance fluorescence). The photoionization tech-nique could thus provide a way to cross-compare different optical techniques between daytime and nighttime. For this purpose, the photoionization technique does not even need to provide an absolute measurement.
In this paper we have presented two techniques for night-time NO measurements. We have inferred NO densities from photometric measurements of the O2A-band and the NO2
continuum nightglow emissions, but there are difficulties in the interpretation of the photoelectron current in detecting NO with the ECOMA detector. Both work in principle but there are uncertainties and currently we do not have quanti-tative agreement between them.
Acknowledgements. The ECOMA project was sponsored by the German Space Center under DLR-grants 50OE0301 and 50OE0801. The Swedish contribution to ECOMA was made possible by the support from the Swedish National Space Board.
Guest Editor U.-P. Hoppe thanks two anonymous referees for their help in evaluating this paper.
References
Bailey, S. M., Barth, C. A., and Solomon, S. C.: A model of ni-tric oxide in the lower thermosphere, J. Geophys. Res., 107, 22, doi:10.1029/2001JA000258, 2002.
Barth, C. A.: Rocket measurement of the nitric oxide dayglow, J. Geophys. Res., 69, 3301–3303, 1964.
Barth, C. A.: Nitric oxide in the lower thermosphere, Planet. Space Sci., 40, 315–336, 1992.
Barth, C. A.: Reference models for thermospheric nitric oxide, 1994, Adv. Space Res., 18, 179–208, 1996.
Barth, C. A., Baker, D. N., Mankoff, K. D., and Bailey, S. M.: The northern auroral region as observed in nitric oxide, Geophys. Res. Lett., 28, 1463–1466, 2001.
Barth, C. A., Lu, G., and Roble, R. G.: Joule heating and ni-tric oxide in the thermosphere, J. Geophys. Res., 114, A05301, doi:10.1029/2008JA013765, 2009.
Becker, K. H., Groth, W., and Thran, D.: The mechanism of the air-afterglow NO+O→NO2+hν, Chem. Phys. Lett., 15, 215–220, 1972.
Enell, C.-F., Hedin, J., Stegman, J., Witt, G., Friedrich, M., Singer, W., Baumgarten, G., Kaifler, B., Hoppe, U.-P., Gustavsson, B., Br¨andstr¨om, U., Khaplanov, M., Kero, A., Ulich, T., and Tu-runen, E.: The Hotel Payload 2 campaign: Overview of NO, O and electron density measurements in the upper mesosphere and lower thermosphere, J. Atmos. Sol.-Terr. Phys., 73, 2228–2236, doi:10.1016/j.jastp.2011.01.001, 2011.
Evans, W. F. J., Gattinger, R. L., Slanger, T. G., Saran, D. V., De-genstein, D. A., and Llewellyn, E. J: Discovery of the FeO or-ange bands in the terrestrial night airglow spectrum obtained with OSIRIS on the Odin spacecraft, Geophys. Res. Lett., 37, L22105, doi:10.1029/2010GL045310, 2010.
Fentzke, J. T., Janches, D., Strelnikova, I., and Rapp, M.: Meteoric smoke particles derived using dual beam Arecibo UHF obser-vations of D-region spectra during different seasons, J. Atmos. Sol.-Terr. Phys., 71, 1982–1991, 2009.
Funke, B., L´opes-Puertas, M., and Gil-L´opes, S.: Downward transport of upper atmospheric NOx into the polar strato-sphere and lower mesostrato-sphere during the Antarctic 2003 and Arctic 2002/2003 winters, J. Geophys. Res., 110, D24308, doi:10.1029/2005JD006463, 2005.
Gabrielli, P., Barbante, C., Plane, J. M. C., Varga, A., Hong, S.,Cozzi, G., Gaspari, V., Planchon, F. A. M., Cairns, W., Fer-rari, C., Crutzen, P., Cescon, P., and Boutron, C. F.: Mete-oric smoke fallout over the Holocence epoch revealed by irid-ium and platinum in Greenland ice, Nature, 432, 1011–1014, doi:10.1038/nature03137, 2004.
Gardner, J. L., Funke, B., Mlynczak, M. G., L´opez-Puertas, M., Martin-Torres, F. J., Russell III, J. M., Miller, S. M., Sharma, R. D., and Winick, J. R.: Comparison of night-time nitric oxide 5.3 µm emissions in the thermosphere mea-sured by MIPAS and SABER, J. Geophys. Res., 112, A10301, doi:10.1029/2006JA011984, 2007.
Gattinger, R. L., McDade, I. C., Alfaro Suz´an, A. L., Boone, C. D., Walker, K. A., Bernath, P. F., Evans, W. F. J., Degenstein, D. A., Yee, J.-H., Sheese, P., and Llewellyn, E. J.: NO2air afterglow and O and NO densities from Odin-OSIRIS night and ACE-FTS sun-set observations in the Antarctic MLT region, J. Geophys. Res., 115, D12301, doi:10.1029/2009JD013205, 2010.
Greer, R. G. H., Murtagh, D. P., McDade, I. C., Dickinson, P. H. G., Thomas, L., Jenkins, D. B., Stegman, J., Llewellyn, E. J., Witt, G., Mackinnon, D. J., and Williams, E. R.: ETON 1: A database pertinent to the study of energy transfer in the oxygen nightglow, Planet. Space Sci., 34, 771–788, 1986.
Havnes, O., Trim, J., Blix, T., Mortensen, W., Næsheim, L. I., Thrane, E., and Tønnesen, T.: First detection of charged dust in the Earth’s mesosphere, J. Geophys. Res., 101, 10839–10847, 1996.
Hedin, J., Gumbel, J., and Rapp, M.: On the efficiency of rocket-borne particle detection in the mesosphere, Atmos. Chem. Phys., 7, 3701–3711, doi:10.5194/acp-7-3701-2007, 2007.
sound-ing rockets, Atmos. Meas. Tech., 2, 801–812, doi:10.5194/amt-2-801-2009, 2009.
Hunten, D. M., Turco, R. P., and Toon, O. B.: Smoke and dust par-ticles of meteoric origin in the mesosphere and thermosphere, J. Atmos. Sci., 37, 1342–1357, 1980.
Iwagami, N. and Ogawa, T.: An Antarctic NO density profile de-duced from the gamma band airglow, Planet. Space Sci., 28, 867– 873, 1980.
Kane, T. J. and Gardner, C. S.: Structure and seasonal variability of the nighttime mesospheric Fe layer at midlatitudes, J. Geophys. Res., 98, 16875–16886, 1993.
Kaplan, J.: Nitric oxide in the Earth’s upper atmosphere, Nature, 144, 152, 1939.
Kerzenmacher, T., Wolff, M. A., Strong, K., Dupuy, E., Walker, K. A., Amekudzi, L. K., Batchelor, R. L., Bernath, P. F., Berthet, G., Blumenstock, T., Boone, C. D., Bramstedt, K., Brogniez, C., Brohede, S., Burrows, J. P., Catoire, V., Dodion, J., Drummond, J. R., Dufour, D. G., Funke, B., Fussen, D., Goutail, F., Grif-fith, D. W. T., Haley, C. S., Hendrick, F., H¨opfner, M., Huret, N., Jones, N., Kar, J., Kramer, I., Llewellyn, E. J., L´opez-Puertas, M., Manney, G., McElroy, C. T., McLinden, C. A., Melo, S., Mikuteit, S., Murtagh, D., Nichitiu, F., Notholt, J., Nowlan, C., Piccolo, C., Pommereau, J.-P., Randall, C., Raspollini, P., Ri-dolfi, M., Richter, A., Schneider, M., Schrems, O., Silicani, M., Stiller, G. P., Taylor, J., T´etard, C., Toohey, M., Vanhellemont, F., Warneke, T., Zawodny, J. M., and Zou, J.: Validation of NO2and NO from the Atmospheric Chemistry Experiment (ACE), At-mos. Chem. Phys., 8, 5801–5841, doi:10.5194/acp-8-5801-2008, 2008.
Kockarts, G.: Nitric oxide cooling in the terrestrial
thermosphere, Geophys. Res. Lett., 7, 137–140,
doi:10.1029/GL007i002p00137, 1980.
Leinert, Ch., Bowyer, S., Haikala, L. K., Hanner, M. S., Hauser, M. G., Levasseur-Regourd, A.-Ch., Mann, I., Mattila, K., Reach, W. T., Schlosser, W., Staude, H. J., Toller, G. N., Weiland, J. L., Weinberg, J. L., and Witt, A. N.: The 1997 reference of diffuse night sky brightness, Astron. Astrophys. Suppl. Ser., 127, 1–99, 1998.
L´opez-Puertas, M. and Taylor, F. W.: NO 5.3 µm cooling, in Non-LTE Radiative Transfer in the Atmosphere, 343–344, World Sci-entific Publishing Co. Pte. Ltd., Singapore, 2001.
Love, S. G. and Brownlee, D. E.: A direct measurement of the ter-restrial mass accretion rate of cosmic dust, Science, 262, 550– 553, 1993
Mathews, J. D., Janches, D., Meisel, D. D., and Zhou, Q. H.: The micrometeroid mass flux into the upper atmosphere: Arecibo re-sults and a comparison with prior estimates, Geophys. Res. Lett., 28, 1929–1932, 2001.
McDade, I. C., Llewellyn, E. J., Greer, R. G. H., and Murtagh, D. P.: ETON 3: Altitude profiles of the nightglow continuum at green and near infrared wavelengths, Planet. Space Sci., 34, 801–810, 1986a.
McDade, I. C., Murtagh, D. P., Greer, R. G. H., Dickinson, P. H. G., Witt, G., Stegman, J., Llewellyn, E. J., Thomas, L., and Jenkins, D. B.: ETON 2: Quenching parameters for the proposed precur-sors of O2(b1P+
g)and O(1S) in the terrestrial nightglow, Planet. Space Sci., 34, 789–800, 1986b.
Megner, L., Siskind, D. E., Rapp, M., and Gumbel, J.: Global and temporal distribution of meteoric smoke: A
two-dimensional simulation study, J. Geophys. Res., 113, D03202, doi:10.1029/2007JD009054, 2008.
Meriwether Jr., J. W.: A review of the photochemistry of selected nightglow emissions from the mesopause, J. Geophys. Res., 94, 14629–14646, 1989.
Metz, R. B., Nicolas, C., Ahmed, M., and Leone, S. R.: Direct deter-mination of the ionization energies of FeO and CuO with VUV radiation, J. Chem. Phys., 123, 114313, doi:10.1063/1.2032947, 2005.
Murtagh, D. P.: A self-consistent model of the most common night-glow emissions, Proceedings of the Ninth ESA/PAC Symposium on European Rocket and Balloon Programmes and related re-search (ESA SP-291), Lahnstein, Germany, 3–7 April, 1989. Nicolet, M.: Contribution `a l’´etude de la structure de l’ionosph`ere,
Institut royal m´et´eorologique de Belgique, M´emoires, 19, 124, 1945.
Picone, J. M., Hedin, A. E., Drob, P., and Aikin, A. C.: NRLMSISE-00 empirical model of the atmosphere: Statistical composition and scientific issues, J. Geophys. Res., 107, 1468, doi:10.1029/2002JA009430, 2002.
Plane, J. M. C.: Atmospheric chemistry of meteoric metals, Chem. Rev., 103, 4963–4984, 2003.
Plane, J. M. C.: A time-resolved model of the mesospheric Na layer: constraints on the meteor input function, Atmos. Chem. Phys., 4, 627–638, doi:10.5194/acp-4-627-2004, 2004.
Randall, C. E., Harvey, V. L., Siskind, D. E., France, J., Bernath, P. F., Boone, C. D., and Walker, K. A.: NOxdescent in the Arc-tic middle atmosphere in early 2009, Geophys. Res. Lett., 36, L18811, doi:10.1029/2009GL039706, 2009.
Rapp, M. and L¨ubken, F.-J.: Modelling of particle charging in the polar summer mesosphere: Part 1. General results, J. Atmos. Sol.-Terr. Phys., 63, 759–770, 2001.
Rapp, M. and Strelnikova, I.: Measurements of meteor smoke parti-cles during the ECOMA-2006 campaign: 1. Particle detection by active photoionization, J. Atmos. Sol.-Terr. Phys., 71, 477–485, 2009.
Rapp, M. and Thomas, G. E.: Modeling the microphysics of meso-spheric ice particles: Assessment of current capabilities and basic sensitivities, J. Atmos. Sol.-Terr. Phys., 68, 715–744, 2006. Rapp, M., Gumbel, J., and L¨ubken, F.-J.: Absolute density
measure-ments in the middle atmosphere, Ann. Geophys., 19, 571–580, doi:10.5194/angeo-19-571-2001, 2001.
Rapp, M., Strelnikova, I., and Gumbel, J.: Meteoric smoke particles: evidence from rocket and radar techniques, Adv. Space Res., 40, 809–817, doi:10.1016/j.asr.2006.11.021, 2007.
Rapp, M., Strelnikova, I., Strelnikov, B., Hoffmann, P., Friedrich, M., Gumbel, J., Megner, L., Hoppe, U.-P., Robertson, S., Knapp-miller, S., Wolff, M., and Marsh, D. R.: Rocket-borne in situ measurements of meteor smoke: Charging properties and im-plication for seasonal variation, J. Geophys. Res., 115, D00I16, doi:10.1029/2009JD012725, 2010.
Rapp, M., Plane, J. M. C., Strelnikov, B., Stober, G., Ernst, S., Hedin, J., Friedrich, M., and Hoppe, U.-P.: In-situ observations of meteor smoke particles (MSP) during the Geminids 2010: Con-straints on MSP size, work function, and composition, Ann. Geo-phys., in press, 2012.
2008.
Rosinski, J. and Snow, R. H.: Secondary particulate matter from meteor vapors, J. Meteorol. 18, 736–745, 1961.
Rusch, D. W., G´erard, J.-C., Solomon, Solomon, S., Crutzen, P. J., and Reid, G. C.: The effect of particle precipitation events on the neutral and ion chemistry of the middle atmosphere – I. Odd nitrogen, Planet. Space Sci., 29, 767–774, 1981.
Sharp, W. E.: NO2continuum in the aurora, J. Geophys. Res., 83, 4373–4376, 1978.
Sharp, W. E.: On the temperature dependence of the reaction NO+O→NO∗2, Planet. Space Sci., 32, 257–260, 1984. Sheese, P. E., Gattinger, R. L., Llewellyn, E. J., Boone, C. D., and
Strong, K.: Nighttime nitric oxide densities in the southern hemi-sphere mesohemi-sphere-lower thermohemi-sphere, Geophys. Res. Lett., 38, L15812, doi:10.1029/2011GL048054, 2011.
Siskind, D. E., Nedoluha, G. E., randall, C. E., Fromm, M., and Russell III, J. M.: An assessment of southern hemisphere strato-spheric NOxenhancements due to transport from the upper at-mosphere, Geophys. Res. Lett., 27, 329–332, 2000.
Solomon, S., Crutzen, P, J., and Roble, R. G.: Photochemical cou-pling between the thermosphere and the lower atmosphere 1. Odd nitrogen from 50 to 120 km, J. Geophys. Res., 87, 7206– 7220, 1982.
Stevens, M. H., Conway, R. R., Cardon, J. G., and Russell III, J. M.: MAHRSI observations of nitric oxide in the mesosphere and thermosphere, Geophys. Res. Lett., 24, 3213–3216, 1997. Strelnikova, I., Rapp, M., Raizada, S., and Sulzer, M.:
Me-teor smoke particle properties derived from Arecibo incoher-ent scatter radar observations, Geophys. Res. Lett., 34, L15815, doi:10.1029/2007GL030635, 2007.
Strelnikova, I., Rapp, M., Strelnikov, B., Baumgarten, G., Brattli, A., Svenes, K., Hoppe, U.-P., Friedrich, M., Gumbel, J., and Williams, B.: Measurements of meteor smoke particles during the ECOMA-2006 campaign: 2. Results, J. Atmos. Sol.-Terr. Phys., 71, 486–496, 2009.
Strobel, D. F.: Odd Nitrogen in the Mesosphere, J. Geophys. Res., 76, 8384–8393, 1971.
Summers, M. E., Conway, R. R., Englert, C. R., Siskind, D. E., Stevens, M. H., Russel, J. M., Gordley, L. L., and McHugh, M. J.: Discovery of a water vapor layer in the arctic summer mesosphere: Implications for polar mesospheric clouds, Geo-phys. Res. Lett., 28, 3601–3604, 2001.
Thorne, R. M.: The importance of energetic particle precipitation on the chemical composition of the middle atmosphere, Pageogh, 118, Birkh¨auser Verlag, Basel, 1980.
Voigt, C., Schlager, H., Luo, B. P., D¨ornbrack, A., Roiger, A., Stock, P., Curtius, J., V¨ossing, H., Borrmann, S., Davies, S., Konopka, P., Schiller, C., Shur, G., and Peter, T.: Nitric Acid Trihydrate (NAT) formation at low NAT supersaturation in Po-lar Stratospheric Clouds (PSCs), Atmos. Chem. Phys., 5, 1371– 1380, doi:10.5194/acp-5-1371-2005, 2005.
von Savigny, C. H. A., McDade, I. C., Shepherd, G. G., and Rochon, Y.: Lower thermospheric nitric oxide concentrations derived from WINDII observations of the green nightglow continuum at 553.1 nm, Ann. Geophys., 17, 1439–1446, doi:10.1007/s00585-999-1439-9, 1999.
von Zahn, U.: The total mass flux of meteoroids into the Earth’s upper atmosphere, Proceedings from the 17th ESA Symposium on European Rocket and Balloon Programmes and Related Re-search (ESASP-590), 33–39, 2005.
Watanabe, K., Marmo, F. F., and Inn, E. C. Y.: Photoionization cross section of nitric oxide, Phys. Rev., 91, 1155–1158, 1953. Whytock, D. A., Michael, J. V., and Payne, W. A.: Absolute rate
constants for O+ NO + N2 →NO2+ N2from 217–500 K, Chem. Phys. Lett., 42, 466–471, 1976.