www.biogeosciences.net/12/7299/2015/ doi:10.5194/bg-12-7299-2015
© Author(s) 2015. CC Attribution 3.0 License.
Reviews and syntheses: Soil N
2
O and NO emissions from land use
and land-use change in the tropics and subtropics: a meta-analysis
J. van Lent1,2, K. Hergoualc’h1, and L. V. Verchot1,3
1Center for International Forestry Research (CIFOR), Jl. CIFOR, Situ Gede, Bogor 16115, Indonesia 2Department of Soil Quality, Wageningen University, Wageningen, the Netherlands
3Earth Institute Center for Environmental Sustainability, Columbia University, New York, USA
Correspondence to: J. van Lent (j.lent@cgiar.org)
Received: 15 April 2015 – Published in Biogeosciences Discuss.: 11 August 2015
Revised: 17 November 2015 – Accepted: 19 November 2015 – Published: 14 December 2015
Abstract. Deforestation and forest degradation in the tropics
may substantially alter soil N-oxide emissions. It is partic-ularly relevant to accurately quantify those changes to prop-erly account for them in a REDD+climate change mitigation scheme that provides financial incentives to reduce the emis-sions. With this study we provide updated land use (LU)-based emission rates (104 studies, 392 N2O and 111 NO
case studies), we determine the trend and magnitude of flux changes with land-use change (LUC) using a meta-analysis approach (44 studies, 135 N2O and 37 NO cases) and
evalu-ate biophysical drivers of N2O and NO emissions and
emis-sion changes for the tropics.
The average N2O and NO emissions in intact upland
tropical forest amounted to 2.0±0.2 (n=90) and 1.7±0.5 (n=36) kg N ha−1yr−1, respectively. In agricultural soils annual N2O emissions were exponentially related to N
fer-tilization rates and average water-filled pore space (WFPS) whereas in non-agricultural sites a Gaussian response to WFPS fit better with the observed NO and N2O emissions.
The sum of soil N2O and NO fluxes and the ratio of N2O to
NO increased exponentially and significantly with increas-ing nitrogen availability (expressed as NO−3 /[NO−3+NH+4]) and WFPS, respectively; following the conceptual Hole-In-the-Pipe model. Nitrous and nitric oxide fluxes did not in-crease significantly overall as a result of LUC (Hedges’sdof 0.11±0.11 and 0.16±0.19, respectively), however individ-ual LUC trajectories or practices did. Nitrous oxide fluxes in-creased significantly after intact upland forest conversion to croplands (Hedges’sd=0.78±0.24) and NO increased sig-nificantly following the conversion of low forest cover (sec-ondary forest younger than 30 years, woodlands, shrublands)
(Hedges’sd of 0.44±0.13). Forest conversion to fertilized systems significantly and highly raised both N2O and NO
emission rates (Hedges’sd of 1.03±0.23 and 0.52±0.09, respectively).
Changes in nitrogen availability and WFPS were the main factors explaining changes in N2O emissions following LUC,
therefore it is important that experimental designs monitor their spatio-temporal variation. Gaps in the literature on N oxide fluxes included geographical gaps (Africa, Oceania) and LU gaps (degraded forest, wetland (notably peat) forest, oil palm plantation and soy cultivation).
1 Introduction
Land use (LU) and land-use change (LUC) are important contributors to global greenhouse gas (GHG) emissions. The current contribution of LUC to total anthropogenic GHG emissions is estimated to be between 7 and 18 % (Houghton, 2003; Baumert et al., 2005; Baccini et al., 2012; Harris et al., 2012). This estimation heavily depends on biomass val-ues and deforestation rates and is associated with high uncer-tainties, especially in the tropics (Houghton, 2005). Causes of LUC are a complex and interacting combination of eco-nomic, social and political factors (Lambin et al., 2001, 2003). However, population growth and agricultural export correlate well with forest conversion rates (DeFries et al., 2010). A recent comparative study showed commercial and subsistence agriculture to be the most prevalent deforestation driver in non-Annex I (i.e. developing) countries (Hosonuma et al., 2012). Between 1980 and 2000, 83 % of the new
2
cultural land within the tropical region were converted from intact or disturbed forest (Gibbs et al., 2010). As the world population and food demand are expected to grow (respec-tively 34 and 70 % by 2050, FAO, 2009), further deforesta-tion is likely in the near future.
By avoiding deforestation and forest degradation and through enhancing carbon (C) stocks in forests, reducing worldwide GHG emissions could be achieved with a reason-able level of cost-efficiency (Stern, 2008; Streck and Parker, 2012). However, for climate change mitigation schemes such as reducing emissions from deforestation and forest degrada-tion (REDD+), where payments are based on performance, it is crucial to know how much emissions can be mitigated by preventing deforestation and reforesting. In addition to carbon dioxide (CO2), several studies on LUC in the
trop-ics reported high non-CO2GHG emissions, such as nitrous
oxide (N2O) (e.g. Ishizuka et al., 2005; Keller et al., 2005;
Takakai et al., 2006; Verchot et al., 2006; Yashiro et al., 2008) and nitric oxide (NO) (e.g. Verchot et al., 1999; Erickson et al., 2002; Pérez et al., 2007; Davidson et al., 2008). Al-though the absolute mass of N2O emissions might be small,
the global warming potential for N2O over a 100-year time
horizon is 298 times greater than that of CO2(Myhre et al.,
2013). In addition this trace gas also contributes to ozone depletion in the stratosphere (Crutzen, 1970). Nitric oxide, on the other hand, is a free radical that enhances ozone pro-duction in the troposphere (lower atmosphere) (Chameides et al., 1992); ozone in the troposphere is a GHG (Myhre et al., 2013). Although NO is in fact an indirect GHG, it is relevant to study its dynamic in combination with that of N2O as they
share the same processes of production (nitrification and den-itrification) in the soil and are hypothesized to be interlinked (Firestone and Davidson, 1989).
Emissions factors in the IPCC guidelines for national GHG inventories (2006) have high uncertainties although some of these were slightly reduced in the 2013 wetlands supplement (Drösler et al., 2014). On the one hand, this high uncertainty can be explained by the high temporal and spa-tial variability of N2O and NO emissions which are known
to vary diurnally, seasonally (see e.g. Meixner et al., 1997; Chen and Huang, 2009; Lin et al., 2010), and locally due to micro site-specific soil variability (Dalal and Allen, 2008). On the other hand, the high uncertainty is partly due to the paucity of reliable estimates available in the peer-reviewed literature.
Sources of biogenic N2O and NO fluxes from the soil
can be a wide variety of microorganisms and processes (An-derson and Poth, 1989), but nitrification and denitrification are the main mechanisms (Davidson et al., 2000; Baggs and Philippot, 2010). Therefore, the magnitude of N2O and NO
fluxes depends on variables that enhance or inhibit nitrifica-tion and denitrificanitrifica-tion such as nitrogen (substrate) availabil-ity, soil water content (aeration status), soil temperature and pH (Skiba and Smith, 2000; Heinen, 2006; Dalal and Allen, 2008). Substrates for nitrification and denitrification are
am-monium and nitrate, respectively. Amam-monium (NH+4)is the result of microbial decomposition of soil organic matter and is converted to nitrate (NO−3)by the nitrifying bacteria un-der aerobic conditions. In this process, N2O and NO are
pro-duced and partly emitted to the atmosphere. NO−3 in return is used under anaerobic conditions as a terminal electron accep-tor for denitrifying bacteria that reduce NO−3 to N2. Along
this reduction gradient N2O and NO are also produced and
partly emitted to the atmosphere (Anderson and Poth, 1989; Baggs and Philippot, 2010).
Both nitrification and denitrification produce N2O and NO
but are influenced differently by the same soil variables. Therefore, models predicting N2O and NO fluxes need to
consider both processes. Firestone and Davidson (1989) pro-posed a conceptual model – dubbed the “Hole-In-the-Pipe” (HIP) model – that uses two levels of control for N2O and NO
emissions in soils. The first level of control is nitrogen avail-ability, symbolized as the amount of N flowing through the pipes. The second level of control is generally represented by the soil aeration status, explained as the size of the holes in the pipe through which N2O and NO “leak” into the
at-mosphere. The HIP-model and its underlying assumptions were tested under distinct conditions, which showed that soil nitrogen availability could be expressed in different ways. Davidson et al. (2000) tested several indicators and found that the C/N ratio of litterfall and the ratio of NO−3 to the sum of NO−3 and NH+4 were promising proxies of N cycling. Underlining the importance of rapid cycling N in N-oxide production, Purbopuspito et al. (2006) showed a good cor-relation betweenδ15N signatures of litter and soil and emis-sions of N2O in Indonesia. Veldkamp et al. (1998) suggested
that, in N-fertilized systems of Costa Rica, the major fac-tor controlling N2O emissions was the soil aeration status
(second level of control), as N availability exceeded demand. The soil aeration status is commonly expressed by the water-filled pore space (WFPS) (Linn and Doran, 1984); with a high WFPS meaning a low aeration (Heinen, 2006). Nitric oxide is mainly produced when the WFPS is below field ca-pacity, whereas N2O is produced at higher WFPS,
exceed-ing field capacity (Davidson et al., 1991, 1993; Dobbie et al., 1999; Davidson and Verchot, 2000; Bateman and Baggs, 2005). Depending on soil texture, the field capacity is at a WFPS of around 60 %; whenever the WFPS exceeds 80 %, most of the N is expected to be denitrified into N2.
The goal of this study was to review how the emissions of N2O and NO in the tropics were affected by LU and LUC
Hedges’d (Koricheva et al., 2013) metric to evaluate LUC effects. This is a standardized mean difference similar to the Hedges’gbut adjusted for small sample sizes. Finally we ran a meta-analysis regression to express the changes in emission rates following LUC as a function of environmental and soil variables changes.
2 Material and methods
We followed three main steps to assess how soil N2O and
NO emissions were affected by LU and LUC in the tropics and subtropics: (i) compiling a database of all studies on soil N2O and NO fluxes, selecting those integrating seasonal
vari-ation in their experimental design and categorizing LU types; (ii) estimating average emission rate per LU category and exploring biophysical factors affecting them; and (iii) char-acterizing the magnitude of emission change due to LUC us-ing a meta-analysis approach and evaluatus-ing how this change could be expressed as a function of the change in biophysical factors through a meta-analysis regression.
2.1 Data collection and calculation
The database of Stehfest and Bouwman (2006) (available at: www.mnp.nl/en/publications/2006) was used as a basis for our research. From this data set, we extracted the 102 studies located in the tropics and subtropics (hereafter collectively referred to as “tropics”), defined as climate types 3–6, using the climate classification defined by De Pauw et al. (1996). We then extended the database by including 279 additional peer-reviewed studies published between 1990 and 2013 on soil emissions of NO and/or N2O in the tropics. A
combi-nation of the following keywords were used in the ISI Web of Science and ScienceDirect search engines: N2O, nitrous
oxide, NO, nitric oxide, emissions, fertilizers, forest, arable, grasslands, flux, nitrification, denitrification, land use, NOx, nitrogen-oxide, tropics, subtropics. As N2O and NO fluxes
are known to vary seasonally (e.g. Meixner et al., 1997; Chen and Huang, 2009), we manually selected the studies that measured the fluxes during both dry and wet seasons. The 103 studies selected (Supplement S1), representing 392 N2O
and 111 NO LU case studies, were used to estimate annual mean N-oxides emission rates per LU category and to an-alyze their relationship with environmental proxies. Out of the 104 papers 44 measured N2O and/or NO emissions
syn-chronically in at least two different LUs, one of which was a forest. These 44 papers represented 135 N2O and 37 NO
LUC case studies which were analyzed using a meta-analysis statistical approach (Supplement S2).
We summarized the number of studies and assessed the representation of LU per continent categorizing them in five geographical areas: North-Central America, South America, Africa, South Asia and Oceania. Average annual emission rates were expressed in kg NO-N or N2O-N ha−1 yr−1
us-ing the estimates provided by the papers. Whenever annual fluxes were not provided by the authors, we calculated them. For studies covering year-round measurements, the annual flux was calculated by scaling up the units from hours or days to a year and cm2 or m2 to ha. Where possible re-ported fluxes were weighed according to their time inter-val. For instance, for studies covering measurements made during the dry and wet seasons, the annual flux was calcu-lated as the sum of each seasonal flux weighted by the num-ber of days per year corresponding to each season. The bio-physical variables associated with N2O and NO emissions
from the publications were also expressed as annual aver-ages. Soil variables (temperature, WFPS, bulk density, pH, C content, N content, NH+4 and NO−3)are from the soil top layer (0–10 cm). Nitrogen fertilization and litterfall are given as a mass of nitrogen per hectare per year. In some cases the water-filled pore space (WFPS, %) was manually calculated as a function of the gravimetric water content (m, g g−1d.w.), bulk density (yrd, g cm−3)and particle density (yrs, g cm−3) as WFPS=100×(m×yrd) /(1−(yrd/yrs))(Linn and Do-ran, 1984). A yrs default value of 2.65 g cm−3was used for mineral soils (Hillel, 1980), whenever not provided by the studies. Nitrogen fixation was considered by using a dichoto-mous variable indicating the presence or absence of N2
fix-ing species in the LU. Nitrogen fixation rates were barely re-ported and could not be included. For studies measuring N2O
and NO simultaneously, we calculated the ratio and sum of the two and tested their correlation with WFPS and soil N availability. The latter is expressed as the relative fraction of NO−3 to total inorganic N (NO−3 /[NO−3+NH+4]).
Three LU case studies from Takakai et al. (2006) and the celery plot in Xiong et al. (2006) were excluded from the analysis because the very high fertilizations rates were about three times higher than the International Fertilizer industry Association (IFA) recommended dose for the studied crops.
2.2 Land use and land-use change characterization
The LU were classified into nine main categories: (1) for-est (primary forfor-est and secondary forfor-est older than 30 years), (2) wetland forest (swamp on peat, swamp on mineral soil and riparian forest), (3) low forest cover (low canopy clo-sure: woodlands and shrublands, secondary forest younger than 30 years), (4) degraded forest (human-induced low for-est cover after logging and burning or fallows), (5) agro-forestry systems, (6) plantations (mono-specific plantations, e.g. Acacia, rubber, oil palm, cinnamon), (7) pastures (pas-tures and grasslands), (8) rice fields, and (9) croplands (an-nual and perennial crops). For agroforestry, plantation, pas-ture, rice and cropland both fertilized and unfertilized cases were combined and the effect of fertilization was tested sep-arately. Only a few studies included age after conversion in a chronosequential sampling design; therefore we pulled to-gether LU cases from different studies to evaluate the change in emission rates as a function of time since conversion.
2
The studies either focused on a specific LUC type (e.g. for-est conversion to pasture), or considered several LUC types which were representative for the study region. In the latter case, when only one control (forest) site was available, we used the same control for all converted sites. Whenever sev-eral control sites were available in a study we averaged the fluxes from all control sites. When a study measured emis-sions for several years, each year was considered a separate case. The following LUC were analyzed: forest to degraded forest, agroforestry, plantation, pasture and cropland; wet-land forest to degraded forest, plantation, pasture and rice; degraded forest to agroforestry; low forest cover to planta-tion, pasture and cropland. The effect of primary forest con-version to secondary forest is not included in this study as secondary forest (> 30-years old) and primary forest were merged into a single category. The same holds for logging impacts in degraded forests.
2.3 Statistics
Statistical analysis was performed using the software IBM SPSS Statistics for Windows 21.0 (IBM Corp. 2012) and sta-tistical significance was set at a maximum probability level of 5 %. The normality of the flux distribution was tested us-ing the test of Shapiro-Wilks. Neither NO and N2O nor their
log-transformed values were normally distributed hence a generalized linear model with a post-hoc pair-wise compar-ison was performed for comparing the fluxes between LU. Throughout the text averages are followed by standard errors (±SE).
Stepwise multiple linear regression was performed to identify the environmental variables that were significantly related to soil fluxes of N2O and NO. Variables available in
< 10 % of all study cases were excluded to obtain a suffi-cient sample size for the regression. In order to maximize the data availability we used pair-wise exclusion for deal-ing with missdeal-ing values. We also excluded predictor vari-ables that were collinear (multicollinearity test, VIF statis-tics) to other variables already included in the model. A non-linear Gaussian function was fit between N2O, NO fluxes and
WFPS using averages per 10 % WFPS intervals.
Meta-analysis
A meta-analysis was used to quantify the effect of LUC on soil annual N2O and NO fluxes. For this we used the software
Comprehensive Meta-Analysis version 2.2.064 (Biostat Inc., New Jersey, USA) and MetaWin 2.0 (Sinauer Associates, Sunderland, Massachusetts). We defined N2O or NO
emis-sions after land-use change as being the treatment and N2O
or NO emissions before land-use change as being the control. Hedges’d (d) was used as metric to evaluate the effect size
of LUC on N2O and NO fluxes. This metric is defined as:
d= XT−XC
S ×J (1)
S= s
(NC−1)(SDC)2+(NT−1)(SDT)2
NC+NT−2
(2)
J=1− 3
4(NC+NT−2)−1
(3)
whereXT andXC are the average N2O or NO flux (in kg
N ha−1yr−1)of the treatment and control, respectively; S is the pooled standard deviation from the control and treat-ment flux standard deviations (SDCand SDT)andJ is the
correction factor calculated from the sample sizes (NT and
NC). The effect size (d) for all LUC case studies combined,
or that for a particular LUC type, was assessed using a ran-dom model which allows for a varying true effect size be-tween studies (Gurevitch and Hedges, 1999; Borenstein et al., 2009). Ad equal or smaller than 0.2 indicates a small effect size, a d around 0.5 a medium one and a d> 0.8 a large effect. Positive and negatived’s respectively imply an increase and decrease in N2O or NO emission after LUC,
respectively.
Calculation ofdrequires knowledge of the standard devia-tion and sample size associated with the average N2O or NO
flux rate. Whenever these were not available in the publica-tion we contacted the authors, calculated it ourselves using the methodological description of the experimental design or measured it from the figures of the papers using PlotDigitizer 2.5.1 (Huwaldt, 2011).
Publication bias for studies with significant and/or high ef-fect sizes was assessed using a normal quantile plot (Wang and Bushman, 1998). Deviation from linearity of the ob-served distribution suggests publication bias while gaps in the plotted scatter plot indicate that certain effect sizes are missing in the published literature (Borenstein, 2009).
Heterogeneity of effect sizes was assessed with theQand I2 statistics. A significantQoverall means that the variance
among LUC study cases is greater than that expected by sam-pling. In a heterogeneous data set, the (1−I2)statistic quan-tifies the variation within case studies andI2 the variation that could be explained by other variables (or “real varia-tion”).I2of 25, 50, 75 % are, respectively considered as low, moderate and high (Borenstein, 2009). AnI2> 0 shows that a proportion of the observed variation is real; thus, subgroup division into LUC types and/or meta-analysis regression can be used (Gurevitch and Hedges, 1999). LUC effect sizes ob-tained from a low sample size are likely to be influenced by random deviations; hence their interpretation should be han-dled with caution.
the standardized mean difference of an environmental param-eter was affecting that of soil N2O or NO emissions. A
meta-analysis regression is considered robust when it includes ten case studies at least (Borentstein, 2009; Higgins and Green, 2011).
3 Results
3.1 Exploring the data set
The publication rate of peer-reviewed papers on LU and soil emissions of N2O and NO in the tropics has more than
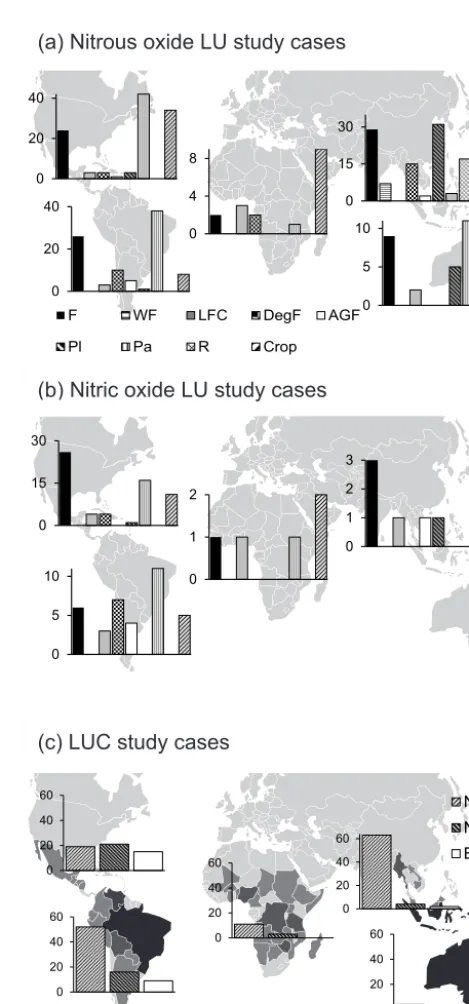
dou-bled over the past decade (less than 2 publications yr−1 be-fore 2000, more than 5 yr−1 afterwards), but remains low. The Americas (combining North-Central and South Amer-ica) and South Asia represented the majority of the data set (n=229 andn=137), while Africa and Oceania were un-derrepresented (n=21 andn=35, respectively; Fig. 1).
LU types studied varied substantially across continents (Fig. 1). In South Asia 61 % of the LUs studied were crop-lands, rice fields or plantations, while these were only 13 % in South America. Some LUs were geographically well rep-resented while others were clustered in one continent. For in-stance, agroforestry systems were spatially well represented, although few in numbers (n=8), while rice paddies were mostly studied in Asia. Studies on wetland forest were un-derrepresented (n=7) and restricted to South Asia (Fig. 1a). Ninety-four percent of the LU case studies on soil fluxes of NO were in North-Central and South America (respectively, n=62 and n=36). In Africa and South Asia, respectively, only five and eight LU case studies were found, while Ocea-nia had no measurements at all.
3.2 Average land-use emissions and environmental
parameter values
Neither N2O nor NO fluxes were normally distributed and
about 90 % of the observations were below 10 kg N2O-N and
8 kg NO-N ha−1yr−1. Table 1 shows average annual N2O
and NO emissions per LU and environmental parameter as-sociated. Croplands displayed the highest N2O emission rate
and also the highest average N fertilization rate. Both pas-tures and rice fields had relatively high N2O emissions;
how-ever, these were characterized by a high variation. The av-erage NO emission rates did not show any significant differ-ence between LU.
The availability of environmental parameters in studies on N-oxides emissions was variable. For example, only 4 % of the studies reported nitrogen input through litterfall, while precipitation was given in 91 % of all cases. Although the comparison of values from different data sources may gen-erate inconsistencies, some generalizations per LU category can be made. Overall, intact forest had a significantly lower bulk density compared to more compacted soils from pas-tures. Wetland forest soils had a significant lower bulk
den-0 20 40 60 0 20 40 60
0 20 40 60
0 20 40 60 0 20 40 60
0
20
40
60
020 40
0 20
40 0
15 30
0 4 8
0 5 10
N2O NO Both
(c) LUC study cases
0 15 30
0 5 10
0 1 2 3
0 1 2
(b) Nitric oxide LU study cases
(a) Nitrous oxide LU study cases
0 15 30 F
F WF LFC DegF AGF
[image:5.612.307.542.53.556.2]Pl Pa R Crop
Figure 1. Spatial distribution of land use case studies on soil fluxes of (a) N2O and (b) NO per land use category in the tropics. Land uses are abbreviated as F: forest, WF: wetland forest, LFC: low for-est cover, DegF: degraded forfor-est, AGF: agroforfor-estry, Pl: plantation, Pa: pasture, R: rice and Crop: cropland.yaxes of the diagrams rep-resent number of case studies per land use. Land use case studies from Europe are omitted (n=2). (c) Spatial distribution of land-use change case studies on soil N2O and NO fluxes, compared to a map
of annual loss of forest area by country between 2005 and 2010. The four shades of grey, from black to light grey, respectively rep-resent > 500, 500–250, 250–50 and < 50 net loss of area in 1000 ha. Adapted from FAO (2010).
sity compared to all other soils. Wetland forest soils were more acidic than other soils in general, while cropland soils were significantly less acidic than forest soils. Mineral N content did not differ significantly between LU, except for high NH+4 and NO−3 concentrations in wetland forest and rice paddy soils. Plantation soils were the only ones where NO−3 concentrations exceeded those of NH+4, other LU showed the opposite trend. Carbon and nitrogen content in the soils of natural wetland forest were very high and significantly higher than that in all other LUs. Degraded forest soils showed a high carbon content which is due to the inclusion of eleven degraded peat forests out of the twenty cases. Excluding them resulted in a soil carbon content of 3.8 %.
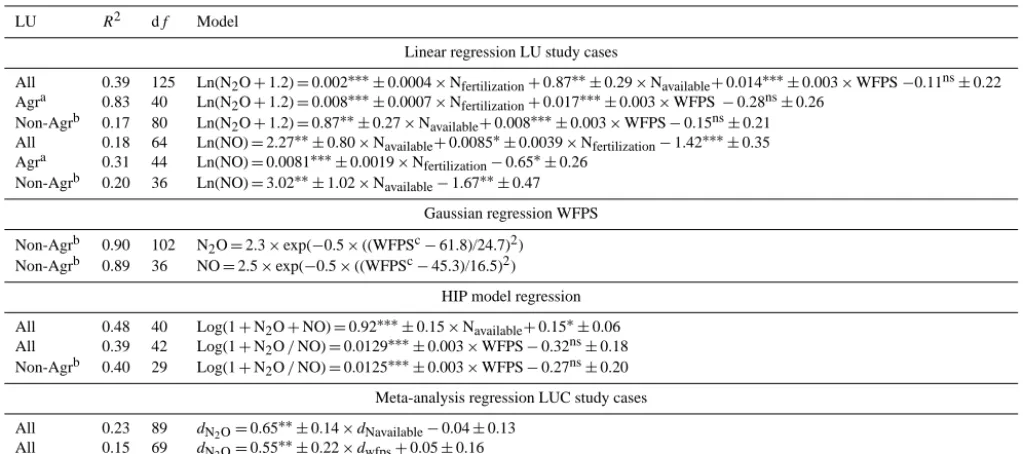
The multiple linear regression analysis indicated that N fertilization, WFPS, and N availability (expressed as [NO−3 /(NO−3+NH+4)]) were the best proxies for estimat-ing overall soil fluxes of N2O (Table 2). For agricultural
sites (i.e. crop and pasture) N fertilization rate explained part of the variation (R2=0.31, df =160,p <0.01); but (pair-wise) including the WFPS more than doubled the R squared. Proxies for overall soil NO fluxes were N availability and N fertilization. For agricultural sites N fertilization explained 31 % of the variation in NO fluxes, and the inclusion of the WFPS did not improve the relationship. In non-agricultural LUs a non-linear Gaussian function of the WFPS simulated with good fit N2O and NO fluxes (Fig. 2, Table 2). The
re-lationship indicates that NO and N2O fluxes peak at WFPS
of 45 and 61 %, respectively. The ratio of N2O to NO
dis-played an exponential relationship with the WFPS (Fig. 3, Table 2), which indicates N-oxide emissions predominantly in the form of N2O (i.e. N2O/NO > 1) above a WFPS of
48 %. In non-agricultural sites the predominance of N2O
over NO happens at a slightly lower WFPS (46 %). The sum of soil N2O and NO emissions also increased exponentially
with increasing N availability.
Time since conversion was available in 26 % of the LU cases only. Nitrous oxide fluxes from non-fertilized crop-lands appeared to be higher the first 10 years after conver-sion and thereafter decreasing, whereas fluxes from fertilized croplands remained high (Fig. 4). For pastures the pattern was less apparent, the first years after conversion both high and low fluxes were observed.
3.3 Land-use change effects on N2O and NO emissions
and environmental parameters
Land-use change effects were evaluated by looking at dif-ferences in emissions after and before LUC. This was done for each LUC type and for all LUC combined. The effect sizes of LUC on N2O emissions were not strictly normally
distributed; however, all effect size ranges were present. De-viation from linearity occurred for high and low effect sizes indicating a potential bias for published studies measuring large effects following LUC. A normal quantile plot for NO emissions as affected by LUC indicated a normal
distribu-0.0 1.0 2.0 3.0 4.0 5.0
0 20 40 60 80 100
N
-f
lux
(
k
g
N ha
-1
y
r-1)
WFPS (%)
[image:7.612.309.546.64.281.2]Observed NO Observed N2O Gaussian NO Gaussian N2O
Figure 2. Gaussian relationships (dashed lines) between the WFPS and N2O and NO emissions in non-agricultural land uses. N2O and NO fluxes are averaged in 10 % WFPS intervals. Error bars are N flux standard errors in each WFPS interval.
tion; however, some gaps were present in the observed val-ues, possibly due to a biased representation of NO emission changes in the literature.
Nitrous oxide emissions were not affected overall by LUC (d=0.11±0.11); the slight increasing trend was not signif-icant because of opposing effects in different LUC trajecto-ries (Table 3). The LUC case studies overall did not share a common effect size (Qoveral=221.3P< 0.01) and the
ma-jority of the variation was within case studies (1−I2, 59 %). Similarly to N2O emissions, and for the same reason, NO
emissions were not overall affected by LUC; with a homoge-neous effect size (Qoverall=31.7,P=0.67) and 47 % of the
variation within LUC case studies (1−I2).
Most studies focused on forest clearing for croplands (nF-Crop+nWF-Crop+nDegF-Crop=44) and pastures (nF-Pa+
nWF-Pa+nDegF-Pa=42). Transition from intact upland
for-est to croplands significantly increased N2O emissions, while
conversion to agroforestry showed a slight, but insignifi-cant increasing trend. Intact forest conversion to pasture (F-Pa) tended to decrease N2O emissions, whereas low forest
cover conversion to pasture (LFC-Pa) showed the opposite trend. Further, conversion of low forest cover significantly increased NO emissions overall.
The Hedges’deffect size of forest conversion to fertilized LU amounted to 1.03±0.31 and 0.52±0.23 for N2O and
NO, respectively, indicating significant and high increased emissions after fertilization. Evidence for increased emission following conversion to LU with N fixing crops/trees was weak and fluxes of NO slightly raised but not significantly (dNO=0.61±0.33n=8).
2
Table 2. Multiple regression between soil N2O or NO emissions and associated environmental parameters; and meta-analysis regression between the standardized differences after and before land-use change of N2O emissions (or Hedges’d,dN2O) and of environmental factors
(dNavailable,dwfps). The models are presented with slope and intercept±SE;P values are indicated with∗p <0.05,∗∗p <0.01 and∗∗∗ p <0.001. All regression models were significant (p≤0.01).
LU R2 df Model
Linear regression LU study cases
All 0.39 125 Ln(N2O+1.2)=0.002∗∗∗±0.0004×Nfertilization+0.87∗∗±0.29×Navailable+0.014∗∗∗±0.003×WFPS−0.11ns±0.22
Agra 0.83 40 Ln(N2O+1.2)=0.008∗∗∗±0.0007×Nfertilization+0.017∗∗∗±0.003×WFPS−0.28ns±0.26
Non-Agrb 0.17 80 Ln(N2O+1.2)=0.87∗∗±0.27×Navailable+0.008∗∗∗±0.003×WFPS−0.15ns±0.21
All 0.18 64 Ln(NO)=2.27∗∗±0.80×Navailable+0.0085∗±0.0039×Nfertilization−1.42∗∗∗±0.35
Agra 0.31 44 Ln(NO)=0.0081∗∗∗±0.0019×Nfertilization−0.65∗±0.26
Non-Agrb 0.20 36 Ln(NO)=3.02∗∗±1.02×Navailable−1.67∗∗±0.47
Gaussian regression WFPS Non-Agrb 0.90 102 N2O=2.3×exp(−0.5×((WFPSc−61.8)/24.7)2)
Non-Agrb 0.89 36 NO=2.5×exp(−0.5×((WFPSc−45.3)/16.5)2)
HIP model regression All 0.48 40 Log(1+N2O+NO)=0.92∗∗∗±0.15×Navailable+0.15∗±0.06
All 0.39 42 Log(1+N2O/NO)=0.0129∗∗∗±0.003×WFPS−0.32ns±0.18
Non-Agrb 0.40 29 Log(1+N2O/NO)=0.0125∗∗∗±0.003×WFPS−0.27ns±0.20
Meta-analysis regression LUC study cases
All 0.23 89 dN2O=0.65∗∗±0.14×dNavailable−0.04±0.13
All 0.15 69 dN2O=0.55
∗∗±
0.22×dwfps+0.05±0.16
N2O and NO are expressed in kg N2O-N yr−1or N-NO ha−1yr−1, Navailableis (NO−3/[NO
−
3+NH
+
4]) without units, NO
−
3and NH
+
4in µg N g
−1d.w., N
fertilizationin kg N ha−1yr−1and WFPS in %.
aAgr includes cropland and pasture.bNon-Agr includes forest, low forest cover, degraded forest, agroforestry and plantation.cWFPS intervals of 10 %.
The results of the meta-regression, which was run pooling all LUC case studies together, are presented in Table 2. The change in N2O fluxes as affected by LUC was positively
re-lated to changes in N availability and WFPS. No significant relationships were found for NO. The interactive effect of WFPS and N availability change on N2O flux change is
illus-trated in Fig. 5. Whenever N availability increased after LUC (dNavailability> 0) the increase in N2O emissions (dN2O> 0)
was exacerbated if the WFPS also increased (dWFPS> 0),
or diminished if the WFPS was decreased (dWFPS< 0). The
slope of the regression between dN2O and dNavailibility was
raised by 143 % for the dWFPS> 0 cases, reduced by 58 %
fordWFPS<0 cases.
4 Discussion
4.1 Data set representativeness and average annual LU
emissions
The body of research on LULUC and N2O and NO emissions
in the Tropics has increased during the past decade; however, Africa and Oceania remain strongly underrepresented. Most of Africa’s LU case studies were from (converted) savannahs although Africa has a variety of forest types unaccounted for at present in the literature. Furthermore, a comparison be-tween the spatial distribution of LUC case studies and global forest conversion for 2005–2010 (FAO, 2010) shows that highest deforested areas overlapped well with studies on N
emissions from LUC except for Oceania and Africa (Fig. 1c). These regions need more research on soil N2O and NO
emis-sions, in representative LULUC categories. Sampling bias was not only geographical; some biofuel or food crops such as oil palm and soy were also underrepresented (noil palm=7
and nsoy=4) although they are the most rapidly
expand-ing perennial and annual crop in the tropics (Phalan et al., 2013). Land-use change categories were also not equally rep-resented; there was a dominance of studies on forest conver-sion to croplands and pastures. Only a few cases (10–13 %) assessed the effect of nitrogen fertilization or the use of N-fixing species after LUC. Those studies took place in Latin America (Matson et al., 1996; Veldkamp and Keller 1997; Veldkamp et al., 1998) and Asia (Verchot et al., 2006; Veld-kamp et al., 2008). Some wetland forest conversion study cases showed high effect sizes for N2O emissions (Hadi et
al., 2005; Furukawa et al., 2005; Jauhiainen et al., 2012), but the overall tendency of wetland forest conversion to increase N2O emissions was not significant (Table 3) as observed by
(a)
(b)
0 0.5 1 1.5 2
20 40 60 80 100
L
o
g
(1
+
N
O
/N
O
)
WFPS (%) Linear All Non-Agr Agr
0.0 0.5 1.0 1.5 2.0
0.0 0.2 0.4 0.6 0.8
N available
2
L
o
g
(1
+
N
O
/N
O
)
[image:9.612.316.540.64.483.2]2
Figure 3. Relationships between (a) the WFPS and the ratio of N2O to NO; (b) Navailable (NO−3/[NO−3+NH+4]) and the sum of N2O
and NO. The domains of definition are (a) [0.02; 44.71] in N2O to
NO ratio and [30.4; 94.4] in WFPS; (b) [0.00; 12.80] in N2O+NO
(kg N ha−1yr−1)and [0.01;0.77] in Navailable.
The annual N2O emission rate in intact upland
for-est (2.0±0.2 kg N2O-N ha−1yr−1, n=88) is more than
twice the value estimated by Stehfest and Bouwman (2006) (0.85 kg N2O-N ha−1 yr−1, n=77) for the tropics. We
excluded the cases considered by Stehfest and Bouw-man (2006) that did not cover seasonal variation, but ended up with a higher sample size by adding studies published after 2005. Our value is also larger than the model es-timations of 1.4 kg N2O-N by Potter et al. (1996) and
1.2 kg N2O-N ha−1yr−1by Werner et al. (2007). Dalal and
Allen (2008) estimated average emissions in tropical
for-(a)
(b)
0.0 2.0 4.0 6.0 8.0
-1 9 19 29
N
2
O
(k
g
N ha
-1yr -1)
Average F Average LFC Crop non-fert Crop fert
0.0 2.0 4.0 6.0
-1 19 39 59
N
2
O
(k
g
N ha
-1yr -1)
[image:9.612.50.282.66.501.2]Time since conversion (years) Average F Average LFC Pa non-fert
Figure 4. Effect of time since conversion on N2O fluxes in (a)
crop-lands and (b) pastures. Average N2O flux and 95 % confidence
in-tervals are given for upland forests (triangle) and low canopy forests (square). The solid and dashed lines represent a conceptual trend for non-fertilized and fertilized cases, respectively.
est of 3.0±0.52 kg N2O-N ha−1yr−1 (n=22) and Kim et
al. (2013a, b) of 1.91 kg N±0.25 (n=69). The annual NO emission rate in tropical forest amounts to 1.7±0.48 kg N-NO ha−1yr−1 (n=36), which is higher than previous esti-mates by Stehfest and Bouwman (2006) (0.39 kg NO-N ha−1 yr−1,n=33), Davidson and Kingerlee (1997) (0.8 kg NO-N ha−1 yr−1,n=15) and Potter et al. (1996) (1.2 kg NO-N ha−1yr−1).
Nitrous oxide emission in agricultural fields and pastures reported by Duxbury et al. (1982) were the largest in the en-tire data set (average emissions of 65 kg N2O-N ha−1yr−1).
The study was conducted in Florida on drained organic
2
Table 3. Hedges’d±SE (n) of N2O (dN2O)and NO (dNO)
emis-sion change following land-use change (LUC). Hedges’ d is the standardized mean difference of N2O (or NO) flux rates after and
before LUC. Ad< 0 indicates a reduction in emission; ad> 0 an increase. Land uses are: F-forest, WF-wetland forest, LFC-low for-est cover, DegF-degraded forfor-est, AGF-agroforfor-estry, Pl-plantation, Pa-pasture, R-Rice and Crop-cropland.
LUC dN2O dNO
F-DegF 0.09±0.29 (15) 0.08±0.34 (5) F-AGF 0.34±0.29 (4) – (1)a
F-Pl 0.06±0.37 (12) –
F-Pa −0.28±0.17 (36) −0.56±0.67 (9) F-Crop 0.78∗±0.24 (19) – (2)a
Overall F 0.11±0.14 (86) −0.19±0.37 (17)
WF-DegF −0.17±0.31 (9) – WF-Pl 1.07±0.42 (3) – WF-Pa 2.37±1.80 (3) – WF-R −0.06±0.62 (9) – Overall WF 0.31±0.34 (24) –
DegF-AGF 0.27±0.19 (4) 0.72±0.28 (4)
LFC-Pl – (2)# –
LFC-Pa 0.47±0.37 (3) −0.06±0.31 (5) LFC-Crop −0.29±0.40 (16) 0.57∗±0.09 (11) Overall LFCb −0.07±0.25 (25) 0.44*±0.13 (20)
Overall LUC 0.11±0.11 (135) 0.16±0.19 (37) Fertilizationc 1.03∗±0.31 (17) 0.52∗±0.23 (12) N fixationc −0.14±0.33 (13) 0.61±0.33 (8)
∗p <0.05; no statistics calculated for studies withn <3.ano statistics
possible.bincluding 4 DegF-AGF LUC cases.cFertilization and N fixation
indicate cases of forest conversion to fertilized LU and LU with N2fixing trees/crops.
soils under crops, grass or kept as fallows; that displayed high N mineralization rates (600–1200 kg N ha−1yr−1). Ex-cluding them decreases the overall average N2O emissions
from 4.4±0.6 (n=387) to 3.5±0.3 kg N2O-N ha−1 yr−1
(n=381), and croplands emissions from 8.6±2.0 (n=93) to 5.8±0.9 kg N2O-N ha−1yr−1(n=88).
4.2 Land-use change effects on the emissions
According to the meta-analysis LUC overall increased N2O
and NO emissions, albeit not significantly. Land-use change types or practices that induced significant changes in emis-sions all pointed towards increased rather than decreased emissions. The meta-analysis confirmed that intact upland forest conversion to croplands and nitrogen fertilization af-ter LUC significantly and highly increased soil emissions of N2O. It also corroborated high increases in NO emissions
after low forest cover conversion in general and when fer-tilizer is applied after LUC. For most LUC trajectories the effect of emission change was not significant even when the sample size was relatively large. For instance, the analysis indicated a trend of decreased N2O emissions following
in--4.0 -2.0 0.0 2.0 4.0 6.0
-2.0 -1.0 0.0 1.0 2.0
d
(
N
O
)
d (N-availability) d(WFPS)>0
d(WFPS)<0 Meta-regression d(WFPS)>0 d(WFPS)<0
[image:10.612.57.277.152.403.2]2
Figure 5. N2O Hedges’d as affected by the interactive changes
in Navailability and WFPS. The meta-analysis regression between dN2OanddNavailabilitywas performed for all cases (solid line) and
for cases whendWFPS> 0 ordWFPS< 0 (dashed lines). Closed and
open circles represent increased and decreased WFPS, respectively.
tact upland forest conversion to pasture, which was not sig-nificant since the LUC studies not all agreed on the direction of change. Several publications reported decreased emissions after conversion to pasture (e.g. Verchot et al., 1999; Erick-son et al., 2001; Garcia-Montiel et al., 2001), others reported the opposite (e.g. Melillo et al., 2001; Takakai et al., 2006) and one showed no effect (Neill et al., 2005). These appar-ent contradicting results have been explained by differences or absence of differences in time after conversion (Keller et al., 1993; Veldkamp et al., 1999; Verchot et al., 1999; Neill et al., 2005; Wick et al., 2005), or the optional practice of slash and burn technique to clear the forest, both affecting N cycling (Luizao et al., 1989; Matson et al., 1990; Steudler et al., 1991; Keller and Reiners, 1994; Neill et al., 1995; Melillo et al., 2001; Garcia-Montiel et al., 2001). Biomass burning produces N2O during fires and may enhance soil N2O
af-terwards by stimulating N mineralization (Skiba and Smith, 2000). The paucity of field observations together with the lack of land-use history description did not allow to evaluate clearing practices effects or temporal trends in soil emission dynamics with LUC thoroughly. For non-fertilized croplands and pastures, the fluxes of N2O tended to increase during the
10-year emission peak. In fertilized croplands on the other hand, the sustained emission increase seems to be driven by high mineral N inputs. This temporal variability in emission change indicates that the first 10 years following LUC are crucial for GHG budget calculations.
We used a meta-analysis statistical approach to assess the trend and magnitude of forest conversion on soil emis-sions of N oxides. Meta-analysis consists in comparing site-specific (pair-wise) effects weighted according to their ro-bustness, therefore it provides a direction and a magnitude of emission change more reliable and precise than those ob-tained by comparing average emission rates per LU category from individual papers. For example, the meta-analysis ef-fect on N2O emissions of intact upland forest conversion to
croplands (0.78) was much higher than the effect calculated (0.48) using average values from Table 1 and Eq. (1). The effect calculated from average emission rate derived from individual studies can also lead to misleading conclusions such as in the case of intact upland forest conversion to pas-ture. The effect calculated from average emissions (0.34) was positive indicating increased emissions as opposed to the meta-analysis conclusion (−0.28). Simple assessments based on average values, in general, encompass more stud-ies than meta-analysis but are biased due to the exclusion of pair-wise evaluations. In order to improve the understanding of LUC on trace gas emissions in general, more studies mon-itoring the fluxes simultaneously in control (forest) and con-verted sites are necessary. Whenever the conversion includes intermediary stages such as short fallows with the practice of slash-and-burn, the corresponding emission rates should be evaluated as well. When focusing on a specific crop/tree a chronosequential approach including different ages since planting should be considered, especially if fertilization rates evolve with time. The first few years after conversion are likely to be hotspots for N oxide emissions and time since conversion is an important factor to be included.
4.3 Biophysical drivers of NO and N2O emission and
emission change
An IPPC Tier 1 approach is generally used by countries in the Tropics to estimate their annual emissions of GHG. Av-erage LU-based emission rates as provided in this paper or the contribution of N applied released as N2O from
agricul-tural soils (IPCC, 2006) illustrate the type of emission factors applied to activity data at a Tier 1 level. This approach is use-ful to compare anthropogenic emissions from different coun-tries but does not capture the variations across climate re-gions for instance (Skiba et al., 2012). Soil fluxes of N2O and
NO are known to be controlled by climate (rainfall, temper-ature), soil conditions (drainage, aeration, texture, pH, etc.) and management (land cover, fertilization rate and type, etc.) (Skiba and Smith, 2000; Ludwig et al., 2001; Butterbach-Bahl et al., 2013). Country- or regional LU-specific emission factors that better account for local climate, soil
manage-ment and properties are defined as Tier 2 level whereas Tier 3 methods usually involves process-based models (Del Grosso et al., 2006). The multiple regression analysis of the data set indicated that tropical N2O and NO fluxes could be expressed
as a combination of nitrogen availability and/or application and WFPS; even though the predictive power for simulat-ing overall N2O emissions was low (R2=0.39). However,
the predictive power of the regressions increases when the database is split up in agriculture and non-agriculture cases (Table 2). The establishment of an emission factor for agri-cultural soils that includes the WFPS in addition to N fertil-ization rate is likely to improve estimates of direct agricul-tural N2O emissions, one of the largest sources of N2O in
most countries. For non-agricultural sites a more mechanis-tic approach appeared to fit better with the observed data. The fluxes of both NO and N2O followed a Gaussian type
rela-tionship with the WFPS – a key determinant for soil anaero-biosis. This type of relationship was hypothesized by David-son (1991), demonstrated in case studies (DavidDavid-son et al., 2000; Davidson and Verchot, 2000; Veldkamp et al., 1998) and used in modeling (Parton et al., 2001; Potter et al., 1996). Its application in the context of the current tropical database confirms a maximum of N2O emissions around a WFPS
of 60 % and indicates maximum NO emissions at a lower WFPS (45 %) than that reported by Davidson et al. (2000) (55 %). It also points out that N2O emissions remain high at
an 80 % WFPS and diminish towards 100 % WFPS. Neither air nor soil temperature were found to affect soil N-oxide fluxes across LUs, although the LU annual average span was wide (12–34 and 14–31◦C for air and soil temperatures). In the temperate zone exponential increases in N2O emissions
with increasing temperature have been reported, whereas in the tropics the evidence is mixed (Skiba and Smith, 2000). Substrate (e.g. N, P) and moisture constraints of microbial processes influencing N-oxide fluxes may reduce the tem-perature effect. Werner et al. (2006), for instance, demon-strated that variations in N2O emissions from tropical
rain-forest soils were mainly affected by soil moisture changes and that temperature changes were of minor importance.
The data confirmed the concepts formulated in the HIP model (Davidson et al., 2000); with the availability of min-eral N in the system (first level of control) controlling in an exponential fashion the (NO+N2O) flux rate, and the WFPS
(second level of control) controlling also in an exponential fashion the ratio of N2O to NO. Although our exponential
models are similar to those obtained by Davidson and Ver-chot (2000) using the TRAGNET database and by David-son et al. (2000) using fluxes from forest to pasture conver-sions in the American Tropics, the magnitude of the coef-ficient is different. For a WFPS between 30 and 60 % the N2O to NO ratio obtained using the relationship of
David-son and Verchot (2000) is five to nine times lower than the one obtained with the relationship developed here. Above a NO−3 /[NH+4+NO−3] ratio of 0.5 the relationship of David-son et al. (2000) departs from the one we developed. For
2
instance, at a 0.75 NO−3 /[NH+4+NO−3] value, we estimate annual NO + N2O emissions of about 6 kg N ha−1 yr−1
whereas the model of Davidson et al. indicates 10 kg N ha−1 yr−1. The probable reason explaining the discrepancy is the temporal scale of the data, we used annual emission rates whereas Davidson et al. used hourly fluxes and thus took into account punctual high emission peaks less apparent in annual budgets. Also, given the nonlinear nature of the functions, an annual budget estimated by summing up fluxes simulated from e.g. hourly WFPS and inorganic N ratio values would lead to a different result than the one simulated from annual WFPS and inorganic N ratio values, as we did. This demon-strates that relationships used in modeling exercises should be developed according to the time step of the model.
Land-use change involves major transformations of the soil-plant-atmosphere continuum. As a result of land-clearing fires, mechanical ploughing and compaction, veg-etation change, fertilization, etc., the soil system is highly altered from its previous state. Soil properties such as bulk density, porosity, moisture, WFPS, temperature, mineral N content and pH are often affected by LUC (Farquharson and Baldock, 2008; Dobbie et al., 1999; Verchot et al., 1999). Fertilization N input after land-use change increases highly and significantly both N2O and NO fluxes, as reported by
many studies, e.g. Stehfest and Bouwman (2006). However, increased emissions after LUC were not exclusively due to fertilization, changes in endogenous levels of soil nitrogen availability or WFPS were also key factors impacting the changes in N2O fluxes. These variables should therefore
sys-tematically be measured and reported. Land-use change gen-erally impacts more than one variable at a time, therefore changes in emissions will most likely result from an interac-tion of factors. This was illustrated by the interactive effect of the changes in N availability and WFPS on N2O emission
changes (Fig. 5).
5 Conclusions
We estimate natural tropical forests to emit 2.0 kg N2
O-N ha−1yr−1on average and emission rates to be significantly increased after conversion to cropland, and to a smaller de-gree to agroforestry. Low forest cover also sees their NO emissions raise significantly after being converted. These LUC trajectories can hence contribute substantially to non-CO2GHG emission increases whenever they represent a
sub-stantial area for a given country. Default Tier 1 N2O and NO
emission factors currently proposed by the IPCC for the trop-ical region are based on a limited number of studies and rely essentially on N inputs. However, mechanisms of N-oxide production are the result of microbial processes controlled by a combination of factors; thus the IPCC Tier 1 approach is somewhat flawed. Here we established a set of predictive re-lationships linking annual soil N2O and NO emissions to
bio-physical parameters and emission changes to biobio-physical
pa-rameter changes. The analysis established that N availability or N inputs as well as the soil WFPS were the key explana-tory factors of emissions or emission changes. In particular, we developed a statistical model for tropical countries allow-ing the calculation of N2O emissions from agriculture as a
function of both N fertilization rate and WFPS. Improving the scientific understanding of N2O and NO fluxes and how
they relate to environmental parameters requires the design of experiments considering the high spatio-temporal varia-tion of the fluxes and associated parameters and the use of standardized measurement methods. Also, studies consider-ing a LUC transition pathway should include in their design all intermediate land use stages (e.g. degraded forest) sus-ceptible to modifying N cycling. Finally, even though the body of research on LUC and N2O and NO emissions has
steadily increased over the past decades, knowledge gaps are still important especially in Africa and Oceania, and for wet-land forest (notably on peat), degraded forest and important world crops such as oil palm plantations and soy fields.
The Supplement related to this article is available online at doi:10.5194/bg-12-7299-2015-supplement.
Acknowledgements. This research was generously supported by
the contributions of the governments of Australia (Grant Agree-ment no. 6167) and Norway (Grant agreeAgree-ment no. QZA-10/0468) and the European Community’s Seventh Framework Programme [FP7/2007-2013] (Grant Agreement no. 226310) to the Center for International Forestry Research. This work was carried out as part of the Consultative Group on International Agricultural Research programs on Climate Change and Food Security (CCAFS). We gratefully thank Luluk Suhada for her work on the bibliography for this study and also all scientists that have measured and published the data that we used.
Edited by: K. Butterbach-Bahl
References
Anderson, I. C. and Poth, M. A.: Semiannual losses of nitrogen as NO and N2O from unburned and burned chaparral, Global
Bio-geochem. Cy., 3, 121, doi:10.1029/GB003i002p00121, 1989. Baccini, a., Goetz, S. J., Walker, W. S., Laporte, N. T., Sun, M.,
Sulla-Menashe, D., Hackler, J., Beck, P. S. a., Dubayah, R., Friedl, M. a., Samanta, S., and Houghton, R. a.: Estimated car-bon dioxide emissions from tropical deforestation improved by carbon-density maps, Nat. Clim. Chang., 2, 182–185, 2012. Baggs, E. M. and Philippot, L.: Microbial terrestrial pathways to
nitrous oxide, in: Nitrous Oxide and Climate Change, Earthscan Ltd, London, UK, 247, 4–35, 2010.
Bateman, E. J. and Baggs, E. M.: Contributions of nitrifica-tion and denitrificanitrifica-tion to N2O emissions from soils at
Baumert, K., Herzog, T., and Pershing, J.: Navigating the Numbers – Greenhouse Gas Data and International Climate Policy, World Resources Institute (WRI),Washington DC, USA, 2005. Borenstein, M., Hedges, L. V, Higgins, J. P. T., and Rothstein, H. R.:
Introduction to Meta-Analysis, statistics in practice series, John Wiley and Sons, Ltd., Cambridge, UK, 2009.
Butterbach-Bahl, K., Baggs, E. M., Dannenmann, M., Kiese, R., and Zechmeister-Boltenstern, S.: Nitrous oxide emissions from soils: how well do we understand the processes and their con-trols?, Philos. Trans. R. Soc. Lond. B. Biol. Sci., 368, 20130122, doi:10.1098/rstb.2013.0122, 2013.
Chameides, W. L., Fehsenfeld, F., Rodgers, M. O., Cardelino, C., Martinez, J., Parrish, D., Lonneman, W., Lawson, D. R., Ras-mussen, R. A., Zimmerman, P., Greenberg, J., Mlddleton, P., and Wang, T.: Ozone precursor relationships in the ambient at-mosphere, J. Geophys. Res., 97, 6037, doi:10.1029/91JD03014, 1992.
Chen, S. and Huang, Y.: Soil respiration and N 2 O emission in crop-lands under different ploughing practices: a case study in south-east China, Aust. J. Soil Res., 47, 198, doi:10.1071/SR07225, 2009.
Crutzen, P. J.: The influence of nitrogen oxides on the atmospheric ozone content, Q. J. R. Meteorol. Soc., 96, 320–325, 1970. Dalal, R. C. and Allen, D. E.: Greenhouse gas fluxes from natural
ecosystems, Aust. J. Bot., 56, 369–407, 2008.
Davidson, E. A.: Fluxes of nitrous oxide and nitric oxide from terrestrial ecosystems, in: Microbial Production and Consump-tion of Greenhouse Gases: Methane, Nitrogen Oxides and Halomethanes, edited by: Rogers, J. E. and Whitman, W. B., American Society for Microbiology, Washington (DC), 219–235, 1991.
Davidson, E. A. and Kingerlee, W.: A global inventory of nitric ox-ide emissions from soils, Nutr. Cycl. Agroecosyst., 48, 37–50, 1997.
Davidson, E. A. and Verchot, L. V.: Testing the hole in the pipe model of nitric and nitrous oxide emission from soils using the TRAGNET database, Global Biogeochem. Cy., 14, 1035–1042, 2000.
Davidson, E. A., Vitousek, P. M., Matson, P. A., Riley, R., García-Méndez, G., and Maass, J. M.: Soil emissions of nitric oxide in a seasonally dry tropical forest of México, J. Geophys. Res., 96, 15439, doi:10.1029/91JD01476, 1991.
Davidson, E. A., Vitousek, P. M., Dunkin, K., Garcia-Mendez, G., and Maass, J. M.: Processes regulating soil emissions of NO and N2O in a seasonally dry tropical forest, Ecology, 74, 130–139,
1993.
Davidson, E. A., Keller, M., Erickson, H. E., Verchot, L. V., and Veldkamp, E.: Testing a Conceptual Model of Soil Emis-sions of Nitrous and Nitric Oxides, Bioscience, 50, 667, doi:10.1641/0006-3568(2000)050[0667:TACMOS]2.0.CO;2, 2000.
Davidson, E. A., De Abreu Sá, T. D., Reis Carvalho, C. J., De Oliveira Figueiredo, R., Kato, M. d. S. A., Kato, O. R., and Ishida, F. Y.: An integrated greenhouse gas assessment of an alternative to slash-and-burn agriculture in eastern Amazonia, Glob. Chang. Biol., 14, 998–1007, 2008.
DeFries, R. S., Rudel, T., Uriarte, M., and Hansen, M.: Deforesta-tion driven by urban populaDeforesta-tion growth and agricultural trade in the twenty-first century, Nat. Geosci., 3, 178–181, 2010.
De Pauw, E., Nachtergaele, F. O., and Antoine, J.: A provi-sional world climatic resource inventory based on the length-of-growing-period concept, in: National Soil Reference Collections and Databases (NASREC), edited by: Batjes, N. H., Kauffman, J. H., and Spaargaren, O. C., Wageningen, ISRIC, 30–43, 1996. Del Grosso, S. J., Parton, W. J., Mosier, A. R., Walsh, M. K., Ojima,
D. S., and Thornton, P. E.: DAYCENT national-scale simula-tions of nitrous oxide emissions from cropped soils in the United States, J. Environ. Qual., 35, 1451–1460, 2006.
Dobbie, K. E., McTaggart, I. P., and Smith, K. a.: Nitrous oxide emissions from intensive agricultural systems: Vari-ations between crops and seasons, key driving variables, and mean emission factors, J. Geophys. Res., 104, 26891, doi:10.1029/1999JD900378, 1999.
Drösler, M., Verchot, L.V., Freibauer, A., Pan, G., Evans, C.D., Bourbonniere, R. A., Alm, J. P., Page, S., Agus, F., Hergoualc’h, K., Couwenberg, J., Jauhiainen, J., Sabiham, S., Wang, C., Sri-vastava, N., Borgeau-Chavez, L., Hooijer, A., Minkkinen, K., French, N., Strand, T., Sirin, A., Mickler, R., Tansey, K., and Larkin, N.: Chapter 2 Drained inland organic soils, in: 2013 Sup-plement to the 2006 guidelines for national greenhouse gas in-ventories, Wetlands, edited by: Hiraishi, T., Krug, T., Tanabe, K., Srivastava, N., Jamsranjav, B., Fukuda, M., and Troxler, T., IPCC, Switzerland, 2.1–2.74, 2014.
Duxbury, J. M., Bouldin, D. R., Terry, R. E., and Tate, R. L.: Emis-sions of nitrous oxide from soils, Nature, 298, 462–464, 1982. Erickson, H., Keller, M., and Davidson, E. a.: Nitrogen Oxide
Fluxes and Nitrogen Cycling during Postagricultural Succession and Forest Fertilization in the Humid Tropics, Ecosystems, 4, 67–84, 2001.
Erickson, H., Davidson, E. A., Keller, M., and Url, S.: Former Land-Use and Tree Species Affect Nitrogen Oxide Emissions from a Tropical Dry Forest, Oecologia, 130, 297–308, 2002.
FAO: FAO’s Director-General on How to Feed the World in 2050, Popul. Dev. Rev., 35, 837–839, 2009.
FAO: Global forest resources assessment 2010: main report, Rome, Italy, 2010.
Farquharson, R. and Baldock, J.: Concepts in modelling N2O
emis-sions from land use, Plant Soil, 309, 147–167, 2008.
Firestone M. K. and Davidson, E. A.: Microbial basis of NO and N2O production and consumption in soil, Exchange of trace
gases between terrestrial ecosystems and the atmosphere, edited by: Andrea, M. O., Schimel, D. S., Exch. Trace Gases between Terr. Ecosyst. Atmos., Wiley, Toronto, 7–21, 1989.
Furukawa, Y., Inubushi, K., Ali, M., Itang, a. M., and Tsuruta, H.: Effect of changing groundwater levels caused by land-use changes on greenhouse gas fluxes from tropical peat lands, Nutr. Cycl. Agroecosyst., 71, 81–91, 2005.
Garcia-Montiel, D. C., Steudler, P. A., Piccolo, M. C., Melillo, J. M., Neill, C., and Cerri, C. C.: Controls on soil nitrogen oxy-gen emissions from forest and pastures in the Brazilian Amazon, Global Biogeochem. Cy., 15, 1021–1030, 2001.
Gibbs, H. K., Ruesch, a S., Achard, F., Clayton, M. K., Holmgren, P., Ramankutty, N., and Foley, J. a: Tropical forests were the pri-mary sources of new agricultural land in the 1980s and 1990s, Proc. Natl. Acad. Sci. USA, 107, 16732–16737, 2010.
Gurevitch, J. and Hedges, L. V: Statistical Issues in Ecological Meta-Analyses, Ecology, 80, 1142–1149, 1999.
2
Hadi, A., Inubushi, K., Furukawa, Y., Purnomo, E., Rasmadi, M., and Tsuruta, H.: Greenhouse gas emissions from tropical peat-lands of Kalimantan, Indonesia, Nutr. Cycl. Agroecosyst., 71, 73–80, 2005.
Harris, N. L., Brown, S., Hagen, S. C., Saatchi, S. S., Petrova, S., Salas, W., Hansen, M. C., Potapov, P. V., and Lotsch, a.: Base-line Map of Carbon Emissions from Deforestation in Tropical Regions, Science, 336, 1573–1576, 2012.
Hedges, L. V and Olkin, I.: Statistical methods for meta-analysis, Academic Press, Inc., London, UK, 1985.
Heinen, M.: Simplified denitrification models: Overview and prop-erties, Geoderma, 133, 444–463, 2006.
Hergoualc’h, K. and Verchot, L. V.: Greenhouse gas emission fac-tors for land use and land-use change in Southeast Asian peat-lands, Mitig. Adapt. Strateg. Glob. Change, 19, 789–807, 2014. Higgins, J. P. T. and Green, S.: Cochrane Handbook for Systematic
Reviews of Interventions Version 5.1.0 [updated March 2011], available from www.cochrane-handbook.org (last access: 8 Au-gust 2015), 2011.
Hillel, D.: Fundamentals of soil physics., Academic Press, Inc. (London) Ltd., 1980.
Hosonuma, N., Herold, M., De Sy, V., De Fries, R. S., Brock-haus, M., Verchot, L., Angelsen, A., and Romijn, E.: An assess-ment of deforestation and forest degradation drivers in develop-ing countries, Environ. Res. Lett., 7, 044009, doi:10.1088/1748-9326/7/4/044009, 2012.
Houghton, R. A.: Revised estimates of the annual net flux of car-bon to the atmosphere from changes in land use and land man-agement 1850–2000, Tellus, Ser. B Chem. Phys. Meteorol., 55, 378–390, 2003.
Houghton, R. A.: Aboveground forest biomass and the global car-bon balance, Glob. Chang. Biol., 11, 945–958, 2005.
Huwaldt, J.: Plot Digitizer website, http://plotdigitizer.sourceforge. net/ (last access: 12 April 2012), 2011.
IPCC: 2006 IPCC Guidelines for National Greenhouse Gas Inven-tories, Prepared by the National Greenhouse Gas Inventories Pro-gramme, edited by: Eggleston, H. S., Buendia, L., Miwa, K., Ngara, T., and Tanabe, K., Published, IGES, Japan, 2006. Ishizuka, S., Iswandi, A., Nakajima, Y., Yonemura, S., Sudo, S.,
Tsuruta, H., Murdiyarso, D.: The variation of greenhouse gas emissions from soils of various land-use/cover types in Jambi province, Indonesia. Nutrient Cycling in Agroecosystems, 71, 17-32, 2005.
Jauhiainen, J., Silvennoinen, H., Hämäläinen, R., Kusin, K., Limin, S., Raison, R. J., and Vasander, H.: Nitrous oxide fluxes from tropical peat with different disturbance history and manage-ment, Biogeosciences, 9, 1337–1350, doi:10.5194/bg-9-1337-2012, 2012.
Keller, M. and Reiners, W. A.: Soil-atmosphere exchange of nitrous oxide, nitric oxide, and methane under secondary succession of pasture to forest in the Atlantic lowlands of Costa Rica, Global Biogeochem. Cy., 8, 399–409, 1994.
Keller, M., Veldkamp, E., Weitz, A. M., and Reiners, W. A.: Effect of pasture age on soil trace-gas emissions from a deforested area of Costa Rica, Nature, 365, 244–246, 1993.
Keller, M., Varner, R., Dias, J. D., Silva, H., Crill, P., de Oliveira Jr, R. C., and Asner, G. P.: Soil–atmosphere exchange of nitrous oxide, nitric oxide, methane, and carbon dioxide in logged and
undisturbed forest in the Tapajós National Forest, Brazil, Earth Interact., 9, 1–28, 2005.
Kim, D. G., Giltrap, D., and Hernandez-Ramirez, G.: Background nitrous oxide emissions in agricultural and natural lands: A meta-analysis, Plant Soil, 373, 17–30, 2013a.
Kim, D.-G., Giltrap, D., and Hernandez-Ramirez, G.: Erratum to: Background nitrous oxide emissions in agricultural and natural lands: a meta-analysis, Plant Soil, 373, 1007–1008, 2013b. Koricheva, J., Gurevitch, J., and Mengersen, K.: Handbook of
meta-analysis in ecology and evolution, Princeton University Press, Princeton, USA, 2013.
Lambin, E. F., Turner, B. L., Geist, H. J., Agbola, S. B., Angelsen, A., Bruce, J. W., Coomes, O. T., Dirzo, R., Fischer, G., Folke, C., George, P. S., Homewood, K., Imbernon, J., Leemans, R., Li, X., Moran, E. F., Mortimore, M., Ramakrishnan, P. S., Richards, J. F., Skånes, H., Steffen, W., Stone, G. D., Svedin, U., Veldkamp, T. a., Vogel, C., and Xu, J.: The causes of land-use and land-cover change: Moving beyond the myths, Glob. Environ. Chang., 11, 261–269, 2001.
Lambin, E. F., Geist, H. J., and Lepers, E.: Dynamics of Land-Use and Land-Cover Change in Tropical Regions, Annu. Rev. Envi-ron. Resour., 28, 205–241, 2003.
Lin, S., Iqbal, J., Hu, R., and Feng, M.: N2O emissions from
differ-ent land uses in mid-subtropical China, Agric. Ecosyst. Environ., 136, 40–48, 2010.
Linn, D. M. and Doran, J. W.: Effect of Water-Filled Pore Space on Carbon Dioxide and Nitrous Oxide Production in Tilled and Nontilled Soils, Soil Sci. Soc. Am. J., 48, 1267, doi:10.2136/sssaj1984.03615995004800060013x, 1984. Ludwig, J., Meixner, F. X., Vogel, B., and Forstner, J.: Soil-air
ex-change of nitric oxide: An overview of processes, environmen-tal factors, and modeling studies, Biogeochemistry, 52, 225–257, 2001.
Luizao, F., Luizao, R., Matson, P., Livingston, G. and Vitousek, P.: Nitrous oxide flux following tropical land clearing, Global Bio-geochem. Cy., 3, 281–285, 1989.
Matson, P. A., Vitousek, P. M., Livingston, G. P., and Swanberg, N. A.: Sources of variation in nitrous oxide flux from Amazonian ecosystems, J. Geophys. Res., 95, 16789–16798, 1990. Matson, P. A., Billow, C., Hall, S., and Zachariassen, J.:
Fertiliza-tion practices and soil variaFertiliza-tions control nitrogen oxide emis-sions from tropical sugar cane, J. Geophys. Res., 101, 18533, doi:10.1029/96JD01536, 1996.
Meixner, F. X., Fickinger, T., Marufu, L., Ser, D., Nathaus, F. J., Makina, E., Mukurumbira, L., and Andreae, M. O.: Preliminary results on nitric oxide emission from a southern African savanna ecosystem, Nutr. Cycl. Agroecosyst., 48, 123–138, 1997. Melillo, J. M., Steudler, P. A., Feigl, B. J., Neill, C., Garcia, D.,
Piccolo, M. C., Cerri, C. C., and Tian, H.: Nitrous oxide emis-sions from forests and pastures of various ages in the Brazilian Amazon, J. Geophys. Res., 106, 34179–34188, 2001.
in complex mosaic landscapes under REDD+, Geogr. Tidsskr. J. Geogr., 112, 63–76, 2012.
Myhre, G., Shindell, D., Bréon, F.-M., Collins, W., Fuglestvedt, J., Huang, J., Koch, D., Lamarque, J.-F., Lee, D., Mendoza, B., Nakajima, T., Robock, A., Stephens, G., Takemura, T., and Zhang, H.: Anthropogenic and Natural Radiative Forcing, in: Climate Change 2013 The Physical Science Basis, edited by: Stocker, T. F., Qin, D., Plattner, G.-K., Tignor, M., Allen, S. K., Boschung, J., Nauels, A., Xia, Y., Bex, V., Midgley, P. M., Work-ing Group I Contributionto the Fifth Assessment Report of the Intergovernmental Panel on Climate Change, Cambridge Uni-versity Press, Cambridge, United Kingdom and New York, NY, USA, 2013.
Neill, C., Piccolo, M. C., Steudler, P. a., Melillo, J. M., Feigl, B. J., and Cerri, C. C.: Nitrogen dynamics in soils of forests and active pastures in the western Brazilian Amazon Basin, Soil Biol. Biochem., 27, 1167–1175, 1995.
Neill, C., Steudler, P. A., Garcia-Montiel, D. C., Melillo, J. M., Feigl, B. J., Piccolo, M. C., and Cerri, C. C.: Rates and controls of nitrous oxide and nitric oxide emissions following conversion of forest to pasture in Rondônia, Nutr. Cycl. Agroecosyst., 71, 1–15, 2005.
Parton, W. J., Holland, E. A., Del Grosso, S. J., Hartman, M. D., Martin, R. E., Mosier, A. R., Ojima, D. S., and Schimel, D. S.: Generalized model for NOx and N2O emissions from soils, J.
Geophys. Res., 106, 17403, doi:10.1029/2001JD900101, 2001. Pérez, T., Romero, J., and Sanhueza, E.: Effect of conversion of
natural grassland to cropland on nitric oxide emissions from Venezuelan savanna soils. A four-year monitoring study, Nutr. Cycl. Agroecosys., 77, 101–113, 2007.
Phalan, B., Bertzky, M., Butchart, S. H. M., Donald, P. F., Scharle-mann, J. P. W., Stattersfield, A. J., and Balmford, A.: Crop Ex-pansion and Conservation Priorities in Tropical Countries, PLoS One, 8, e51759, doi:10.1371/journal.pone.0051759, 2013. Potter, C. S., Matson, P. A., Vitousek, P. M., and Davidson, E.
a.: Process modeling of controls on nitrogen trace gas emis-sions from soils worldwide, J. Geophys. Res., 101, 1361, doi:10.1029/95JD02028, 1996.
Purbopuspito, J., Veldkamp, E., Brumme, R., and Murdiyarso, D.: Trace gas fluxes and nitrogen cycling along an elevation se-quence of tropical montane forests in Central Sulawesi, Indone-sia, Global Biogeochem. Cy., 20, 1–11, 2006.
Skiba, U. and Smith, K. a.: The control of nitrous oxide emissions from agricultural and natural soils, Chemosph.-Glob. Chang. Sci., 2, 379–386, 2000.
Skiba, U., Jones, S., Dragosits, U., Drewer, J., Fowler, D., Rees, R. M., Pappa, V. A., Cardenas, L., Chadwick, D., Yamulki, S., and Manning, A. J.: UK emissions of the greenhouse gas nitrous ox-ide, Philos. Trans. R. Soc. Lond. B. Biol. Sci., 367, 1175–1185, 2012.
Stehfest, E. and Bouwman, L.: N2O and NO emission from agri-cultural fields and soils under natural vegetation: Summarizing available measurement data and modeling of global annual emis-sions, Nutr. Cycl. Agroecosyst., 74, 207–228, 2006.
Stern, N.: The economics of climate change, Am. Econ. Rev., 98, 1–37, 2008.
Steudler, P., Melillo, J. M., Bowden, R., and Castro, M.: The effects of natural and human disturbances on soil nitrogen dynamics and
trace gas fluxes in a Puerto Rican wet forest, Biotropica, 23, 356– 363, 1991.
Streck, C. and Parker, C.: Financing REDD, in Analysing REDD, edited by: Angelsen, A., Brockhaus, M., and Verchot, L. V., Cen-ter for InCen-ternational Forestry Research, Bogor, Indonesia, 111– 127, 2012.
Takakai, F., Morishita, T., Hashidoko, Y., Darung, U., Kuramochi, K., Dohong, S., Limin, S. H., and Hatano, R.: Effects of agri-cultural land-use change and forest fire on N2O emission from
tropical peatlands, Central Kalimantan, Indonesia, Soil Sci. Plant Nutr., 52, 662–674, 2006.
Veldkamp, E. and Keller, M.: Nitrogen oxide emissions from a banana plantation in the humid tropics, J. Geophys. Res., 102, 15889–15898, 1997.
Veldkamp, E., Keller, M., and Nuñez, M.: Effect of pasture man-agement on N2O and NO emissions from soils in the humid
tropics of Costa Rica, Global Biogeochem. Cy., 12, 71–79, doi:10.1029/97GB02730, 1998.
Veldkamp, E., Davidson, E., Erickson, H., Keller, M., and Weitz, A.: Soil nitrogen cycling and nitrogen oxide emissions along a pasture chronosequence in the humid tropics of Costa Rica, Soil Biol. Biochem., 31, 387–394, 1999.
Veldkamp, E., Purbopuspito, J., Corre, M. D., Brumme, R., and Murdiyarso, D.: Land use change effects on trace gas fluxes in the forest margins of Central Sulawesi, Indonesia, J. Geophys. Res., 113, G02003, doi:10.1029/2007JG000522, 2008.
Verchot, L. V, Davidson, E. A., Cattânio, J. H., Ackerman, I. L., Er-ickson, H. E., and Keller, M.: Land use change and biogeochem-ical controls of nitrogen oxide emissions from soils in eastern Amazonia, Global Biogeochem. Cy., 13, 31–46, 1999.
Verchot, L. V., Hutabarat, L., Hairiah, K., and van Noordwijk, M.: Nitrogen availability and soil N2O emissions following
con-version of forests to coffee in southern Sumatra, Global Bio-geochem. Cy., 20, GB4008, doi:10.1029/2005GB002469, 2006. Wang, M. C. and Bushman, B. J.: Using the normal quantile plot to explore meta-analytic data sets., Psychol. Methods, 3, 46–54, 1998.
Werner, C., Zheng, X., Tang, J., Xie, B., Liu, C., Kiese, R., and Butterbachy-Bahl, K.: N2O, CH4and CO2emissions from
sea-sonal tropical rainforests and a rubber plantation in Southwest China, Plant Soil, 289, 335–353, 2006.
Werner, C., Butterbach-Bahl, K., Haas, E., Hickler, T., and Kiese, R.: A global inventory of N2O emissions from tropical
rainfor-est soils using a detailed biogechemical model, Global Biochem. Cy., 21, GB3010, doi:10.1029/2006GB002909, 2007.
Wick, B., Veldkamp, E., de Mello, W. Z., Keller, M., and Crill, P.: Nitrous oxide fluxes and nitrogen cycling along a pasture chronosequence in Central Amazonia, Brazil, Biogeosciences, 2, 175–187, doi:10.5194/bgd-2-499-2005, 2005.
Xiong, Z., Xie, Y., Xing, G., Zhu, Z., and Butenhoff, C.: Measure-ments of nitrous oxide emissions from vegetable production in China, Atmos. Environ., 40, 2225–2234, 2006.
Yashiro, Y., Kadir, W. R., Okuda, T., and Koizumi, H.: The effects of logging on soil greenhouse gas (CO2, CH4, N2O) flux in a
tropical rain forest, Peninsular Malaysia, Agric. For. Meteorol., 148, 799–806, 2008.