Boiling in capillary tubes
G. Hetsroni
*, M. Gurevich, A. Mosyak, E. Pogrebnyak, R. Rozenblit, L.P. Yarin
Faculty of Mechanical Engineering, Technion––Israel Institute of Technology, Haifa 32000, IsraelReceived 26 February 2003; received in revised form 11 June 2003
Abstract
We present here a theoretical and experimental study of two-phase flow in a heated capillary tube. The flow parameters of a single-phase liquid, two-phase liquid-vapor, and single-phase vapor were analyzed in the frame of a one-dimensional model. The pressure, temperature and vapor quality measurements were carried out in a pipe of 1.0 mm inner diameter at various values of heat fluxes and mass flow rates and compared with theoretical predictions. The evolution of the bubble volume was studied both theoretically and experimentally.
Using infrared technique, the temperature distribution on the heated tube surface was studied for various flow regimes.
2003 Elsevier Ltd. All rights reserved.
Keywords:Capillary tube; Boiling; Heat transfer; Two-phase flow regimes
1. Introduction
The aim of the present work is to study the effect of heat flux and mass flow rate on the structure and the thermo-hydrodynamic characteristics of flow in a heated capillary tube. This problem is important in the context of improvement of heat transfer in cooling systems of elec-tronic devices with high power density. Various aspects of two-phase flow and change-of-phase heat transfer in microchannels have been investigated recently including two-phase flow patterns (Damianides and Westwater, 1988; Fukano and Kariyasaki, 1993; Zhao and Bi, 2001) and two-phase heat transfer (Hetsroni et al., 2001; Zhang et al., 2002; Kandlikar, 2002; Jacobi and Thome, 2002, Qu and Mudawar, 2003a,b).
www.elsevier.com/locate/ijmulflow
*
Corresponding author. Tel.: +972-48-292058; fax: +972-48-238101. E-mail address:[email protected](G. Hetsroni).
The flow, induced by the suitably timed growth and collapse of one or several bubbles in a finite tube joining two liquid reservoirs, is simulated by using a simple quasi-one-dimensional model by Yuan and Prosperetti (1999). The fluid mechanical aspects of the axisymmetric growth and col-lapse of a bubble in a narrow tube, filled with a viscous liquid were studied by Ory et al. (2000). The model simulates the effect of intense, localized, brief heating of the liquid, which leads to the nucleation and growth of a bubble.
In the present study experimental and theoretical investigations of flow in a capillary tube were carried out to clarify the influence of the physical properties of the coolant, wall heat flux and mass flow rate on the thermo-hydrodynamic characteristics of the flow.
2. Experimental
2.1. Experimental facility
The experimental apparatus is shown in Fig. 1. A pump (3) was used to force the liquid from the entrance container (2) to a calorimeter (10) through a capillary tube with a constant flow rate. De-ionized water was used for the liquid phase to allow comparisons of the single-phase flow pressure drop data with those available in the literature. The setup has two versions of the ex-perimental test section: The first version was used for the flow visualization runs and the second one for wall temperature measurements, respectively. The inlet and outlet of the test section were connected to the loop by a T-junction (6). The pressure in the T-junction was measured by pressure sensors (5) with sensitivity of 3.3 mV/kPa and response time of 1.0 ms. The entrance and the exit pressures were measured with an accuracy of ±1%. These sensors were used to measure the pressure drop between the capillary tube inlet and outlet, which included a minor loss due to a
P
T
(a)
A
5 5
6 7
11
8 6
1 2 3
4 9 4
10 T P
IR
(b)
+
-12
[image:2.544.73.474.445.618.2]13
sudden change of cross-section. The temperature of the working fluid was measured by 0.3 mm type-T thermocouples (4).
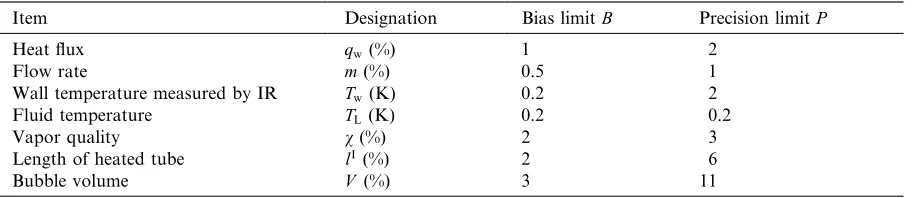
The flow visualization test section (Fig. 1a) was a transparent tube (7) made of Pyrex glass with an inner diameter of 1.0 mm and a length of 250 mm. The flow visualization was carried out by a high-speed video camera (11) with a recording rate up to 10,000 fps. The illumination was pro-vided by a set of halogen lamps. Pictures were taken with a special background, so that the single-phase water flow and two-single-phase steam-water flow had white and black outlines, respectively. The flow rate of the working fluid was measured by a weighting method (1). The data were collected by 12-bit 1 MHz acquisition system with an accuracy of ±0.025% FS. The uncertainty of the mea-surements is given in Table 1, where the bias limit is an estimate of the magnitude of the constant error. The precision limit is an estimate of the lack of repeatability caused by random errors.
2.2. Data reduction
The parameters used in the data reduction and analysis are summarized below:
• For each set of steady-state experimental conditions, the heat losses due to convection and ra-diation were taken into account. The heat losses were calculated using wall temperature mea-sured by an IR radiometer. The heat transferred to the fluid was calculated as Joule heating less the heat losses.
• The water velocity was calculated from the volumetric flow rate, fluid density, and the cross-section of the tube.
• Mass vapor quality at the outlet was calculated from the change in the enthalpy.
• The heating length was obtained from the wall temperature distribution along the flow direc-tion. It is the length from the entrance of the tube to the point at which the temperature on the heated wall reaches the maximum.
• The vapor volume was calculated from the images taken by high-speed video using some special software.
[image:3.544.45.502.557.656.2]The section for flow visualization was replaced by a stainless steel tube (12) of an inner diameter 1.0 mm, outer diameter 1.5 mm, and length of 250 mm in the experiments on wall temperature measurements (Fig. 1b). The stainless steel tube was directly heated by supplying DC power. The measurements of the temperature on the outer heated wall were recorded by an IR radiometer
Table 1
Uncertainty of the measurements
Item Designation Bias limitB Precision limitP
Heat flux qw(%) 1 2
Flow rate m(%) 0.5 1
Wall temperature measured by IR Tw(K) 0.2 2
Fluid temperature TL(K) 0.2 0.2
Vapor quality v(%) 2 3
Length of heated tube lI(%) 2 6
(13). The IR radiometer had a typical resolution of 256 pixels per line, frequency response 25 fps, and sensitivity 0.1 K. The temperature of the inner surface was calculated from the power gen-eration per unit volume of the electrically heated tube.
3. Bubble evolution
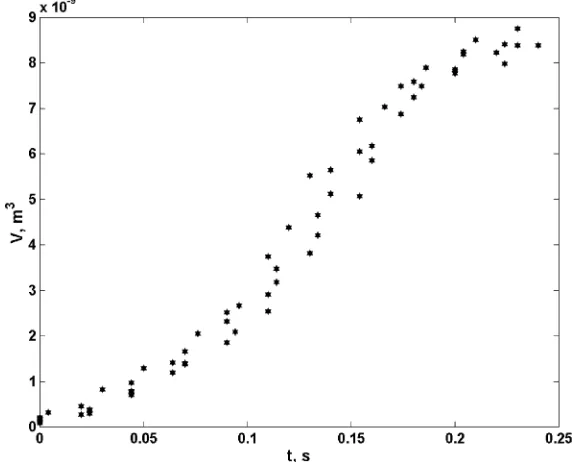
The process of a bubble growth was studied with heat flux on the wall ofqw¼5500 W/m2 and
mean flow velocity of 0.016 m/s. The experimental data on the temporal dependence of the bubble volume are presented in Fig. 2. This figure shows that the bubble volume, VðtÞ, is a monotonic increasing function with variable curvature. Within the domain of relatively small time interval,t, the derivative dV=dtincreases, whereas at largeta decrease of dV=dtis observed. The character of the dependence VðtÞ for the different stages of the process reflects the characteristics of bubble expansion in a restricted space, in particular, bubble/wall interaction.
[image:4.544.130.416.407.638.2]The process of bubble growth in a heated capillary tube can be presented schematically as follows. During the initial stage of the process, when the bubble begins growing from micronu-cleus, its evolution proceeds under conditions similar to conditions for bubble growth in an in-finite medium. The next stage of the process is characterized by a radical change of the bubble shape and its transformation into a long quasi-cylindrical bubble. The diameter of the long bubble is close to the tube diameter, so that the bubble lateral surface contacts the thin liquid film formed on the wall. The subsequent growth of the long bubble occurs by liquid evaporation at the surface of the liquid film. The contribution of vapor mass fluxes from the liquid film and the ends of the
bubble, to the total mass flux is different for different time intervals. Atlb=d610 (lbis the bubble
length, d is the tube diameter) the liquid film fully surrounds the bubble lateral surface. In this case the mass flux from the liquid film plays a dominant role. In contrast, for very long bubbles,
lb=d>dqLuqL;G=dqw, the evaporation at the ends of the bubble is significant (dis the thickness of
the liquid film,u is the liquid velocity in the film,qLis the density of the liquid,qL;Gis the latent
heat of vaporization, qw is the wall heat flux). It is due to the wall drying out at large lb and
thinning of the liquid film. At the point where the liquid film completely disappears the heat transfer coefficient sharply decreases.
This paper focuses on the two-phase flow model in a capillary tube for low and moderate values of heat flux q¼51035 104 W/m2. Several simplifying assumptions are adopted in the
model:
• The two-phase flow is steady;
• The vapor quality is equal to the thermodynamic equilibrium quality;
• Pressure is uniform across the capillary tube area;
• There is no coalescence of bubbles.
It should be noted that flow instability was not incorporated into the present flow model. This and other characteristics of flow boiling in a capillary tube stress the need to develop new tools to predict heat transfer. However, before such tools can be developed, it is prudent to assess the feasibility of a simple model in predicting pressure drop and heat transfer results.
At small values of the liquid superheating, when the rate of bubble growth is insignificant, it is possible to neglect the hydrodynamic effects. Then the problem reduces to a purely thermal one:
oTi
ot ¼air
2T
i ð1Þ
dR
dt ¼ j
qi ð2Þ
where subscriptsi¼G, L correspond to the vapor or liquid, respectively,T is the temperature,qis the density, ais the thermal diffusivity,
j¼ kL
oTL
og
kG
oTG
og
qL;1G
is the mass flux at the interface,kis the thermal conductivity, R is the characteristic bubble size (R is the bubble radius of a spherical bubble or the half length of a long bubble),g¼r org¼x
for the spherical or long bubble;r and xare coordinates in spherical and rectangular coordinate systems.
In a heated capillary tube the bubble growth proceeds under conditions of continuous pressure variation. The pressure drop due to the hydraulic resistance of the capillary tube is
DP ¼nqu
2
2
L
d ð3Þ
The approximation DP=P 1 is convenient for the conditions of the present experiment. Bearing in mind that under conditions of thermodynamic equilibrium the interface temperatureTs
changes weakly with pressure (Reid et al., 1987) it is possible to assumeTs¼const. Then Eq. (1)
has the following self-similar solution:
DT
DTL
¼fðuÞ ð4Þ
where DT ¼T TL, DTL¼TsTL, TL is the temperature of the liquid far from the bubble,
u¼g= ffiffiffiffiffiffiffiaLt
p
, and the functionfðuÞ is determined by the following equations:
d2f
du2þ
u
2 df
du¼0 ð5Þ
for the plane problem, and
d2f
du2þ
2 u þu 2 df
du¼0 ð6Þ
for the spherical problem.
The boundary conditions for Eqs. (5), (6) are
u¼0; f0¼0
u¼uR f ¼1
u! 1 f !0
ð7Þ
whereuR ¼R= ffiffiffiffiffiffiffiaLt
p
, f0¼df=du, ais the thermal diffusivity, t is the time.
Assuming that the temperature distribution inside the bubble is uniform, we find the mass flux on the interface
j¼ kL
qL;G ffiffiffiffiffiaL
p DTL
df
du
u¼uR
1
t1=2 ð8Þ
Integration of Eq. (2) (with relation (8)) leads to the following expression for the bubble radius:
R ¼
2kL
qLqL;G ffiffiffiffiffiaL
p df
du
u¼uR
DTLt1=2 ð9Þ
Note, that Eq. (9) is known as the Fritz–Ende formula (Nakoryakov et al., 1993)
R R0
¼1þ 2ffiffiffi p p
ffiffiffiffiffiffiffi aLt
p
R0
Ja ð10Þ
whereJa¼ ðcp;LDTL=qL;GÞðqL=qGÞ is the Jakob number, cp;L is the specific heat.
In the case of the bubble growth from a micronucleus (R0¼0), we obtain
R ¼2
ffiffiffi
3
p ffiffiffiffiffia2
p r
Jat1=2 ð11Þ
Here the factorpffiffiffi3 corresponds to the spherical problem.
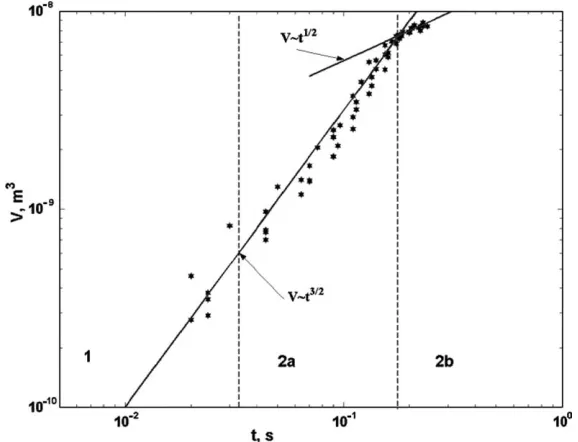
V t3=2
ð12Þ
for the spherical problem and
V t1=2 ð13Þ
for the long bubble.
Fig. 3 shows the change of the bubble volumeV vs timet. One can see that the dependence of the bubble volume on the time agrees fairly well with the law V t3=2 for the spherical bubble
(region 1 in Fig. 3) and for the quasi-cylindrical bubble (region 2a). For the very long bubble (region 2b) the lawV t1=2 is in effect.
4. Characteristic length
The different regimes of flow in a heated capillary tube can be characterized by hydrodynamic, thermal and geometric parameters. The flow with liquid phase (the characteristic length lI) and
liquid–vapor phase (the characteristic length lII) takes place in a short capillary tube. The flow
regimes with single liquid phase, lI, liquid–vapor phase,lII, and single vapor phase (LlIlII)
occur in a long capillary tube. The method of calculation of the characteristic length is given by Peles et al. (2001).
For a long mini-tube the characteristic lengthsllI andllII are expressed as
llI ¼Ts1
#L
[image:7.544.125.414.90.311.2]ð14Þ
llII
¼llIþqq~L
#L
ð15Þ
The following correlation for the length of the heating zone and the vapor quality at the outlet of a short capillary tube are
llI ¼Ts1
#L
ð16Þ
v¼#L ðTs1Þ
~
q
qL;G ð17Þ
where llI ¼lI=L, llII ¼lII=L, T
s¼Ts=T0, #L ¼qL=q0u0cp;LT0, qq~L¼#LðllIIllIÞ, ~qqL;G¼qL;G=cp;LT0
is the latent heat, q is the heat generated per unit volume, Ts is the saturation temperature;
parameters at the inlet:q0 is the liquid density,u0 the liquid velocity, cp;L the liquid specific heat
at constant pressure and T0 is the liquid temperature.
The dependence of the vapor quality,v, on#L=qL;Gin a short capillary tube is shown in Fig. 4.
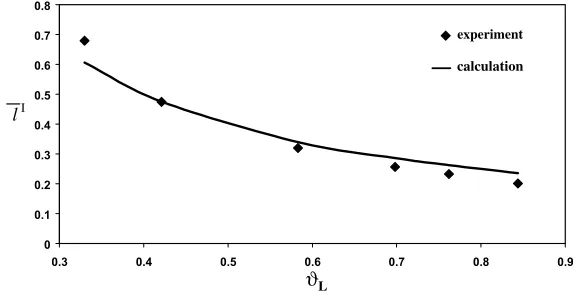
The dependence of ‘‘I on #
L is shown in Fig. 5. In this figure one can see that the length of the
[image:8.544.132.416.390.640.2]heating zone decreases with an increase in heat flux and with a decrease in fluid velocity. Figs. 4 and 5 show that experimental points group closely to a single curves that correspond to Eqs. (16) and (17), respectively.
5. Two-phase pressure drops
The two-phase pressure drop DPL!G in turn may be considered as the sum of three parts: the
static pressure drop DPstat, the momentum pressure drop DPmom and the frictional pressure drop
DPfrict. For a horizontal tube, there is no change in static head so DPstat¼0. The momentum
pressure drop (see e.g. Ould Duli et al., 2002) reflects the change in kinetic energy of the flow:
DPmom ¼mm_2total
ð1vÞ2 qLð1eÞ "
þ v
2
qGe #
lII
ð1vÞ
2
qLð1eÞ "
þ v
2
qGe #
lI
!
ð18Þ
wheremm_total is the total mass velocity of liquid plus vapor. The void fraction e is calculated as:
e¼ v
qG ð1 "
þ0:12ð1vÞÞ v
qG
þ1v
qL
þ1:18ð1vÞ½grðqLqGÞ
0:25
_
m m2
totalq0L:5
#1
ð19Þ
The experimental two-phase frictional pressure drop is obtainable by subtracting both the calculated momentum pressure drop and the static pressure drop from the measured total pres-sure drop.
Ould Duli et al. (2002) compared seven different two-phase frictional pressure drop correla-tions. They concluded that the method of M€uuller-Steinhagen and Heck (1986) gives the best predictions for water-vapor flow in tubes.
The two-phase frictional pressure gradient, according to this method, is estimated as:
dP
dx
frict
¼Gð1vÞ1=3þbv3 ð20Þ
where the factorGis
G¼aþ2ðbaÞv; ð21Þ
a¼ ðdP=dxÞL is the pressure gradient with all the flow being liquid and b¼ ðdP=dxÞG is the pressure gradient for all the flow being vapor.
0 0.1 0.2 0.3 0.4 0.5 0.6 0.7 0.8
0.3 0.4 0.5 0.6 0.7 0.8 0.9 ϑL
experiment
lI
[image:9.544.125.414.92.238.2]calculation
These values are determined as:
dP
dx
L
¼fL
2mm_2total
dqL ð22Þ
dP
dx
G
¼fG
2mm_2 total
dqG ð23Þ
where the friction factors are obtained as:
f ¼16
Re for laminar flow ðRe<2000Þ ð24Þ
and
f ¼0:079
Re0:25 for turbulent flow ð25Þ
Reynolds number is calculated as
Re¼mm_totald
li ð26Þ
The comparison of calculations of the pressure drop with experimental data is shown in Fig. 6. There is qualitative agreement between experimental data and calculation. The line AB corre-sponds to quality v¼1, the line AC corresponds to quality v¼0 and heat flux qw¼0, the line
AD corresponds tov¼0 at given values of heat flux.
6. Wall temperature
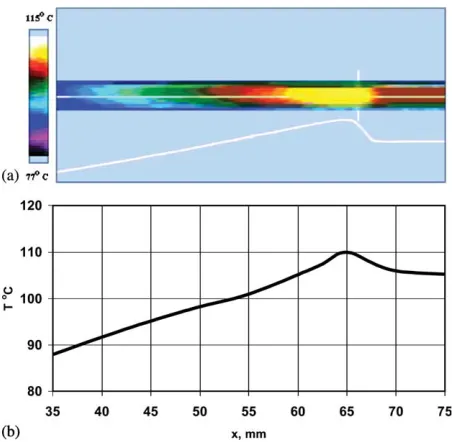
An infrared radiometer was used to study the wall temperature (Hetsroni et al., 1996). Fig. 7 shows the typical image of the temperature distribution on the heated wall. These images were used to determine the heating length, which was obtained from the wall temperature distribution
0 500 1000 1500 2000 2500 3000
0 20 40 60 80 100
u0,kg
ρ /m2s
∆
Pto
ta
l
,P
a
A B
C
D
Fig. 6. Two-phase pressure drop at different values of heat fluxes: Calculation: —M— q¼104 W/m2;
[image:10.544.160.391.93.236.2]along the flow direction. It is the length from the entrance of the tube to the point at which the temperature on the heated wall reaches the maximum. The IR image of the heated tube wall is shown in Fig. 7a. The white line represents qualitatively the temperature distribution along the flow direction. In Fig. 7b this distribution is presented quantitatively.
Fig. 7. IR image of the heated tube surface: (a) IR image and (b) the temperature distribution along the flow direction.
Fig. 8. The dimensionless wall temperature distribution along the outer wall of the tube
––qw¼1:8104 W/m2; ––qw¼2:3104 W/m2; M––qw¼3:2104 W/m2; ––qw¼3:9104 W/m2; O––qw¼4:2104 W/m2; [image:11.544.127.414.402.620.2]The dimensionless wall temperature distribution along the outer wall of the tube is shown in Fig. 8. In this figurexx¼x=L, Tw¼Tw=T0,Ts¼Ts=T0, wherexis the distance from the inlet in the
streamwise direction, Tw, Ts and T0 are wall temperature, saturation temperature and liquid
temperature at the inlet, respectively. In all cases the wall temperature increases sharply (practi-cally linearly) in the vicinity of capillary tube inlet and then decreases up to the saturation tem-perature. The temperature drop in this region is due to intensification of heat transfer at phase change. Far from the inlet, the wall temperature is constant, within the region of two-phase flow. An increase of heat flux on the wall is accompanied by displacement the maximum temperature towards the inlet. Calculations showed that the difference Dt between outer wall and inner wall temperatures of the tube is small. In the present experiments 0:14<Dt<0:35 C, the difference between the wall and water temperatures is about of 3–4 C within the heated region of the capillary tube.
7. Conclusions
We did a theoretical and experimental study on flow regimes in heated capillary tubes. In the frame of the one-dimensional model the length of single-phase liquid, two-phase liquid vapor, single-phase vapor regimes were analyzed. The theoretical predictions agree well with the ex-perimental data.
The characteristics of bubble growth along the capillary tube were measured. According to the model the time dependence of bubble volume is V t3=2 for spherical and long quasi-cylindrical
bubble. For the very long bubble this dependence is V t1=2. The experimental data agree with
the theory.
The theoretical prediction of the dependence of vapor quality on flow parameters and heat flux agrees quite well with experimental data.
Using the infrared technique the temperature distribution on the heated tube surface was studied at different flow regimes.
Acknowledgements
This research was supported by the Fund for Promotion of Research at the Technion. A. Mosyak and R. Rozenblit are supported by a grant from the Center for Absorption in Science of the Ministry of Immigrant Absorption and the Committee for Planning and Budgeting of the Council for Higher Education under the framework of the Kamea Program. E. Pogrebnyak and M. Gurevich are supported by the Center for Absorption in Science, Ministry of Immigrant Absorption State of Israel.
References
Fukano, T., Kariyasaki, A., 1993. Characteristics of gas-liquid two-phase flow in capillary. Nucl. Eng. Des. 141, 59–68. Hetsroni, G., Rozenblit, R., Yarin, L.P., 1996. A hot-foil infrared technique for studying the temperature field of a wall.
Meas. Sci. Technol. 7, 1418–1427.
Hetsroni, G., Mosyak, A., Segal, Z., 2001. Nonuniform temperature distribution in electronic devices cooled by flow in parallel micro-channels. IEEE Trans. Compon. Packag. Technol. 24, 16–23.
Kandlikar, G., 2002. Fundamental issues related to flow boiling in minichannels and micro-channels. Exp. Thermal Fluid Sci. 26, 389–407.
Jacobi, A.M., Thome, J.R., 2002. Heat transfer model for evaporation of elongated bubble in micro-channels. J. Heat Transfer 124, 1131–1136.
M€uuller-Steinhagen, H., Heck, K., 1986. A simple friction pressure drop correlation for two-phase flow in pipes. Chem. Eng. Process. 20, 297–308.
Nakoryakov, V.E., Pokusaev, B.G., Shreiber, I.R., 1993. Wave Propagation in Gas–Liquid Media. CRC Press Inc. Ory, E., Yuan, H., Prosperetti, A., Popinet, S., Zaleski, S., 2000. Growth and collapse of a vapor bubble in narrow
tube. Phys. Fluids 12, 1268–1277.
Ould Duli, M.B., Kattan, N., Thome, J.R., 2002. Prediction of two-phase pressure gradients of refrigerants in horizontal tubes. Int. J. Refrigerat. 25, 935–947.
Peles, Y.P., Yarin, L.P., Hetsroni, G., 2001. Steady and unsteady flow in a heated capillary. Int. J. Multiphase Flow 27, 577–598.
Qu, W., Mudawar, I., 2003a. Flow boiling heat transfer in two-phase micro-channel heat sinks––I. Experimental investigation and assessment of correlation methods. Int. J. Heat Mass Transfer 46, 2755–2771.
Qu, W., Mudawar, I., 2003b. Flow boiling heat transfer in two-phase micro-channel heat sinks––II. Annular two-phase flow model. Int. J. Heat Mass Transfer 46, 2773–2784.
Reid, R.C., Prausnitz, J.M., Poling, B.E., 1987. The Properties of Gases and Liquids. McGraw-Hill.
Yuan, H., Prosperetti, A., 1999. The pumping effect of growing and collapsing bubbles in a tube. J. Micromech. Microeng. 9, 402–413.
Zhang, L., Ko, J.M., Jiang, L., 2002. Measurements and modeling of two-phase flow in micro-channels with nearly constant heat flux boundary conditions. J. Microelectromech. Syst. 11, 12–19.