R E S E A R C H A R T I C L E
Open Access
Indole 3-acetic acid, indoxyl sulfate and
paracresyl-sulfate do not influence anemia
parameters in hemodialysis patients
Stanislas Bataille
1,2,3*, Marion Pelletier
1, Marion Sallée
1,4, Yvon Berland
1, Nathalie McKay
4, Ariane Duval
1,5,
Stéphanie Gentile
6, Yosra Mouelhi
6, Philippe Brunet
1,4and Stéphane Burtey
1,4Abstract
Background:The main reason for anemia in renal failure patients is the insufficient erythropoietin production by the kidneys. Beside erythropoietin deficiency, in vitro studies have incriminated uremic toxins in the
pathophysiology of anemia but clinical data are sparse. In order to assess if indole 3-acetic acid (IAA), indoxyl sulfate (IS), and paracresyl sulfate (PCS) -three protein bound uremic toxins- are clinically implicated in end-stage renal disease anemia we studied the correlation between IAA, IS and PCS plasmatic concentrations with hemoglobin and Erythropoietin Stimulating Agents (ESA) use in hemodialysis patients.
Methods:Between June and July 2014, we conducted an observational cross sectional study in two hemodialysis center. Three statistical approaches were conducted. First, we compared patients treated with ESA and those not treated. Second, we performed linear regression models between IAA, IS, and PCS plasma concentrations and hemoglobin, the ESA dose over hemoglobin ratio (ESA/Hemoglobin) or the ESA resistance index (ERI). Third, we used a polytomous logistic regression model to compare groups of patients with no/low/high ESA dose and low/high hemoglobin statuses.
Results:Overall, 240 patients were included in the study. Mean age ± SD was 67.6 ± 16.0 years, 55.4% were men and 42.5% had diabetes mellitus.
When compared with ESA treated patients, patients with no ESA had higher hemoglobin (mean 11.4 ± 1.1 versus 10.6 ± 1.2 g/dL;p<0.001), higher transferrin saturation (TSAT, 31.1 ± 16.3% versus 23.1 ± 11.5%;p< 0.001), less frequently an IV iron prescription (52.1 versus 65.7%,p= 0.04) and were more frequently treated with
hemodiafiltration (53.5 versus 36.7%). In univariate analysis, IAA, IS or PCS plasma concentrations did not differ between the two groups.
In the linear model, IAA plasma concentration was not associated with hemoglobin, but was negatively associated with ESA/Hb (p= 0.02;R= 0.18) and with the ERI (p= 0.03;R= 0.17). IS was associated with none of the three anemia parameters. PCS was positively associated with hemoglobin (p= 0.03;R= 0.14), but negatively with ESA/Hb (p= 0.03;R= 0.17) and the ERI (p= 0.02;R= 0.19). In multivariate analysis, the association of IAA concentration with ESA/Hb or ERI was not statistically significant, neither was the association of PCS with ESA/Hb or ERI.
Identically, in the subgroup of 76 patients with no inflammation (CRP <5 mg/L) and no iron deficiency (TSAT >20%) linear regression between IAA, IS or PCS and any anemia parameter did not reach significance.
(Continued on next page)
* Correspondence:stanislas.bataille@ap-hm.fr 1
Centre de néphrologie et transplantation rénale, Assistance Publique des Hôpitaux de Marseille, Aix-Marseille University, Marseille, France
2Phocean Nephrology Institute, Clinique Bouchard, 77 rue du Docteur Escat,
13006 Marseille, France
Full list of author information is available at the end of the article
(Continued from previous page)
In the third model, univariate analysis showed no intergroup significant differences for IAA and IS. Regarding PCS, theLow Hb/High ESAgroup had lower concentrations. However, when we compared PCS with the other significant characteristics of the five groups to theLow Hb/high ESA(our reference group), the polytomous logistic regression model didn’t show any significant difference for PCS.
Conclusions:In our study, using three different statistical models, we were unable to show any correlation between IAA, IS and PCS plasmatic concentrations and any anemia parameter in hemodialysis patients. Indolic uremic toxins and PCS have no or a very low effect on anemia parameters.
Keywords:Anemia, Chronic hemodialysis, Uremic toxins, Erythropoietin, Indoxyl sulfate, Indolic solutes
Background
Anemia is a major burden in renal failure. Within pa-tients with chronic kidney disease (CKD) stage 2 to 5, anemia occurs in approximately 20% of patients but as the kidney function decreases its prevalence rises to more than 40% in patients with CKD stage 5 [1]. In the Dialysis Outcomes and Practices Patterns Study (DOPPS), around 90% of hemodialysis patients were treated with erythropoiesis stimulating agents (ESA) in 2011 [https://www.dopps.org]. Clinical practice guide-lines for anemia in CKD have recently been published by the KDIGO [2].
The main reason for the defective erythropoiesis in renal failure patients is the relative deficiency in erythro-poietin (EPO) production by the peritubular cells of kidneys [3]. Nevertheless, beside EPO deficiency, other factors have been incriminated in anemia: deficiencies in iron, folates and cobalamin, chronic inflammation, un-controlled hyperparathyroidism, drugs including ACE inhibitors, or uremic toxins [2–4]. It is important to understand underlying mechanisms of anemia in CKD because the use of ESA might be at least ineffective in some patients or even deleterious in patients with high dosages [5].
The uremic toxins,i.e.harmful compounds accumulat-ing duraccumulat-ing renal failure, have been incriminated in the pathophysiology of anemia in CKD: sera from uremic patients inhibit hematopoietic progenitor’s growth. How-ever, clinical data in the field are sparse [6].
The role of indolic toxins or paracresyl-sulfate (PCS) in anemia has recently been proposed. Indoxyl sulfate (IS) and indole-3-acetic acid (IAA) are protein bound in-dolic uremic toxins derived from tryptophan. IS impairs erythropoiesis in an HIF dependent manner and sup-presses the EPO gene transcription during hypoxia [7]. This indolic toxin as well as IAA, activates the transcrip-tion factor aryl hydrocarbon receptor (AhR) [8]. During hypoxia, HIF2α forms a heterodimer with ARNT (AhR nuclear transcriptor) and translocates in the nucleus leading to EPO gene expression. IS increases the AhR/ ARNT complex in the nucleus and decreases the HIF2α/
ARNT complex [9]. Another mechanism leading to anemia is induction of eryptosis by IS [10]. This mech-anism has been proposed to favor anemia during renal failure.
Beside these in vitro results, the role of indolic toxins in anemia was also suggested by the use of AST120. AST120 is an oral sorbent of several com-pounds including indols. It decreases IS and PCS blood concentrations. Wu et al. showed in a recent clinical trial that AST120 decreased IS and PCS levels and improved hemoglobin level [11]. Nevertheless, to the best of our knowledge, no clinical study has linked anemia or ESA resistance to plasma concentra-tions of these specific uremic toxins.
In order to assess if IS, IAA and PCS are clinically im-plicated in end-stage renal disease anemia we studied the correlation between their plasmatic concentrations with hemoglobin and ESA use in hemodialysis patients.
Methods
Subjects and study design
Between June and July 2014, we conducted an observa-tional cross secobserva-tional study in two hemodialysis centers in Marseille, France to analyze the correlation between IS, IAA and PCS plasmatic concentrations and the anemia parameters. The two centers were the Nephrol-ogy Dialysis and Renal Transplant Center, Assistance Publique des Hôpitaux de Marseille, and the Phocean Institute of Nephrology.
Clinical, biological, and hemodialysis parameters
Clinical and biological following data were recorded from the patient’s medical files: age, gender, nephropa-thy, time on dialysis, history of diabetes mellitus, body weight, biological parameters including hemoglobin, transferrin saturation (TSAT), ferritin, as well as predia-lysis solute concentrations as urea, creatinine, and β 2-microglobulin, dialysis parameters and vascular access type, treatments including weekly ESA and IV iron doses. Most classical factors associated with ESA resist-ance as iron status, inflammation (c-reactive protein, CRP), or parathormone level (PTH) were included in the study [12].
Dialysis parameters (Kt/V and type of dialysis, i.e. hemodialysis or hemodiafiltration) were recorded at the mid-week session, and biological analyses were all per-formed at the beginning of hemodialysis session. Dialysis dose was estimated by a single-pool Kt/V (spKt/V), as recommended by Daugirdas et al. [13].
Because anemia in hemodialysis patients is influenced by ESA treatment and dose, two indexed dose-response markers were calculated. First, the ESA dose over hemoglobin ratio (ESA/Hb) was calculated as the weekly dose of darbepoietin (μg) divided by the hemoglobin plasma concentration (g/dL). Second, the ESA resistance index (ERI), a well-known ESA quantification marker associated with low survival in hemodialysis patients was defined as ESA/Hb divided by post-dialysis weight (kg) [12, 14–16]. In the two centers, IV iron (Ferric Hydrox-ide Saccharose 100 mg/5 mL, Mylan®, USA) prescription was based on TSAT and ferritin according to the physi-cian’s decision.
Uremic toxins dosage
Serum and plasma samples from patients were stored at
−80 °C until use and determination of uremic solute. IS, IAA, and paracresyl sulfate were measured in serum by high performance liquid chromatography as previously described [17]. β2-microglobulin was measured by immuno-enzymology.
Statistical analysis
Quantitative data were expressed as mean ± standard deviation (SD), whereas categorical data were expressed as frequency and percentage.
In order to compare characteristics in the two groups of patients: With ESA and Without ESA, univariate group comparisons were performed using Student T-test and chi-square tests.
To assess the correlation of toxins IS, IAA and PCS plasmatic concentrations with hemoglobin and ESA use in hemodialysis patients, two methods were used.
First, a multivariate Linear Regression model was used to estimate the relationship between Hb, ESA/Hb or ERI
levels and the other characteristics. Theβcoefficients and two tailed p-values were performed. The level of signifi-cance was set at a p-value <0.05. This model was also performed in the subgroup of patients with no inflamma-tion (CRP <5 mg/L) and no iron deficiency (TSAT >20%).
Then, to better analyze this correlation, we performed a Polytomous Logistic Regression model. We separated pa-tients in 6 subgroups according to the hemoglobin level and the ESA treatment. For each hemoglobin level (high hemoglobin >10 g/dL and low hemoglobin≤10 g/dL), we separated the ESA treatment into 3 categories: no treatment, low ESA dose <40 μg/week and high dose
≥40μg/week. The 40μg/week cutoff was chosen because it was the median dose within patients receiving ESA. In literature, hypo responsiveness to ESA is defined as a low Hb despite high ESA dose, thus, the Low Hb/High ESA group was taken as the reference group for the polyto-mous logistic regression model. We introduced into the multivariate model all the variables with ap-value <0.20 in the univariate model, then we performed a backward elimination procedure so as to conserve into the final model only the variables with a p-value < 0.05. The ad-justed odd ratios (OR) values with their 95% confidence interval were performed, and the level of significance was set at a p-value <0.05. Statistical analysis was performed using Statistical Package for Social Sciences (SPSS) soft-ware (version 20, SPSS, Inc., Chicago, IL, USA).
Results
Within the two hemodialysis centers, 240 patients were included in the study. Mean age ± SD was 67.6 ± 16.0 years, 55.4% were men and 42.5% had diabetes mellitus (Table 1). Mean time on dialysis was 82 ± 121 months.
The etiology of the primary cause of renal failure was diabetic nephropathy in 23.8% of patients, vascular nephropathy in 20.4%, chronic interstitial nephritis in 15.4%, non-diabetic glomerular disease in 12.9%, auto-somal dominant polycystic kidney disease in 4.6%, other in 6.7%, and unknown in 16.3%.
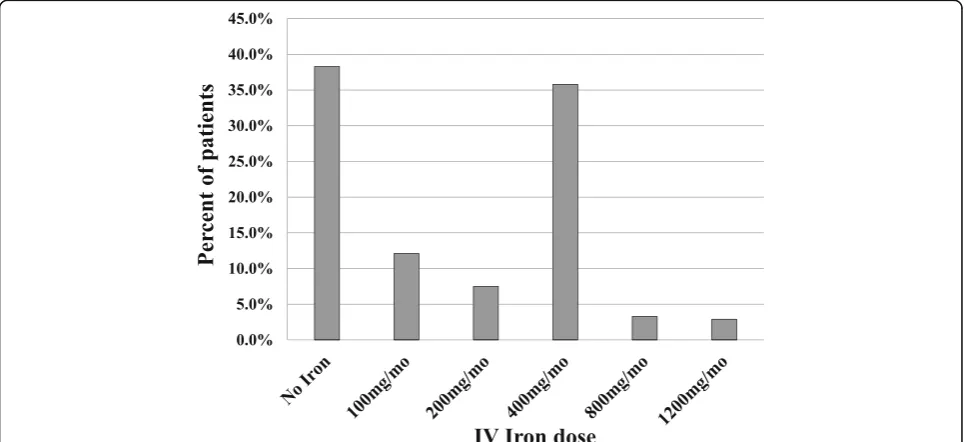
Regarding treatments, 29.5% (n = 71 patients) had no ESA and mean ESA dose in the treated group was 53.9 ± 50.0 μg per week (Table 1, Fig. 1); 61.7% of patients had IV iron supplementation and mean iron dose was of 232 ± 267 mg/month but most patients had either no iron, or 400 mg/month (i.e. 100 mg/week) (Table 1, Fig. 2).
When compared with ESA treated patients, patients with no ESA had higher hemoglobin (mean 11.4 ± 1.1 ver-sus 10.6 ± 1.2 g/dL; p-value <0.001), higher TSAT (31.1 ± 16.3% versus 23.1 ± 11.5%; p < 0.001), less iron prescription (52.1% versus 65.7%,p= 0.04) and they were
more frequently treated with hemodiafiltration (53.5% ver-sus 36.7%) (Table 1). In univariate analysis, IAA, IS or PCS plasma concentrations did not differ between the two groups, thus, no multivariate model is provided.
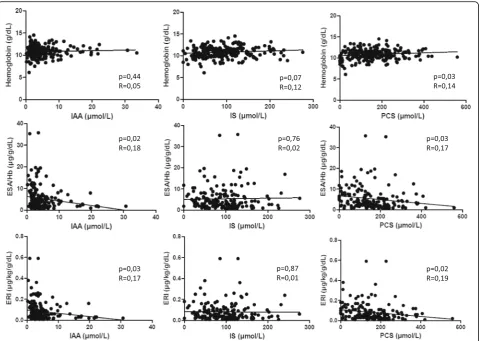
Linear regression of IS, IAA and PCS with hemoglobin, ESA over hemoglobin ratio and ERI are reported in Fig. 3. IAA plasma concentration was not associated with crude hemoglobin concentration, but was negatively associated with ESA/Hb (p = 0.02; R = 0.18) and with the ERI (p= 0.03;R= 0.17). IS was not associated with any of the three anemia parameters. PCS was positively associated with hemoglobin (p= 0.03;R= 0.14), and negatively with
Table 1General characteristics and factors associated with ESA prescription: univariate analysis (Student T-test test or chi square test as appropriate,n= 240 patients)
Total population (n= 240) Patients without ESA (n= 71) Patients with ESA (n= 169) p-value
Age (years) 67.6 ± 16.0 68.6 ± 14.8 67.3 ± 16.6 0.56
Male gender 55.4% 62.0% 52.7% 0.19
Time on dialysis (months) 82 ± 121 80 ± 89 83 ± 133 0.87
Diabetes mellitus 42.5% 43.7% 42.0% 0.81
Dry weight (kg) 69.6 ± 14.9 71.4 ± 15.6 68.9 ± 14.6 0.23
ADPKD 4.6% 4.2% 4.7% 1.00
White cell count (G/L) 7.01 ± 4.62 6.55 ± 2.05 7.21 ± 5.34 0.31
Lymphocytes (G/L) 1.28 ± 0.58 1.34 ± 0.62 1.25 ± 0.57 0.27
Hemoglobin (g/dL) 10.8 ± 1.2 11.4 ± 1.1 10.6 ± 1.2 <0.001
MCV (fl) 94 ± 8 93 ± 6 95 ± 8 0.33
Platelet count (G/L) 203 ± 79 187 ± 70 209 ± 82 0.06
TSAT (%) 25.5 ± 13.5 31.1 ± 16.3 23.1 ± 11.5 <0.001
Ferritin (ng/mL) 530 ± 520 577 ± 640 510 ± 461 0.36
Albumin (g/L) 37.7 ± 5.3 37.9 ± 4.8 37.6 ± 5.5 0.65
β2 microglobulin (mg/L) 26.6 ± 7.4 27.4 ± 7.9 26.4 ± 7.1 0.40
Parathormone (pg/mL) 256 ± 318 263 ± 313 252 ± 119 0.82
Predialysis creatinine (μmol/L) 732 ± 253 748 ± 273 725 ± 244 0.52
Predialysis urea (mmol/L) 20.7 ± 6.6 20.4 ± 5.9 20.8 ± 6.8 0.64
C-reactive protein (mg/L) 20.0 ± 43.5 16.6 ± 37.8 21.4 ± 45.7 0.44
IAA (μmol/L) 4.73 ± 4.79 4.79 ± 5.06 4.71 ± 4.69 0.91
IS (μmol/L) 93.3 ± 51.5 91.1 ± 53.0 94.2 ± 51.0 0.67
PCS(μmol/L) 158 ± 99 165 ± 99 154 ± 99 0.44
ESA dose (μg/w) - - 53.9 ± 50.0
-IV iron medication (%) 61.7% 52.1% 65.7% 0.04
Iron dose (mg/mo) 232 ± 267 173 ± 200 257 ± 288 0.03
Vascular access
Native AV fistula 63.3% 54.9% 66.9% 0.17
AV graft 16.7% 18.3% 16.0%
Catheter 20.0% 26.8% 17.2%
HDF (%) 41.7% 53.5% 36.7% 0.02
Kt/V 1.51 ± 0.31 1.51 ± 0.26 1.51 ± 0.32 0.98
ESA/Hb (p = 0.03; R = 0.17) and the ERI (p = 0.02; R= 0.19). In multivariate analysis, the association of IAA concentration with ESA/Hb and ERI was not statistically significant, neither was the association of PCS with ESA/ Hb and ERI. The only factors which were associated with ESA/Hb and ERI in the multivariate analyses were age, TSAT, ferritin, albumin and the iron dose (Table 2). Only 76 patients had no inflammation (CRP <5 mg/L) and no iron deficiency (TSAT >20%). In this subgroup of patients, univariate linear regression of IS, IAA and PCS with Hb,
ESA/Hb and ERI did not reach clinical significance (data not shown).
To accurately analyze the link between anemia and uremic toxins, patients were separated in 6 subgroups ac-cording to the hemoglobin level and the ESA treatment as described in the methods section. Frequencies and main biological parameters are reported in Table 3. In the univar-iate analysis, no intergroup significant difference was found for IAA and IS. Regarding PCS, the Low Hb/High ESA group had lower concentrations. However, when we Fig. 1ESA weekly dose in hemodialysis patients (n= 240 patients)
compared PCS with the other significant characteristics of the five groups to the lowLow Hb/High ESA(our reference group), the polytomous logistic regression model didn’t show any significant difference for PCS. In this latter, only ferritin levels, TSAT and albumin differed between groups as reported in Table 4.
Discussion
In this observational multicentric study including 240 hemodialysis patients, we report no correlation between
three protein bound uremic toxins -IAA, IS, and PCS-and anemia or ESA responsiveness. Three types of analyses were performed: first, we compared patients treated with ESA and those not treated. In this analysis, no correlation was found with the uremic toxins concen-trations in the univariate model. Second, IAA, IS and PCS concentrations were analyzed as continuous variables. In the multivariate model, no link was found between these concentrations and Hb, ESA/Hb or even ERI. Finally, patients were divided in subgroups Fig. 3Association between Indole-3-acetic acid, Indoxyl Sulfate, and Paracresyl sulfate plasmatic concentrations and anemia parameters in
hemodialysis patients (Linear regression,n= 240 patients). IAA: Indole-3-acetic acid; IS: Indoxyl Sulfate; PCS: Paracresyl sulfate; ESA/Hb: Erythropoietin Stimulating Agent weekly dose over hemoglobin ratio; ERI: Erythropoietin Stimulating Agent resistance index
Table 2Factors associated with ESA/Hb and ERI: multivariate analyses (Linear Regression Model,n= 240 patients)
ESA/Hb (μg/g/dL) ERI (μg/kg/g/dL ×10)
Coefficient (95% CI) p-value Coefficient (95% CI) p-value
Age (per 10 years) −0.47 [−0.66;−0.28] 0.02 −0.09 [−0.12;−0.06] 0.006
TSAT −0.10 [−0.13;−0.07] <0.001 −0.02 [−0.02;−0.01] <0.001
Ferritin (per 10 ng/mL) 0.02 [0.03; 0.01] 0.003 0.004 [0.003; 0.005] 0.002
Albumin −0.27 [−0.33;−0.21] <0.001 −0.05 [−0.06;−0.04] <0.001
Iron dose 0.003 [0.002; 0.004] 0.004 0.001 [0.001; 0.001] 0.007
according to their anemia/ESA status and there again, no link was found between the studied uremic toxins and anemia in this population.
Many in vitro data plead for an effect of uremic toxins on erythropoiesis. Since years, it is well known that there is a dose dependent inhibition cultured primary bone marrow cell growth when serum extracted from renal failure patients is added to the milieu [19, 20]. Neither urea, nor creatinine were incriminated because they do not show this effect [3]. Indolic solutes, especially IS have been incriminated in anemia. Recently, Chiang et al. have reported that IS reduces EPO production in hypoxic condition by suppressing HIF activation and subsequent EPO transcription [7]. These results were confirmed in an independent study [21]. Recently the effect of IS on HIF in response to ischemia was demon-strated [22] as well as the key role of AhR in IS effect on EPO transcription under hypoxic condition [9]. These non-human experiments were important in vitro argu-ments on the role of indolic uremic toxins on anemia.
To the best of our knowledge, only one clinical study has focused on the correlation between IS level and anemia until now. This study failed to identify a relation between
Table 3Factors associated with high or low hemoglobin level and ESA dose (ANOVA or Chi-square test,n= 240 patients)
Hb >10 g/dL Hb≤10 g/dL p-value
no ESA (n= 63)
ESA≤40μg/w (n= 75)
ESA >40μg/w (n= 41)
no ESA (n= 8)
ESA≤40μg/w (n= 25)
ESA >40μg/w (n= 28)
Age (years) 67.8 ± 15.3 67.1 ± 16.2 69.9 ± 15.4 74.5 ± 8.1 64.8 ± 17.6 65.9 ± 18.3 0.63
Gender (male) 61.9% 58.7% 41.5% 62.5% 64.0% 42.9% 0.19
Diabetes 44.4% 41.3% 43.9% 37.5% 48.0% 35.7% 0.96
Hemoglobin (g/dL) 11.6 ± 0.9 11.2 ± 0.8 11.1 ± 0.8 9.6 ± 0.6 9.5 ± 0.4 9.0 ± 0.9 <0.001
TSAT (%) 29.2 ± 13.5 23.5 ± 9.2 22.7 ± 11.1 45.8 ± 27.4 25.6 ± 9.8 20.1 ± 17.4 <0.001
Ferritin (ng/mL) 480 ± 330 426 ± 285 473 ± 304 1341 ± 1541 636 ± 314 677 ± 901 <0.001
Albumin (g/L) 38.4 ± 4.4 39.2 ± 4.1 37.5 ± 4.8 37.8 ± 4.6 33.0 ± 7.8 <0.001
β2 microglobulin (mg/L) 26.2 ± 7.0 25.7 ± 6.9 27.4 ± 8.2 34.1 ± 6.4 25.6 ± 6.2 27.4 ± 7.0 0.008
Parathormone (pg/mL) 268 ± 318 284 ± 315 195 ± 207 35.8 ± 9.8 264 ± 354 237 ± 438 0.83
Predialysis creatinine (μmol/L)
764 ± 282 769 ± 242 684 ± 250 224 ± 299 757 ± 220 638 ± 239 0.08
Predialysis urea (mmol/L) 20.8 ± 5.9 21.7 ± 6.7 20.0 ± 6.5 623 ± 153 21.0 ± 6.1 19.6 ± 8.3 0.39
C-reactive protein (mg/L) 12.2 ± 18.9 12.7 ± 28.4 26.0 ± 67.4 17.2 ± 5.5 23.1 ± 49.9 36.5 ± 37.1 0.02
IAA (μmol/L) 5.10 ± 5.28 5.73 ± 5.97 3.51 ± 3.50 51.9 ± 97.3 4.67 ± 3.05 3.78 ± 2.60 0.09
IS (μmol/L) 92.8 ± 54.7 97.9 ± 45.2 100.9 ± 49.9 2.29 ± 1.30 85.2 ± 55.5 82.3 ± 61.9 0.54
PCS(μmol/L) 169 ± 101 172 ± 94 150 ± 97 78.1 ± 37.6 175 ± 98 96 ± 99 0.01
Iron medication
IV iron medication 54.0% 68.0% 73.2% 135 ± 75 48.0% 64.3% 0.10
Iron dose (mg/mo) 175 ± 188 228 ± 245 351 ± 318 163 ± 292 124 ± 167 314 ± 374 0.002
HDF (%) 54.0% 30.7% 31.7% 50.0% 52.0% 46.4% 0.05
Kt/V 1.51 ± 0.26 1.50 ± 0.28 1.50 ± 0.42 1.46 ± 0.30 1.57 ± 0.26 1.51 ± 0.34 0.95
Results are provided as mean ± SD or percentages.HbHemoglobin,ESAErythropoietin stimulating agent,TSATtransferrin saturation,IAAindole-3-acetic acid, ISindoxylsulfate,PCSparacresyl-sulfate,HDFhemodiafiltration
Table 4Polytomous logistic regression: factors associated with hemoglobin level or ESA requirement (n= 240 patients)
Predictor variables OR (95% CI) p-value
Hb > 10 g/dL no ESA TSAT (%) 1.1 [1.06–1.2] <0.001
Ferritin (ng/mL) 0.9 [0.8–0.9] <0.001
Albumin (g/L) 1.1 [1.04–1.2] 0.01
Hb≤10 g/dL no ESA TSAT (%) 1.1 [1.05–1.2] <0.001
Ferritin (ng/mL) 0.9 [0.9–1.0] 0.06
Albumin (g/L) 1.0 [0.9–1.2] 0.5
Hb > 10 g/dL ESA low dose TSAT (%) 1.0 [1.01–1.1] 0.01
Ferritin (ng/mL) 0.9 [0.8–0.9] 0.006
Albumin (g/L) 1.2 [1.1–1.3] <0.001
Hb≤10 g/dL ESA low dose TSAT (%) 1.0 [1.01–1.1] 0.05
Ferritin (ng/mL) 0.9 [0.9–1.0] 0.2
Albumin (g/L) 1.1 [1.02–1.2] 0.01
Hb≤10 g/dL ESA high dose TSAT (%) 1.06 [0.9–1.1] 0.07
Ferritin (ng/mL) 0.9 [0.9–1.0] 0.05
Albumin (g/L) 1.1 [1.01–1.2] 0.02
IS concentration and anemia in patients on peritoneal dia-lysis except in the non anuric patient’s subgroup in which IS concentration was correlated with Hb level [23].
IS and PCS derive from the metabolism of tryptophan and tyrosin respectively by bacteria within the gastro-intestinal tract [24]. Hemodialysis patients without colon have very low IS and PCS plasma concentrations, dem-onstrating an important role of the gut in some uremic toxins metabolism [25]. Plasma concentrations of these toxins in renal failure patients are influenced by dietary intakes [26] or the use of sorbents as AST-120 [27]. In our study, IAA and PCS were associated with the ESA/ Hb ratio or the ERI in univariate analysis, but these associations were no longer significant when adjusted on other parameters including albumin, an important nutri-tional maker. Parameters independently associated with anemia parameters in hemodialysis patients were TSAT, ferritin, and albumin. These parameters are the classical parameters influencing ESA sensibility [12]. Other parameters as CRP, β2-microglobulin or PTH did not reach significance in our study.
AST120 -an oral sorbent of uremic toxins- improved hemoglobin level in non-dialyzed CKD stage 5 patients when compared to placebo although ESA doses remained identical in the two groups [11]. This improve-ment was attributed to IS and PCS which plasmatic levels were lower in the AST-120 group. Nevertheless, AST120 is a non-specific adsorbent and its effect cannot definitely be attributed to these toxins removal because it could be due to other adsorbed compounds.
It is not clear why IS, IAA and PCS exert an important effect in vitro and no or a very low effect in vivo, but an important clue is that in vitro experiments are often performed with higher uremic toxin concentrations and there might be a dose effect relationship between toxin concentrations and anemia [7, 21].
Our study exerts some limits. First, we did not measure free concentration of IS and PCS; however, effects of IS in vitro is not influenced by albumin concentration in the media [8], and in clinical studies the observed concentra-tions of total and free IS are well correlated. Second, we studied prevalent hemodialysis patients in which Hb was performed every week and anemia very cautiously treated. Results in incident hemodialysis or in non-dialysis patients cannot be extrapolated from these results.
Conclusion
In conclusion, we were unable to show any correlation be-tween IAA, IS and PCS plasmatic concentrations and any anemia parameter in hemodialysis patients. It is likely that indolic uremic toxins and PCS have no or a very low effect on anemia parameters, i.e. Hb con-centrations or ESA hypo responsiveness in this population.
Abbreviations
AhR:Aryl hydrocarbon receptor; ARNT: AhR nuclear transcriptor; CKD: Chronic kidney disease; DOPPS: Dialysis outcomes and practices patterns study; EPO: Erythropoietin; ERI: ESA resistance index;
ESA: Erythropoiesis stimulating agents; IAA: Indole-3-acetic acid; IS: Indoxyl sulfate; PCS: Paracresyl-sulfate; PTH: Parathormone; TSAT: Transferrin saturation
Acknowledgements
Not applicable.
Funding
Not applicable.
Availability of data and materials
The datasets used and/or analyzed during the current study are available from the corresponding author on reasonable request.
Authors’contributions
SBa, MS, MP and SBu conceived the study. SBa, MP, MS and NM carried out data collection and laboratory tests. SG and YM performed statistical analysis. SBa, MP, MS, SBu, YB, PB and AD critically reviewed the manuscript and provided valuable suggestions. All authors contributed to the outline of the paper, the interpretation of the data and the discussion.
Ethics approval and consent to participate
According to French law, it is not necessary or possible to obtain approval from an ethics committee (Comité de Protection des Personnes, CPP) for this type of non-interventional study. Moreover, CPP ethics committees are not entitled to issue waivers of approval for this type of study.
Consent for publication
Not applicable.
Competing interests
The authors declare that they have no competing interests.
Publisher’s Note
Springer Nature remains neutral with regard to jurisdictional claims in published maps and institutional affiliations.
Author details
1Centre de néphrologie et transplantation rénale, Assistance Publique des
Hôpitaux de Marseille, Aix-Marseille University, Marseille, France.2Phocean Nephrology Institute, Clinique Bouchard, 77 rue du Docteur Escat, 13006 Marseille, France.3ELSAN, Clinique Bouchard, Marseille, France.4UMR_S 1076, Vascular Research Center of Marseille, INSERM, Aix Marseille University, Marseille, France.5Association des Dialysés Provence et Corse, Marseille, France.6EA3279, unité de recherche santé publique et maladies chroniques, Aix-Marseille University, Marseille, France.
Received: 6 May 2017 Accepted: 14 July 2017
References
1. Moranne O, Froissart M, Rossert J, Gauci C, Boffa JJ, Haymann JP, M'rad MB, Jacquot C, Houillier P, Stengel B, Fouqueray B, NephroTest Study Group. Timing of onset of CKD-related metabolic complications. J Am Soc Nephrol. 2009 Jan;20(1):164–71.
2. Disease K, Improving Global Outcomes (KDIGO) CKD Work Group. KDIGO 2012 clinical practice guideline for the evaluation and management of chronic kidney disease. Kidney Int Suppl. 2013;3:1–150.
3. Macdougall IC. Role of uremic toxins in exacerbating anemia in renal failure. Kidney Int Suppl. 2001 Feb;78:S67–72.
4. Babitt JL. Lin HYMechanisms of anemia in CKD. J Am Soc Nephrol. 2012 Oct;23(10):1631–4.
6. Kushner DS, Beckman B, Nguyen L, Chen S, Della Santina C, Husserl F, Rice J, Fisher JW. Polyamines in the anemia of end-stage renal disease. Kidney Int. 1991 Apr;39(4):725–32.
7. Chiang CK, Tanaka T, Inagi R, Fujita T, Nangaku M. Indoxyl sulfate, a representative uremic toxin, suppresses erythropoietin production in a HIF-dependent manner. Lab Investig. 2011;91:1564–71.
8. Gondouin B, Cerini C, Dou L, Sallée M, Duval-Sabatier A, Pletinck A, Calaf R, Lacroix R, Jourde-Chiche N, Poitevin S, Arnaud L, Vanholder R, Brunet P, Dignat-George F, Burtey S. Indolic uremic solutes increase tissue factor production in endothelial cells by the aryl hydrocarbon receptor pathway. Kidney Int. 2013 Oct;84(4):733–44.
9. Asai H, Hirata J, Hirano A, Hirai K, Seki S, Watanabe-Akanuma M. Activation of aryl hydrocarbon receptor mediates suppression of hypoxia-inducible factor-dependent erythropoietin expression by indoxyl sulfate. Am J Physiol Cell Physiol. 2016 Jan 15;310(2):C142–50.
10. Ahmed MS, Abed M, Voelkl J, Lang F. Triggering of suicidal erythrocyte death by uremic toxin indoxyl sulfate. BMC Nephrol. 2013 Nov;4:14–244. 11. Wu IW, Hsu KH, Sun CY, Tsai CJ, Wu MS, Lee CC. Oral adsorbent AST-120 potentiates the effect of erythropoietin-stimulating agents on stage 5 chronic kidney disease patients: a randomized crossover study. Nephrol Dial Transplant. 2014 Sep;29(9):1719–27.
12. Gunnell J, Yeun JY, Depner TA, Kaysen GA. Acute-phase response predicts erythropoietin resistance in hemodialysis and peritoneal dialysis patients. Am J Kidney Dis. 1999 Jan;33(1):63–72.
13. Daugirdas JT. Second generation logarithmic estimates of single-pool variable volume Kt/V: an analysis of error. J Am Soc Nephrol. 1993;4:1205–13. 14. Regidor DL, Kopple JD, Kovesdy CP, Kilpatrick RD, McAllister CJ, Aronovitz J,
Greenland S, Kalantar-Zadeh K. Associations between changes in hemoglobin and administered erythropoiesis-stimulating agent and survival in hemodialysis patients. J Am Soc Nephrol. 2006 Apr;17(4):1181–91. 15. López-Gómez JM, Portolés JM, Aljama P. Factors that condition the
response to erythropoietin in patients on hemodialysis and their relation to mortality. Kidney Int Suppl. 2008 Dec;111:S75–81.
16. Fukuma S, Yamaguchi T, Hashimoto S, Nakai S, Iseki K, Tsubakihara Y, Fukuhara S. Erythropoiesis-stimulating agent responsiveness and mortality in hemodialysis patients: results from a cohort study from the dialysis registry in Japan. Am J Kidney Dis. 2012 Jan;59(1):108–16.
17. Calaf R, Cerini C, Genovesio C, Verhaeghe P, Jourde-Chiche N, Bergé-Lefranc D, Gondouin B, Dou L, Morange S, Argilés A, Rathelot P, Dignat-George F, Brunet P, Charpiot P. Determination of uremic solutes in biological fluids of chronic kidney disease patients by HPLC assay. J Chromatogr B. 2011;879:2281–6. 18. National Kidney Foundation. KDOQI clinical practice guideline for Hemodialysis
adequacy: 2015 update. Am J Kidney Dis. 2015 Nov;66(5):884–930.
19. Wallner SF, Kurnick JE, Ward HP, Vautrin R, Alfrey AC. The anemia of chronic renal failure and chronic diseases: in vitro studies of erythropoiesis. Blood. 1976 Apr;47(4):561–9.
20. Wallner SF, Vautrin RM. The anemia of chronic renal failure: studies of the effect of organic solvent extraction of serum. J Lab Clin Med. 1978 Sep;92(3):363–9. 21. Tanaka T, Yamaguchi J, Higashijima Y, Nangaku M. Indoxyl sulfate signals for
rapid mRNA stabilization of Cbp/p300-interacting transactivator with Glu/ asp-rich carboxy-terminal domain 2 (CITED2) and suppresses the expression of hypoxia-inducible genes in experimental CKD and uremia. FASEB J. 2013 Oct;27(10):4059–75.
22. Dou L, Burtey S. The harmful effect of indoxyl sulfate on neovascularization in chronic kidney disease. Kidney Int. 2016 Mar;89(3):532–4.
23. Huang JY, Hsu CW, Yang CW, Hung CC, Huang WH. Role of anuria in the relationship between indoxyl sulfate and anemia in peritoneal dialysis patients. Ther Clin Risk Manag. 2016 Nov 28;12:1797–803.
24. Sallée M, Dou L, Cerini C, Poitevin S, Brunet P, Burtey S. The aryl hydrocarbon receptor-activating effect of uremic toxins from tryptophan metabolism: a new concept to understand cardiovascular complications of chronic kidney disease. Toxins (Basel). 2014 Mar 4;6(3):934–49.
25. Aronov PA, Luo FJ, Plummer NS, Quan Z, Holmes S, Hostetter TH, Meyer TW. Colonic contribution to uremic solutes. J Am Soc Nephrol. 2011 Sep; 22(9):1769–76.
26. Marzocco S, Dal Piaz F, Di Micco L, Torraca S, Sirico ML, Tartaglia D, Autore G, Di Iorio B. Very low protein diet reduces indoxyl sulfate levels in chronic kidney disease. Blood Purif. 2013;35(1–3):196–201.
27. Niwa T, Yazawa T, Ise M, Sugano M, Kodama T, Uehara Y, Maeda K. Inhibitory effect of oral sorbent on accumulation of albumin-bound indoxyl sulfate in serum of experimental uremic rats. Nephron. 1991;57(1):84–8.
• We accept pre-submission inquiries
• Our selector tool helps you to find the most relevant journal
• We provide round the clock customer support
• Convenient online submission
• Thorough peer review
• Inclusion in PubMed and all major indexing services
• Maximum visibility for your research
Submit your manuscript at www.biomedcentral.com/submit