R E S E A R C H A R T I C L E
Open Access
Corneal permeability changes in dry eye
disease: an observational study
Kenji Fujitani
*, Neha Gadaria, Kyu-In Lee, Brendan Barry and Penny Asbell
Abstract
Background:Diagnostic tests for dry eye disease (DED), including ocular surface disease index (OSDI), tear breakup time (TBUT), corneal fluorescein staining, and lissamine staining, have great deal of variability. We investigated whether fluorophotometry correlated with previously established DED diagnostic tests and whether it could serve as a novel objective metric to evaluate DED.
Methods:Dry eye patients who have had established signs or symptoms for at least 6 months were included in
this observational study. Normal subjects with no symptoms of dry eyes served as controls. Each eye had a baseline fluorescein scan prior to any fluorescein dye. Fluorescein dye was then placed into both eyes, rinsed with saline solution, and scanned at 5, 10, 15, and 30 min. Patients were administered the following diagnostic tests to correlate with fluorophotometry: OSDI, TBUT, fluorescein, and lissamine. Standard protocols were used. P< 0.05 was considered significant.
Results: Fifty eyes from 25 patients (DED = 22 eyes, 11 patients; Normal = 28 eyes, 14 patients) were included.
Baseline scans of the dry eye and control groups did not show any statistical difference (p= 0.84). Fluorescein concentration of DED and normal patients showed statistical significance at all time intervals (p< 10−5, 0.001, 0.002, 0.049 for 5, 10, 15, & 30 min respectively). Fluorophotometry values converged towards baseline as time elapsed, but both groups were still statistically different at 30 min (p< 0.01). We used four fluorophotometry scoring methods and correlated them with OSDI, TBUT, fluorescein, and lissamine along with adjusted and aggregate scores. The four scoring schemes did not show any significant correlations with the other tests, except for correlations seen with lissamine and 10 (p= 0.045, 0.034) and 15 min (p= 0.013, 0.012), and with aggregate scores and 15 min (p= 0.042, 0.017).
Conclusions: Fluorophotometry generally did not correlate with any other DED tests, even though it showed
capability of differentiating between DED and normal eyes up to 30 min after fluorescein dye instillation. There may be an aspect of DED that is missed in the current regimen of DED tests and only captured with fluorophotometry. Adding fluorophotometry may be useful in screening, diagnosing, and monitoring patients with DED.
Keywords: Fluorophotometry, Dry eye, Keratoconjunctivitis sicca, Ocular surface disease, Corneal permeability
Background
Keratoconjunctivitis sicca or dry eye disease (DED) is one of the most common ocular conditions that patients seek care for and affects as many as 11.4 % of men and 16.7 % of women [1]. Current treatment options range from arti-ficial tears to anti-inflammatory and immunosuppressant agents, and treatment has shown to drastically improve
quality of life and prevent damage to the ocular surface [2]. The most common methods to diagnose DED include a comprehensive eye exam, symptom survey with Ocular Surface Disease Index (OSDI), tear breakup time (TBUT), lissamine green staining (lissamine), Schirmer’s, and cor-neal fluorescein staining (fluorescein), but these diagnostic tests have a great deal of variability and potential for bias, making objective and accurate DED diagnosis and man-agement difficult [3].
* Correspondence:kenji.fujitani@icahn.mssm.edu;kenji.fujitani@mssm.edu
Department of Ophthalmology, Icahn School of Medicine at Mount Sinai, New York, NY 10029, USA
Miyata et al. suggested that a fluorophotometer could measure corneal epithelial permeability due to the correl-ation between fluorescein concentrcorrel-ations in the cornea and corneal damage [4]. Specifically, fluorophotometry could evaluate ocular surface epithelium barrier function [5]. Although some degree of corneal staining is inevitable and found on 79 % of corneas, the majority of the dye should remain in the tear film on the surface of the eye and not adhere to the eyes as the corneal epithelium pro-tects the underlying layers of the cornea under normal conditions [6, 7].
Using the Fluorotron Master fluorophotometer (Ocu-metrics, Mountain View, CA), we showed in our previ-ous study that differentiating between DED and normal patients depending on the fluorescein concentration in the cornea at certain time intervals was possible [8]. This study aims to test the capability of the fluorophot-ometer further: we investigated whether fluorophoto-metry correlated with already established diagnostic tests for dry eye disease and whether it could serve as a minimally invasive objective metric to evaluate dry eye disease.
Methods
After receiving approval from Icahn School of Medicine at Mount Sinai’s Institutional Review Board, prospective patients were recruited for this observational study. Informed consent was obtained from all subjects. The study was carried out with patients who visited the Faculty Practice of Department of Ophthalmology at Icahn School of Medicine at Mount Sinai in New York, NY.
Data were collected from normal and dry eye pa-tients, who were followed for DED by an ophthalmolo-gist prior to the study for 6 months or more. Patients were classified as normal or DED according to their clinical diagnosis. DED patients must have had at least 2 signs and/or symptoms of dry eyes such as foreign body sensation, ocular irritation, light sensitivity, burn-ing and grittiness, itchiness, edema of lid, conjunctiva and cornea, or hyperemia in order to be included in the study. Normal subjects who had no signs or symptoms of dry eyes or other ocular problems except for refractive error served as controls. Patients with any conditions that limited their ability to understand the consent were ex-cluded from the study. Pregnant patients, those under 18 years of age, patients with acute or sub-acute inflam-mation/infection of the anterior segment of the eye, and those with history of allergy to fluorescein were also ex-cluded from the study.
All fluorophotometry of the cornea was performed with the Fluorotron Master flurophotometer (Ocumetrics, Mountain View, CA) in accordance to the manufacturer’s instructions and the provided scanning software. Each eye had a baseline fluorescein scan performed prior to any
introduction of fluorescein dye to measure each eye’s intrinsic fluorescence. 50μl of 1 % sodium fluorescein dye was then placed into both eyes. Two minutes later, the fluorescein was thoroughly rinsed with 100 μl of non-preserved normal balanced saline solution. Fluorescein scans were started immediately after washing and re-corded at 5, 10, 15, and 30 min thereafter, beginning with the OD eye. The fluorescein scan involved no direct contact between the eye and the device. The corneal peak values of fluorescein concentration were recorded. The following diagnostic tests were also administered to patients with DED to correlate with fluorophotometry results: OSDI, TBUT, fluorescein, and lissamine. Standard protocols were used for the DED diagnostic exams. TBUT was observed under cobalt blue illumination, once per eye. We used the National Eye Institute scale for grading fluorescein corneal staining and the Van Bijsterveld scale for grading lissamine green staining of the conjunctiva.
Corneal fluorescein levels at multiple time points in both eyes were recorded into Microsoft Excel (Microsoft, Redmond, Washington). Spearman’s correlations were used to detect any correlations between fluorophoto-metry and other DED diagnostic tests. Microsoft Excel and SPSS version 20.0 (SPSS Inc., Chicago, IL) were used for statistical analysis. P< 0.05 (two-tailed) was considered significant.
Results
We included 50 eyes from 25 patients (DED = 22 eyes, 11 patients; Normal = 28 eyes, 14 patients). Baseline scans of the dry eye (22.19 ± 8.05 ng/ml) and control (21.81 ± 5.17 ng/ml) did not show any statistical differ-ence (p= 0.84). Figure 1 shows the amount of increase in fluorescein concentration relative to baseline at mul-tiple time intervals (5, 10, 15, and 30 min). Fluorescein concentration of DED and control groups showed statis-tical significance at all time intervals (p< 10−5, 0.001, 0.002, 0.049 for 5, 10, 15, & 30 min, respectively). DED al-ways had higher fluorescein concentrations than controls. Fluorescein concentrations in both groups converged to-wards their baseline as time elapsed, but were still statisti-cally different from their baseline at 30 min (p< 0.01).
intervals (5, 10, 15, and 30 min) were labeled as‘PERC X’ where X represented the minutes. 4) log values of ‘PERC X’were taken and labeled as‘LOGPERC X’.
To determine how fluorophotometry reflected the re-sults of other DED diagnostic methods, we correlated the four fluorophotometry scoring schemes with OSDI, TBUT, fluorescein, and lissamine (Table 1). OSDI scores were adjusted into quartiles (0–25 = score of 1, 26–50 = score of 2, 51–75 = score of 3, 76–100 = score of 4) named ‘OSDI Quartiles’to create a score that was more similar to scores of other tests. The double-digit OSDI scores were adjusted to fit with the single digit scores of other diagnostic tests. Using this, we created an aggregate score that added OSDI Quartiles, TBUT, Fluorescein, and Lissamine (Aggregate score = OSDI Quartile + TBUT + fluorescein + lissamine).
After correlation to other DED diagnostic tests, the four fluorophotometry scoring schemes generally did not show any significant correlations with OSDI, OSDI Quartiles, TBUT, fluorescein, and lissamine tests. Signifi-cant correlations were seen with lissamine scores and LOGDIFF 10 (p= 0.045), LOGDIFF 15 (p= 0.013), LOG-PERC 10 (p= 0.034), and LOGPERC 15 (p= 0.012) and with aggregate scores and LOGDIFF 15 (p= 0.042) and LOGPERC 15 (p= 0.017).
Discussion
DED affects a significant number of people, with preva-lence ranging from 7 % in the United States to 33 % in Taiwan and Japan, but DED is difficult to diagnose and
no clear gold standard to evaluate DED exists [9, 10]. Clinicians often rely on multitude of tests, including symptoms or signs and a battery of diagnostic tests, in-cluding TBUT, fluorescein, and lissamine. We strove to determine if fluorophotometry could fill that void through correlation with other established tests and bet-ter classify DED according to severity.
Past studies by Kinoshita et al. and Yokoi have found that the fluorophotometer could evaluate ocular surface epithelium barrier function using a similar methodology to our study [5, 11–13]. In one of their studies, they showed that in accordance with severity, fluorescein up-take in dry eye patients showed significant increase, and that with treatment with hyaluronan eye drops, there was significant barrier function improvement after 2 weeks [12, 13]. In our study, we evaluated not only fluorophotometry’s ability to differentiate between dry eye and normal eyes, but also the correlations of its results with different diagnostic techniques of dry eye. Among the multitude of tests available, we aimed to in-vestigate whether fluorophotometry could outperform any diagnostic tests, combine 2–3 diagnostic tests, or become another test that measures an aspect of dry eye that is not yet captured by any of the diagnostic tests for DED.
Consistent with our previous study, this study showed that fluorophotometry could differentiate between DED and normal eyes up to 30 min post fluorescein dye instillation [8]. However, except for minor correlations with lissamine and aggregate scores at 10 and 15 min, fluorophotometry in our current study did not show any significant correlations with other DED diagnostic tests, such as OSDI, TBUT, fluorescein, and lissamine. These differences could arise because fluorophotometry en-compasses a larger view of DED, taking into account the overall increased permeability of the cornea in ocular surface disease patients rather than focusing on one as-pect of DED. For instance, TBUT takes into account tear production and evaporation, but fluorophotometry in-cludes all factors that damage the corneal epithelium, and utilizes tear break up as only one component of many factors that contribute to DED.
Another possible function for fluorophotometry is to measure aspects of DED not captured by other diagnostic tests, which are somewhat imperfect themselves and thus contribute to the difficulty of objectively diagnosing DED. Dry eye patients have ocular surface disease that increase corneal permeability to fluorescein, but the amount of change as we measured it did not correlate with other tests. Fluorophotometry may include a component not yet detected with current diagnostic tests and thus could be done to rule out DED when DED is suspected, but other diagnostic tests are normal. Due to its unique position relative to other tests, adding fluorophotometry as one of
Fluorescein Concentration
0 500 1000 1500 2000 2500
0 5 10 15 20 25 30
Average Fluorescein Concentration (ng/ml) Time Elapsed (minutes)
its basic tests when evaluating DED may aid in diagnosing DED or in research settings studying DED. Continued re-search in this area could clarify this mismatch.
Fluorophotometry also did not correlate with clinical symptoms as measured by OSDI. Although there is some evidence showing OSDI can measure the severity of dry eye, the non-correlation was unsurprising since DED signs and symptoms are poorly correlated, compounded by
variability between seasons, time of day, and findings among eye examinations, suggesting that symptoms may not truly reflect the whole dry eye state in patients [14, 15]. Though the cornea may be damaged, patients may still be asymptomatic. One possible explanation is that with damage to the ocular surface, the central cor-nea sensitivity decreases, making the patient less symp-tomatic [14, 16]. Similarly, the cornea may be healthy
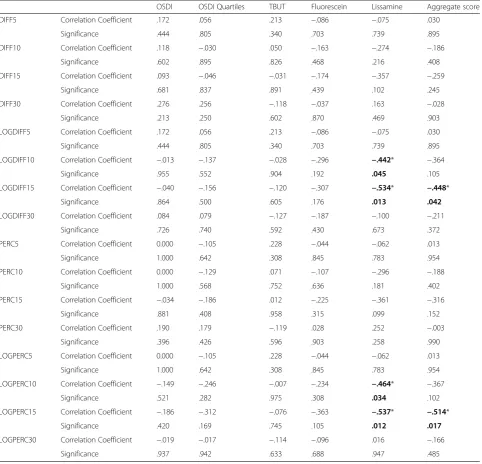
Table 1Comparison of four fluorophotometry scoring schemes with other dry eye diagnostic tests
OSDI OSDI Quartiles TBUT Fluorescein Lissamine Aggregate score
DIFF5 Correlation Coefficient .172 .056 .213 −.086 −.075 .030
Significance .444 .805 .340 .703 .739 .895
DIFF10 Correlation Coefficient .118 −.030 .050 −.163 −.274 −.186
Significance .602 .895 .826 .468 .216 .408
DIFF15 Correlation Coefficient .093 −.046 −.031 −.174 −.357 −.259
Significance .681 .837 .891 .439 .102 .245
DIFF30 Correlation Coefficient .276 .256 −.118 −.037 .163 −.028
Significance .213 .250 .602 .870 .469 .903
LOGDIFF5 Correlation Coefficient .172 .056 .213 −.086 −.075 .030
Significance .444 .805 .340 .703 .739 .895
LOGDIFF10 Correlation Coefficient −.013 −.137 −.028 −.296 −.442* −.364
Significance .955 .552 .904 .192 .045 .105
LOGDIFF15 Correlation Coefficient −.040 −.156 −.120 −.307 −.534* −.448*
Significance .864 .500 .605 .176 .013 .042
LOGDIFF30 Correlation Coefficient .084 .079 −.127 −.187 −.100 −.211
Significance .726 .740 .592 .430 .673 .372
PERC5 Correlation Coefficient 0.000 −.105 .228 −.044 −.062 .013
Significance 1.000 .642 .308 .845 .783 .954
PERC10 Correlation Coefficient 0.000 −.129 .071 −.107 −.296 −.188
Significance 1.000 .568 .752 .636 .181 .402
PERC15 Correlation Coefficient −.034 −.186 .012 −.225 −.361 −.316
Significance .881 .408 .958 .315 .099 .152
PERC30 Correlation Coefficient .190 .179 −.119 .028 .252 −.003
Significance .396 .426 .596 .903 .258 .990
LOGPERC5 Correlation Coefficient 0.000 −.105 .228 −.044 −.062 .013
Significance 1.000 .642 .308 .845 .783 .954
LOGPERC10 Correlation Coefficient −.149 −.246 −.007 −.234 −.464* −.367
Significance .521 .282 .975 .308 .034 .102
LOGPERC15 Correlation Coefficient −.186 −.312 −.076 −.363 −.537* −.514*
Significance .420 .169 .745 .105 .012 .017
LOGPERC30 Correlation Coefficient −.019 −.017 −.114 −.096 .016 −.166
Significance .937 .942 .633 .688 .947 .485
Fluorophotometry values are categorized into 4 major schemes. 1) Increases in fluorescein concentration relative to its baseline at multiple time intervals (5, 10, 15, and 30 min) are labeled‘DIFF X’where X represents the minutes. 2) Log values of‘DIFF X’are labeled‘LOGDIFF X.’3) Percent changes in fluorescein concentration relative to its baseline at multiple time intervals (5, 10, 15, and 30 min) are labeled‘PERC X.’4) Log values of‘PERC X’are labeled‘LOGPERC X.’ Fluorophotometry scoring schemes are compared with Ocular Surface Disease Index (OSDI), tear break up time (TBUT), fluorescein, and lissamine. OSDI scores were adjusted into quartiles (0–25 = score of 1, 26–50 = score of 2, 51–75 = score of 3, 76–100 = score of 4) and called‘OSDI Quartiles.’An aggregate score was calculated by adding OSDI quartiles, TBUT, fluorescein, and lissamine
even as patients report multitude of symptoms. With fluorophotometry’s capability to differentiate dry eyes from normal eyes, one possibility could be to use fluor-ophotometry as one of DED screening tools to detect subclinical DED in seemingly healthy patients. Earlier detection could lead to earlier treatment, or possible prevention of progression to severe DED when it may be more difficult to intervene. Higher values of fluoro-photometry in DED patients correlate with increased permeability of the cornea, so fluorophotometry could be used to measure progression of corneal damage and assess whether current treatments for DED are suffi-cient, adjusting as needed depending on the results [17].
This study is not without limitations. Sample size was limited, and this factor most likely contributed to the relatively high variability in fluorescein concentrations with the fluorophotometer. More eyes may reduce this variability, but the biggest likely cause of this variation is the lumping of all DED eyes into one dry eye group. Mild DED was not differentiated from severe DED, as there was no clear way to do so without a gold standard or correlations with other exams. The next step would be to explore whether fluorophotometry correlates with DED severity, especially if it may be a tool that can grade DED severity on a sliding scale. Furthermore, we cannot eliminate some of the intrinsic problems associ-ated with fluorescein, especially at higher concentra-tions, and the Fluorotron Master flurophotometer itself. For instance, because the machine cannot clearly distinguish the tear film from the cornea, we utilized a similar washing method from previous studies to elim-inate any excess fluorescein remaining in the tear film and to standardize the technique [8, 12, 18, 19]. Al-though the process was controlled as much as possible, some patients may have more or less fluorescein left on the tear film, possibly due to mechanical issues such as excessive tearing or blinking. Finally, although we aimed to capture most factors that contribute to DED, not all possible diagnostic tests were done to reduce burden on the patients. In future studies, comparing fluorophotometry to more diagnostic tests such as tear osmolarity may be beneficial.
Conclusions
The degree of ocular surface disease as measured by fluor-ophotometry generally did not correlate with any other clinical DED tests. Given fluorophotometry’s capability of differentiating between DED and normal eyes, there may be an aspect of DED that is missed in the current regimen of DED tests and only captured with fluorophotometry. Adding fluorophotometry as another diagnostic test for DED may be useful in screening, assessing, and monitor-ing patients with DED.
Ethics approval and consent to participate
Approval from Icahn School of Medicine at Mount Sinai’s Institutional Review Board. Informed consent was obtained from all subjects.
Consent for publication Not applicable.
Availability of data and materials
If needed, data will be shared upon request.
Abbreviations
DED:dry eye disease; DIFF: increases in fluorescein concentration relative to its baseline; LOGDIFF: log values of DIFF; LOGPERC: log values of PERC; OSDI: ocular surface disease index; PERC: percent changes in fluorescein concentration relative to its baseline; TBUT: tear breakup time.
Competing interests
The authors declare that they have no competing interests.
Authors’contributions
KF performed data/statistical analysis, interpretation of data, and drafted the manuscript. NG and KL designed the study and acquired data. BB interpreted data and revised the manuscript. PA conceived the study, participated in the study design, and revised the manuscript. All authors read and approved the final manuscript.
Acknowledgements
Not applicable.
Funding
Financial support from these organizations is gratefully acknowledged: Martin and Toni Sosnoff Fund, Pfizer (unrestricted grant), Research to Prevent Blindness (unrestricted grant), and Fight for Sight. The funding organizations had no role in the design or conduct of this research.
Received: 5 May 2015 Accepted: 4 May 2016
References
1. Moss SE, Klein R, Klein BE. Prevalence of and risk factors for dry eye syndrome. Arch Ophthalmol. 2000;118:1264–8.
2. Yao W, Davidson RS, Durairaj VD, Gelston CD. Dry eye syndrome: an update in office management. Am J Med. 2011;124:1016–8.
3. Sullivan BD, Crews LA, Messmer EM, Foulks GN, Nichols KK, Baenninger P, et al. Correlations between commonly used objective signs and symptoms for the diagnosis of dry eye disease: clinical implications. Acta Ophthalmol. 2014;92:161–6.
4. Miyata K, Amano S, Sawa M, Nishida T. A novel grading method for superficial punctate keratopathy magnitude and its correlation with corneal epithelial permeability. Arch Ophthalmol. 2003;121:1537–9.
5. Yokoi K, Yokoi N, Kinoshita S. Impairment of ocular surface epithelium barrier function in patients with atopic dermatitis. Br J Ophthalmol. 1998;82:797–800.
6. Dundas M, Walker A, Woods RL. Clinical grading of corneal staining of non-contact lens wearers. Ophthalmic Physiol Opt. 2001;21:30–5.
7. Cui L, Huxlin KR, Xu L, MacRae S, Knox WH. High-resolution, noninvasive, two-photon fluorescence measurement of molecular concentrations in corneal tissue. Invest Ophthalmol Vis Sci. 2011;52:2556–64.
8. Fahim MM, Haji S, Koonapareddy CV, Fan VC, Asbell PA. Fluorophotometry as a diagnostic tool for the evaluation of dry eye disease. BMC Ophthalmol. 2006;6:20.
9. Gayton JL. Etiology, prevalence, and treatment of dry eye disease. Clin Ophthalmol. 2009;3:405–12.
11. Kinoshita S, Adachi W, Sotozono C, Nishida K, Yokoi N, Quantock AJ, et al. Characteristics of the human ocular surface epithelium. Prog Retin Eye Res. 2001;20:639–73.
12. Yokoi N, Kinoshita S. Clinical evaluation of corneal epithelial barrier function with the slit-lamp fluorophotometer. Cornea. 1995;14:485–9.
13. Yokoi N, Komuro A, Nishida K, Kinoshita S. Effectiveness of hyaluronan on corneal epithelial barrier function in dry eye. Br J Ophthalmol. 1997;81:533–6. 14. Barboza MN, Barboza GN, de Melo GM, Sato E, Dantas MC, Dantas P, et al.
Correlation between signals and symptoms of dry eye in Sjögren's syndrome patients. Arq Bras Oftalmol. 2008;71:547–52.
15. Zeev MS, Miller DD, Latkany R. Diagnosis of dry eye disease and emerging technologies. Clin Ophthalmol. 2014;8:581–90.
16. Bourcier T, Acosta MC, Borderie V, Borrás F, Gallar J, Bury T, et al. Decreased corneal sensitivity in patients with dry eye. Invest Ophthalmol Vis Sci. 2005;46:2341–5.
17. Nelson JD. Simultaneous evaluation of tear turnover and corneal epithelial permeability by fluorophotometry in normal subjects and patients with keratoconjunctivitis sicca (KCS). Trans Am Ophthalmol Soc. 1995;93:709–53. 18. Joshi A, Maurice D, Paugh JR. A new method for determining corneal
epithelial barrier to fluorescein in humans. Invest Ophthalmol Vis Sci. 1996;37:1008–16.
19. McNamara NA, Fusaro RE, Brand RJ, Polse KA, Srinivas SP. Measurement of corneal epithelial permeability to fluorescein. A repeatability study. Invest Ophthalmol Vis Sci. 1997;38:1830–9.
• We accept pre-submission inquiries
• Our selector tool helps you to find the most relevant journal • We provide round the clock customer support
• Convenient online submission
• Thorough peer review
• Inclusion in PubMed and all major indexing services • Maximum visibility for your research
Submit your manuscript at www.biomedcentral.com/submit