R E S E A R C H A R T I C L E
Open Access
Progression of liver cirrhosis to HCC:
an application of hidden Markov model
Nicola Bartolomeo
*†, Paolo Trerotoli
†and Gabriella Serio
†Abstract
Background:Health service databases of administrative type can be a useful tool for the study of progression of a disease, but the data reported in such sources could be affected by misclassifications of some patients’real disease states at the time. Aim of this work was to estimate the transition probabilities through the different degenerative phases of liver cirrhosis using health service databases.
Methods:We employed a hidden Markov model to determine the transition probabilities between two states, and of misclassification. The covariates inserted in the model were sex, age, the presence of comorbidities correlated with alcohol abuse, the presence of diagnosis codes indicating hepatitis C virus infection, and the Charlson Index. The analysis was conducted in patients presumed to have suffered the onset of cirrhosis in 2000, observing the disease evolution and, if applicable, death up to the end of the year 2006.
Results:The incidence of hepatocellular carcinoma (HCC) in cirrhotic patients was 1.5% per year. The probability of developing HCC is higher in males (OR = 2.217) and patients over 65 (OR = 1.547); over 65-year-olds have a greater probability of death both while still suffering from cirrhosis (OR = 2.379) and if they have developed HCC (OR = 1.410). A more severe casemix affects the transition from HCC to death (OR = 1.714). The probability of misclassifying subjects with HCC as exclusively affected by liver cirrhosis is 14.08%.
Conclusions:The hidden Markov model allowing for misclassification is well suited to analyses of health service databases, since it is able to capture bias due to the fact that the quality and accuracy of the available information are not always optimal. The probability of evolution of a cirrhotic subject to HCC depends on sex and age class, while hepatitis C virus infection and comorbidities correlated with alcohol abuse do not seem to have an influence.
Background
The evolution of chronic degenerative disease is charac-terized by progression through intermediate states to advanced disease and death. For these diseases, survival analysis must take into account the various transitions from one state to the next, as well as a series of prognos-tic variables that can have an influence on each event including death. For example, liver cirrhosis can evolve to hepatocellular carcinoma, and the presence of comor-bidities, exposure to hepatitis B or C virus, as well as alcohol consumption and age, can influence the terminal event. In fact, liver cirrhosis is well known to consist of a diffuse alteration of the liver structure resulting from
protracted processes of liver inflammation and necrosis of different natures. The main causes of liver cirrhosis are chronic viral hepatitis B or C and the consumption of alcohol. In particular, alcohol abuse can halve the time of onset of cirrhosis in a patient already affected by chronic viral hepatitis (from about 20-30 years to 10-15 years). Hepatocellular carcinoma occurs at a rate of 1% to 4% per year after cirrhosis is established [1] and cirrhosis underlies HCC in approximately 80%-90% of cases worldwide [2]. Stochastic multistate or competing mod-els, like Markov chains, are those best suited to the analy-sis of such phenomena [3-6]. It would, of course, be too long and costly to program clinical studies, or indeed prospective and follow-up trials, to study the natural history of chronic degenerative diseases in order to be able to apply multistate models correctly. In fact, in * Correspondence: nicolabartolomeo@virgilio.it
†Contributed equally
Department of Biomedical Science and Human Oncology, Chair of Medical Statistics, University of Bari, Bari, Italy
patients affected by these diseases passage from one state to the next often occurs after fairly long intervals.
Retrospective studies, based on the use of health service databases of administrative type (HSDBA), can be a valid alternative, despite the limits posed by the fact that the quality and accuracy of the available infor-mation are not always optimal. For example, using the hospital discharge sheets (HDS) database, patients can be followed from the probable diagnosis of onset of the disease through the subsequent worsening states. More-over, by means of linkage with the death certificates database (DCDB), it is ultimately possible to trace the cause of death, if applicable.
A common problem when applying Markov models to HSDBA is that assessment of the disease state of an individual can be subject to classification errors. A simi-lar classification problem frequently occurs in research in the field of social sciences, where wide use is made of a series of models that take into account latent states [7-9].
Multistate models that exploit the properties of Mar-kov chains offer a useful methodological structure for describing complex time-dependent outcomes [10]. The procedure for estimation of the probability of transition most widely adopted in Markov models is the Cox pro-portional model. This model can describe survival time in function of a multitude of prognostic factors [11], under the fundamental assumption of the proportional-ity of hazards, in other words that the examined factors will have a constant impact over time on the risk of death.
Jackson et al. (2003) [12] described a procedure for simultaneously estimating the transition rates and the probabilities of misclassification in a hidden Markov model, supplying software for implementing the multi-state hidden Markov model in the R Project program-ming environment. Aim of the present work is to study the pathway leading subjects affected by liver cirrhosis to develop hepatocellular carcinoma and to death, deter-mining the transition probabilities through the degen-erative disease states and verifying whether, apart from being risk factors for the onset of cirrhosis, chronic viral hepatitis B and C infection and alcohol abuse also have a role in the process leading cirrhotic subjects to develop hepatocellular carcinoma and/or to death.
Methods
Retrospective observational studies can be conducted using the HSDBA, to assess the natural history of the disease in a group of subjects. In fact, the HDS database can be employed to individuate all subjects admitted to hospital one or more times, as well as the duration of the interval between one hospitalization and the next. For each hospitalization, the disease state observed and
the covariates of interest can be traced. However. the disease state may be affected by an unknown degree of error, due both to an imperfect diagnosis and to incor-rect classification. Moreover, due to the irregular nature of follow-up, observations of the actual time of entry into a disease state are frequently interval censored. The proposed Markov model allows us to take into account the above characteristics.
In a sample of n subjects, for the ith subject we
assume that the following variables are observed at the
jth visit:
Tijchronological time of clinical visit Yijbinary disease outcome measurement Zijvector of covariates.
The observed disease outcome measures Yij are
sub-ject to error. The actual underlying disease status is assumed to be a process evolving in continuous time and is denoted (X(t), t > 0). This process is unobserved or ‘hidden’, and will be modeled as a continuous time two-state Markov process, where the states are inter-preted as the presence or absence of the disease mani-festation. Let Y1jand T1jdenote the sequence from 1 to jof observed disease states and observation times for an individuali. The Markov assumption for the hidden dis-ease process is given by
P[X(tj)|X(t1), X(t2), . . ., X(tj−1), Yj1−1, T j 1= t
j 1] =
P[X(tj)|X(tj−1), Y1j−1, T j 1= t
j
1] = Pxj−1, xj(tj−tj−1)
(1)
where the quantity Pxj-1, xjdenotes the probability of transition to occupy state x at time Tj= tjgiven that the process was in state xj-1 at tj-1and that the transition probabilities are assumed to be stationary. We also assume that, conditional on the state of the hidden pro-cess at time tj, an observation Yj is independent of all previous observations and the hidden process prior to time tj:
P[Yj|X(t1),. . ., X(tj), Y1j−1, T1j= t1j] = P[Yj|X(tj), Tj= tj] = f(yj|xj) (2)
When Y is binary, f(y|x) can be interpreted as the probability of correctly or incorrectly classifying the dis-ease state given the true state of the subject. The condi-tional independence of misclassification probabilities at successive time points is a strong assumption. However, dependence between successive measurements is con-founded with dependence between the true disease states. It is not possible to disentangle these two features of the model with misclassified data [13].
Equations (1) and (2) constitute a hidden Markov model.
If the disease status is observed accurately, then X(Tj)
and Yj coincide, and the model is reduced to a pure
At any time t and for each pair of states r and s, the transition from one state to the next and the time when this transition occurs are regulated by the transition intensity qrs. The transition intensity qrsrepresents the instantaneous risk of moving from state r to state s:
qrs= limδt→0P(S(t+δt)=s|S(t)=r)/δt (3)
The intensities form a matrix Q whose rows sum to zero, so that the diagonal entries are defined by qrr=−s=rqrs.
On the basis of the available data it is necessary to estimate the matrix Q of transition intensity according to the method described by Kalbfleisch and Lawless [14], and Kay [15]. In addition, at each level of the model explicative variables can be included and it is possible to use a proportional hazards model to relate transition intensities qrs(t) to time t with the covariates z(t),
qrs{t, z(t)}=qrsexp{βrsTz(t)} (4)
The new matrix of the transition probabilities P(t), that takes into account any necessary covariates, can be calculated by taking the matrix exponential of the scaled transition intensity matrix (see, for example, Cox and Miller [16]):
P(t) = Exp(tQ) (5)
The hazards proportionality can be verified using the Schoenfeld residuals of the model [17,18], defined as the valuexik of the covariate K for individualiwho actually
died at time ti minus the expected value, where the
expected value is given by j∈R(ti)
i=1 xkipiand pi is the
probability of death of individualiat time ti. The graph, that represents the trend of the Schoenfeld residuals cal-culated for each individual and each covariate, can be used to directly visualize the hazards ratio [17]. Assum-ing proportionality of the hazards, the Schoenfeld resi-duals are independent of time. The presence of a linear relationship with time, an index of non proportionality, can be tested by performing a simple linear regression and a trend test: a slope significantly different from zero would be evidence against proportionality and an increasing (decreasing) trend would indicate an increas-ing (decreasincreas-ing) hazards ratio over time.
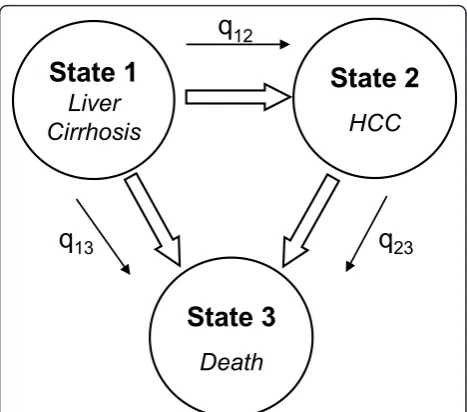
In our model the estimation of the parameters was obtained using the maximum likelihood method (MLE), and assuming that the chance variables are independent and normally distributed. We considered a two-state disease model: cirrhosis and hepatocellular carcinoma and the absorbent state, death, that is irreversible (Figure 1). State 1 is that of patients with a diagnosis of liver cirrhosis (codes ICD9cm 571.2 and 571.5); State 2
is that of patients with a diagnosis of hepatocellular car-cinoma (codes ICD9cm 155.0 and 155.2), regardless of the concomitant presence of a diagnosis of cirrhosis; State 3, absorbent, is that of deceased subjects. The few cases of patients who underwent liver surgery, including transplant, were excluded (codes ICD9cm for proce-dures 50.21÷50.99). Supposing, therefore, that progres-sion of cirrhosis to HCC is an irreversible procedure, but in any case taking into account the possibility of misclassification between the first and second state and vice versa, we estimated the following transition intensi-ties (Q) and misclassification (E) matrices:
Q= ⎛
⎝−(q120+q13)−qq1223qq1323
0 0 0
⎞
⎠ E=
⎛
⎝1−e21e121e−12e2100
0 0 0
⎞ ⎠
The covariates inserted in the model were age, sex, the presence of disease correlated to alcohol abuse, the pre-sence of diagnostic codes correlated to hepatitis C virus infection and the Charlson Index assessing the subject’s clinical severity.
The Charlson index, developed in 1987 [19] and adapted to health data banks by Deyo et al. [20], is based on ICD9-CM diagnosis codes and contains 17 categories of comorbidity, each with an associated weight ranging from 1 to 6; the sum of all the weights gives the value of the index that, being determined in this way, takes into account both the number of comor-bidities and their severity. The Charlson Index was divided into 2 classes: less than or equal to 3, greater than 3, as also was age: less than or equal to 65 years, older than 65 years. We selected 65 as the age cut-off because this is considered in the literature to be the
State 1
Liver
Cirrhosis
State 2
HCC
State 3
Death
q
12q
23q
13mean age for development of liver cancer [21,22] and also because it corresponded to the median value of the observed distribution of cases of HCC, guaranteeing the stability of the model.
The analysis was conducting using the electronic Hospital Discharge Sheet coming from all the Apulia hospitals for the years 2000-2006, and Death Certificate DataBase related to all deaths events in Apulia for the years 2000-2006. From both databases were selected cases with the following ICD-9-CM (International Statis-tical Classification of Diseases and Related Health Pro-blems 9threvision Clinical Modification) as principal or secondary diagnosis:
Liver cirrhosis (LC): 571.2; 571.5
Hepatocellular carcinoma (HCC): 155.0; 155.2.
To establish the starting point of the first state, defined as of the first hospitalization with LC diagnosis, were selected patients in whom the onset of cirrhosis presumably occurred between 01/01/2000 and 31/12/ 2000. For this purpose, we eliminated patients who had been hospitalized at least once for cirrhosis or hepato-cellular carcinoma in the years 1998 and 1999. After identification the clinical course of the selected cirrhotic patients was reconstructed searching others hospitaliza-tions with diagnosis of LC or HCC in HDS databases, or death correlated with LC or HCC in HDS and DCDB databases.
Results
In total, 1925 patients were identified who had a pre-sumed onset of cirrhosis in 2000 and had undergone at least one transition of state by 31/12/2006 (Table 1). In 33 patients, after a hospital admission for hepatocellular carcinoma, a subsequent hospitalization occurred with a diagnosis of only cirrhosis despite not having undergone surgery. These subjects were considered to have been misclassified. Table 2 shows the frequency of the covari-ates considered in the model. Estimcovari-ates of the mean time of persistence in each state, calculated according to the procedure established by Jackson et al. [12,23], are reported in Table 3. We calculated the times of persis-tence also for the different levels of the covariates. The shortest time of persistence in state 1 (months = 24.99; CI =18.35-34.04) was observed in male subjects aged > 65 years, with a Charlson Index > 3 and free from
diseases correlated to alcohol abuse or hepatitis C virus. The longest estimated time (months = 178.92; CI = 151.13-211.82) was observed in female subjects aged
≤ 65 years, with a Charlson Index≤ 3, the presence of disease correlated to alcohol abuse and absence of hepa-titis C virus infection. The shortest time of persistence in state 2 (months = 15.63; CI = 1.95-125.38) was demonstrated in male subjects aged > 65 years, with a Charlson Index > 3 and the presence of diseases corre-lated to alcohol abuse and hepatitis C virus infection, whereas the longest estimated time (months = 48.91; CI = 37.99-62.97) was found in male patients aged≤65
years, with a Charlson Index ≤3, and absence of
dis-eases correlated either to alcohol abuse or hepatitis C virus infection. For each covariate, the proportionality of hazards was verified using the Schoenfeld residuals method (Table 4). The overall test shows strong evi-dence of the proportionality of hazards and all the vari-ables contribute to this proportionality.
The parameters estimated for the hidden Markov model are reported in Table 5. The estimated intensity matrix demonstrates that cirrhotic patients have twice the probability (0.0151/0.0071) of developing a liver cancer than of dying without developing a tumour. Moreover, the probability of death is four-fold higher in a subject with a liver cancer than in a subject with only cirrhosis (0.0284/0.0071).
The estimated odds ratios are reported in Table 6. Figure 2 shows the trend over time of the estimated probabilities of transition in cirrhotic subjects free from
Table 1 Summary of the number of transitions of state in the data set
From: To: Lost to Follow-up Total
State 1 State 2 State 3
State 1 922 393 610 - 1925
State 2 33* 124 154 82 393
*Patients certainly misclassified.
Table 2 Frequency of the covariates at the start of follow-up.
Covariate N. patients
(% of 1925 cirrhotic patients)
Sex (Male) 1107 (57,51%)
Age (>65 years) 1027 (53,35%)
Charlson Index (>3) 142 (7,38%)
Hepatitis B Virus (070.20, 070.33)
1 (0,05%)
Hepatitis C Virus
(070.41, 070.44, 070.51, 070.54)
49 (2,55%)
Alcohol-correlated disease (291.-, 303.0-, 303.9-, 305.0-, 357.5, 425.5, 535.3-, 790.3)
61 (3,17%)
Table 3 Estimates of the mean permanency times in the transitory states
State 1 State 2
Estimate (months) 44.93 35.19
St. Error 2.47 2.97
Lower limit 40.33 50.05
comorbidities correlated to alcohol abuse or HCV infec-tion. The probabilities of transition in Figures 2a and 2c are referred to cirrhotic subjects, male and female, aged 65 years or younger and with a Charlson Index of 3 or less.
The probabilities of transition from one state to the next are generally higher in males; in particular, the probability of progressing to HCC is never higher than 15.7% in females, whereas it reaches 30% in males after 4 years. In the first 40 months after the onset of liver cirrhosis, the probability of developing hepatocellular carcinoma is greater than the probability of death in males: 15.7% versus 6.8% after one year, 24.5% versus 15.5% after two years. In females, instead, the probability of death is little lower than that of developing HCC in the first few months, while already after two years the probability of death is higher (13.4% versus 11.8%).
In Figures 2b and 2d the transition probabilities are referred to males and females, respectively, with a more severe casemix (age > 65 years and Charlson Index >3).
The male-female differences in the probabilities of transition from cirrhosis to death grow over the first
3 years (being 10% at 36 months) but remain constant thereafter. The probability of developing HCC in the short term is higher in males than females (after 2 years, it is 25.8% in males versus 13.2% in females), but the values tend to converge in the longer term (6.3% in males versus 5.5% in females after 7 years).
The probabilities of death, both for subjects with only cirrhosis and with HCC, are generally higher than in subjects with a less severe casemix. In females the case-mix does not seem to affect the probability of transition cirrhosis-HCC, whereas in males the more severe case-mix has a long term effect when the probability of developing HCC declines in favor of a greater probabil-ity of death.
Discussion
By exploiting the properties of Markov chains applied to a stochastic multistate model, we have calculated the temporal intensities of transition during the degenera-tive course of chronic liver cirrhosis. It was also possible to determine the time hazards of degeneration of the liver disease until death. Various studies have employed Cox models with the principal aim of determining the risk factors for the progression of cirrhosis to HCC [24,25]. In 2000, Degos et al. [26] studied progression to
HCC and death using an “illness-disease-death” in a
small cohort of subjects with a diagnosis of HCV-related cirrhosis, estimating the time of the events with the Kaplan Meier method. Then, in 2007 Ioannou et al. [27] applied the Cox proportional hazards model to a large administrative database of cirrhotic patients to deter-mine the incidence of hepatocellular carcinoma, but without calculating the probabilities of transition from
Table 4 Proportionality Test based on Schoenfeld’s
residuals
Variable p-value
Sex 0.316
Age class 0.567
Hepatitis C 0.749
Alcohol 0.288
Charlson Index 0.468
Overall 0.729
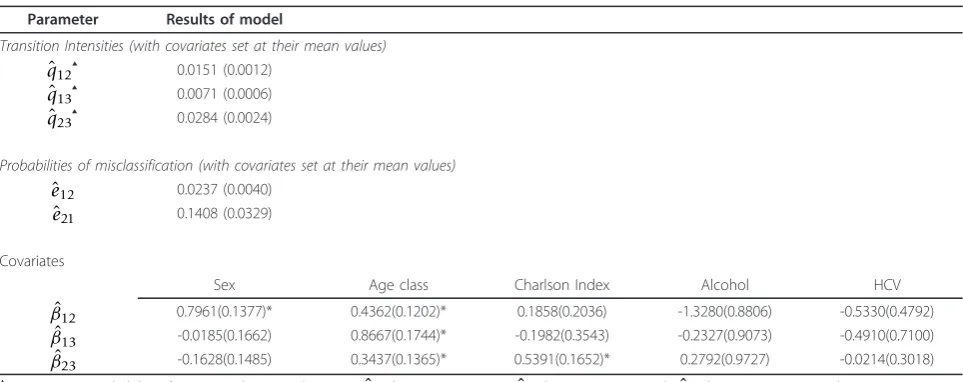
Table 5 Parameters and standard errors estimated with the hidden Markov model
Parameter Results of model
Transition Intensities (with covariates set at their mean values) ˆ
q12▲ 0.0151 (0.0012) ˆ
q13▲ 0.0071 (0.0006) ˆ
q23▲ 0.0284 (0.0024)
Probabilities of misclassification (with covariates set at their mean values) ˆ
e12 0.0237 (0.0040)
ˆ
e21 0.1408 (0.0329)
Covariates
Sex Age class Charlson Index Alcohol HCV
ˆ
β12 0.7961(0.1377)* 0.4362(0.1202)* 0.1858(0.2036) -1.3280(0.8806) -0.5330(0.4792) ˆ
β13 -0.0185(0.1662) 0.8667(0.1744)* -0.1982(0.3543) -0.2327(0.9073) -0.4910(0.7100) ˆ
β23 -0.1628(0.1485) 0.3437(0.1365)* 0.5391(0.1652)* 0.2792(0.9727) -0.0214(0.3018)
▲Instantaneous probability of transitions between the states (ˆ
q12between LC to HCC;q13ˆ between LC to Death;q23ˆ between HCC to Death) * Significant at alpha = 0.05.
the first to the second state. Moreover, they acknowl-edged that a limit of their study was the risk of error when filling out the diagnosis codes ICD-9. In our study, using the data contained in the administrative health services databases, the multistate hidden Markov
model we applied enabled us to identify the possible misclassification errors that can occur.
Previous studies based on surveillance programs for hepatocellular carcinoma in cirrhotic subjects reported an incidence of hepatocellular carcinoma of 1.5 [28],
Table 6 Estimated Odds Ratios for the covariates inserted in the hidden Markov model (95% confidence intervals in brackets)
Transitions of State
Covariate State 1 -> State 2 State 1 -> State 3 State 2 -> State 3
Sex (Ref.: female)
2.2168(1.6923-2.9083) 0.9816(0.7087-1.3596) 0.8497(0.6351-1.1369)
Age class (Ref.: Aged≤65)
1.5469(1.2221-1.9581) 2.3791(1.6905-3.3482) 1.4102(1.0791-1.8429)
Hepatitis C (Ref.: no HCV)
0.5868(0.2294-1.5011) 0.6120(0.1522-2.4612) 0.9787(0.5417-1.7685)
Alcohol abuse (Ref.: no alcohol)
0.2649(0.0471-1.4884) 0.7923(0.1338-4.6909) 1.3221(0.1965-8.8968)
Charlson Index (Ref. Charls. Ind.≤3)
1.2041(0.8078-1.7948) 0.8202(0.4095-1.6429) 1.7144(1.2402-2.3700)
b) Male, aged > 65 years, Charlson Index > 3
d) Female, aged > 65 years, Charlson Index> 3
a) Male, aged ≤ 65 years, CharlsonIndex ≤ 3
c) Female, aged ≤ 65 years, CharlsonIndex ≤ 3
0 0,1 0,2 0,3 0,4 0,5 0,6 0,7 0,8 0,9 1
1 5 9 13 17 21 25 29 33 37 41 45 49 53 57 61 65 69 73 77 81 85 month
p12 p13 p23
0 0,1 0,2 0,3 0,4 0,5 0,6 0,7 0,8 0,9 1
1 5 9 13 17 21 25 29 33 37 41 45 49 53 57 61 65 69 73 77 81 85 month
p12 p13 p23
0 0,1 0,2 0,3 0,4 0,5 0,6 0,7 0,8 0,9 1
1 5 9 13 17 21 25 29 33 37 41 45 49 53 57 61 65 69 73 77 81 85 month
p12 p13 p23
0 0,1 0,2 0,3 0,4 0,5 0,6 0,7 0,8 0,9 1
1 5 9 13 17 21 25 29 33 37 41 45 49 53 57 61 65 69 73 77 81 85 month
p12 p13 p23
2.5 [29], 6.7 [30] per 100 subjects a year. In our study we found an incidence of HCC of 1.5% per year. Ioan-nou et al. (2007) [27], who conducted their analysis on an administrative database as we have done, found an incidence of 2.4% per year. The difference between these two values (1.5% vs 2.4%) is probably due to the different reference population, but also to insertion in our model of the misclassification matrix. In fact, the probability of misclassifying subjects with HCC as sub-jects with cirrhosis alone was revealed to be 14.08%, while the reverse error, i.e. misclassifying cirrhotic sub-jects as affected by HCC, was 2.73%.
The estimated parameters for the covariate“age class” were statistically significant for all the transitions.“Sex” was significant only for the transition of state from cir-rhosis to HCC, while the Charlson Index had an effect only on the transition from HCC to death.
In various longitudinal studies it has been shown that advanced age and the male sex are associated with an increased risk of HCC in cirrhotic subjects [24,31-33], as was also shown in the present study. In fact, male cir-rhotic subjects have approximately twice the probability of developing hepatocellular carcinoma as compared to female cirrhotic patients, while elderly patients (aged ≥ 65 years) have a higher risk of degeneration of the liver disease, and especially of dying while affected by cirrhosis.
The ample presence of concomitant diseases (Charl-son Index ≥ 3) increases the risk of death in subjects with HCC. The Charlson Index was not found to have an incidence on the transition from cirrhosis to HCC. The insertion of specific comorbidities among the model covariates, such as diabetes mellitus [27,34,35], could help to identify the co-morbid conditions that may become risk factors for progression to HCC in cir-rhotic subjects.
Alcohol is proposed to cause HCC mainly because it causes cirrhosis, whereas its association with HCC with-out cirrhosis is controversial and it probably has no direct carcinogenic role [36]. In a case-control study conducted in 2007, Kumar et al. [37] showed that although HCV RNA positivity and alcohol abuse signifi-cantly increased the risk of hepatocellular carcinoma among cirrhotic patients, no significant risk increase was evident in the absence of cirrhosis. In our study the estimates of the parameters related to hepatitis C virus and to the presence of morbidity correlated to alcohol abuse did not result significant. This result likely con-firms that hepatitis C virus and alcohol abuse are risk factors for the onset of cirrhosis [38], but once the cir-rhosis has become established they do not have an influ-ence on the development of HCC.
Despite the advantages of the structured hidden Mar-kov model approach, there are some limitations. As is
typical of population dynamic models, collinearity between parameter estimates can lead to identifiability problems [39]. As a consequence, maximum likelihood estimates can sometimes yield implausible parameter values, and maximization algorithms may fail to converge [40]. The problem becomes particularly severe when time series are short and data scarce. Moreover, addition to the model of further covariates could exacerbate this problem. However, it seems likely that such problems with the proposed structured hidden Markov models might be overcome by adopting a Bayesian formulation.
Conclusion
Markov model proved to be a useful tool for analysis of the course of a chronic degenerative disease like liver cirrhosis. In particular, the hidden Markov model that takes into account the risk of misclassification is well suited to the analysis of administrative health data because it can capture bias due to the problem that the data quality is not always optimal, as well as enabling the study of the effect of different covariates on the transitions of state.
A further improvement of the model could be that of predicting the state of subjects who have undergone sur-gery and appear cured or temporarily HCC-free. In our case, due to the paucity of such observations, it was not possible to consider a model like this.
Authors’contributions
NB conceived the study, conducted the analysis, wrote the manuscript. PT conceived the study, collaborated in the analysis, drafted the manuscript. GS supervised the analysis and reviewed the manuscript. All authors read and approved the final manuscript.
Competing interests
The authors declare that they have no competing interests.
Received: 26 November 2010 Accepted: 4 April 2011 Published: 4 April 2011
References
1. Di Bisceglie AM:Hepatitis C and hepatocellular carcinoma.Hepatology 1997,26(3 suppl 1):34S-38S.
2. Fattovich G, Stroffolini T, Zagni I, Donato F:Hepatocellular carcinoma in cirrhosis: incidence and risk factors.Gastroenterology2004,127:S35-S50. 3. Putter H, Fiocco M, Geskus RB:Tutorial in biostatistics: competing risks
and multi-state models.Statistics in Medicine2007,26:2389-2430. 4. Serio G, Morabito A:Considerations on a staging process for chronic
diseases.Rivista di Statistica Applicata1988,21(23):335-348.
5. Serio G, Morabito A:Stochastic survival model with covariates in cancer. Modelling of Biomedical Systems1986, 91-96.
6. Chen HH, Duffy SW, Tabar L:A Markov chain method to estimate the tumour progression rate from preclinical to clinical phase, sensitivity and positive predictive value for mammography in breast cancer screening.The Statistician1996,45(3):307-317.
7. Jackson CH, Sharples LD:Hidden Markov models for the onset and progression of bronchiolitis obliterans syndrome in lung transplant recipients.Statistics in Medicine2002,21:113-128.
9. MacDonald IL, Zucchini W:Hidden Markov Models and Other Models for Discrete-valued Time Series.Chapman and Hall: New York; 1997. 10. Scheike TH, Zhang M:Direct Modelling of Regression Effects for
Transition Probabilities in Multistate Models.Scandinavian Journal of Statistics2007,34:17-32.
11. Cox D:Regression Models and Life-Tables.Journal of the Royal Statistical Society, Series B1972,34:187-220.
12. Jackson CH, Sharples LD, Thompson SG, Duffy SW, Couto E:Multistate Markov models for disease progression with classification error.Journal of the Royal Statistical Society, Series D - The Statistician2003,52(2):193-209. 13. Bureau A, Shiboski S, Hughes JP:Applications of continuous time hidden Markov models to the study of misclassified disease outcomes.Statistics in Medicine2003,22:441-462.
14. Kalbfleisch JD, Lawless JF:The analysis of panel data under a Markov assumption.Journal of the American Statistical Association1985, 80(392):863-871.
15. Kay R:A Markov model for analysing cancer markers and disease states in survival studies.Biometrics1986,42:855-865.
16. Cox DR, Miller HD:The Theory of Stochastic Processes.Chapman and Hall, London; 1965.
17. Grambsch P, Therneau T:Proportional Hazards Tests and Diagnostics Based on Weighted Residuals.Biometrika1994,81:515-26.
18. Schoenfeld D:Chi-squared goodness of fit test for the proportional hazards regression model.Biometrika1981,67:147-53.
19. Charlson ME, Pompei P, Ales KL, MacKenzie CR:A new method of classifying prognostic comorbidity in longitudinal studies: development and validation.J Chron Dis1987,40:373-383.
20. Deyo RA, Cherkin DC, Ciol MA:Adapting a clinical comorbidity index for use with ICD-9- CM administrative databases.J Clin Epidemiol1992, 45:613-619.
21. Ryder SD:Guidelines for the diagnosis and treatment of hepatocellular carcinoma (HCC) in adults.Gut2003,52(Suppl. III):iii1-8.
22. Hepatic Carcinoma, Primary Author: Keith E Stuart, MD, Chairman, Department of Hematology and Oncology, Lahey Clinic Coauthor(s): Zsofia K Stadler, MD. [http://emedicine.medscape.com/article/282814-overview].
23. Duffy SW, Chen HH:Estimation of mean sojourn time in breast cancer screening using a Markov chain model of entry to and exit from preclinical detectable phase.Statistics in Medicine1995,14:1531-1543. 24. Zaman SN, Melia WM, Johnson RD, Portmann BC, Johnson PJ, Williams R:
Risk factors in development of hepatocellular carcinoma in cirrhosis: prospective study of 613 patients.Lancet1985,1:1357-60.
25. Sarbah SA, Gramlich T, Younoszai A,et al:Risk factors for hepatocellular carcinoma in patients with cirrhosis.Dig Dis Sci2004,49:850-853. 26. Degos F, Christidis C, Ganne-Carrie N, Farmachidi JP, Degott C, Guettier C,
Trinchet JC, Beaugrand M, Chevret S:Hepatitis C virus related cirrhosis: time to occurrence of hepatocellular carcinoma and death.Gut2000, 47:131-136.
27. Ioannou GN, Splan MF, Weiss NS, McDonald GB, Beretta L, Lee SP: Incidence and predictors of hepatocellular carcinoma in patients with cirrhosis.Clin Gastroenterol Hepatol2007,5:938-945, 945.e1-945.e4. 28. Fattovich G, Giustina G, Degos F,et al:Morbidity and mortality in
compensated cirrhosis type C: a retrospective follow-up study of 384 patients.Gastroenterology1997,112:463-472.
29. Colombo M, de Franchis R, Del Ninno E,et al:Hepatocellular carcinoma in Italian patients with cirrhosis.N Engl J Med1991,325:675-680.
30. N’Kontchou G, Paries J, Htar MT,et al:Risk factors for hepatocellular carcinoma in patients with alcoholic or viral C cirrhosis.Clin Gastroenterol Hepatol2006,4:1062-1068.
31. Sangiovanni A, Del Ninno E, Fasani P, De Fazio C, Ronchi G, Romeo R, Morabito A, de Franchis R, Colombo M:Increased survival of cirrhotic patients with a hepatocellular carcinoma detected during surveillance. Gastroenterology2004,126:1005-1014.
32. Benvegnù L, Chemello L, Noventa F, Fattovich G, Pontisso P, Alberti A: Retrospective analysis of the effect of interferon therapy on the clinical outcome of patients with viral cirrhosis.Cancer1998,83:901-909. 33. Bolondi L, Sofia S, Siringo S, Gaiani S, Casali A, Zironi G, Piscaglia F,
Gramantieri L, Zanetti M, Sherman M:Surveillance programme of cirrhotic patients for early diagnosis and treatment of hepatocellular carcinoma: a cost effectiveness analysis.Gut2001,48:251-259.
34. La Vecchia C, Negri E, Decarli A,et al:Diabetes mellitus and the risk of primary liver cancer.Int J Cancer1997,73:204-207.
35. El-Serag HB, Tran T, Everhart JE:Diabetes increases the risk of chronic liver disease and hepatocellular carcinoma.Gastroenterology2004, 126:460-468.
36. London WT, McGlynn KA:Liver cancer.InCancer Epidemiology and Prevention.Edited by: Schottenfeld D, Fraumeni JF Jr. New York: Oxford University Press; 1996:772-93.
37. Kumar M, Kumar R, Hissar SS, Saraswat MK, Sharma BC, Sakhuja P, Sarin SK: Risk factors analysis for hepatocellular carcinoma in patients with and without cirrhosis: a case -control study of 213 hepatocellular carcinoma patients from India.J Gastroenterol Hepatol2007,22(7):1104-11. 38. Pradat P, Voirin N, Tillmann HL, Chevallier M, Trepo C:Progression to
cirrhosis in hepatitis C patients: an age-dependent process.Liver Int2007, 27(3):335-339.
39. Brookhart MA, Hubbard AE, Van Der Laan MJ, Colford JM Jr, Eisenberg JN: Statistical estimation of parameters in a disease transmission model: analysis of a Cryptosporidium outbreak.Statistics in Medicine2002, 21:3627-38.
40. Cooper B, Lipsitch M:The analysis of hospital infection data using hidden Markov models.Biostatistics2004,5(2):223-237.
Pre-publication history
The pre-publication history for this paper can be accessed here: http://www.biomedcentral.com/1471-2288/11/38/prepub
doi:10.1186/1471-2288-11-38
Cite this article as:Bartolomeoet al.:Progression of liver cirrhosis to HCC: an application of hidden Markov model.BMC Medical Research
Methodology201111:38.
Submit your next manuscript to BioMed Central and take full advantage of:
• Convenient online submission
• Thorough peer review
• No space constraints or color figure charges
• Immediate publication on acceptance
• Inclusion in PubMed, CAS, Scopus and Google Scholar
• Research which is freely available for redistribution