R E V I E W A R T I C L E
Open Access
Public health risks related to food safety
issues in the food market: a systematic
literature review
Zemichael Gizaw
Abstract
Background:
Food safety in the food market is one of the key areas of focus in public health, because it affects
people of every age, race, gender, and income level around the world. The local and international food marketing
continues to have significant impacts on food safety and health of the public. Food supply chains now cross
multiple national borders which increase the internationalization of health risks. This systematic review of literature
was, therefore, conducted to identify common public health risks related to food safety issues in the food market.
Methods:
All published and unpublished quantitative, qualitative, and mixed method studies were searched from
electronic databases using a three step searching. Analytical framework was developed using the PICo (population,
phenomena of interest, and context) method. The methodological quality of the included studies was assessed
using mixed methods appraisal tool (MMAT) version 2018. The included full-text articles were qualitatively analyzed
using emergent thematic analysis approach to identify key concepts and coded them into related non-mutually
exclusive themes. We then synthesized each theme by comparing the discussion and conclusion of the included
articles. Emergent themes were identified based on meticulous and systematic reading. Coding and interpreting
the data were refined during analysis.
Results:
The analysis of 81 full-text articles resulted in seven common public health risks related with food safety in
the food market. Microbial contamination of foods, chemical contamination of foods, food adulteration, misuse of
food additives, mislabeling, genetically modified foods (GM foods), and outdated foods or foods past their use-by
dates were the identified food safety
–
related public health risks in the food market.
Conclusion:
This systematic literature review identified common food safety
–
related public health risks in the food
market. The results imply that the local and international food marketing continues to have significant impacts on
health of the public. The food market increases internationalization of health risks as the food supply chains cross
multiple national borders. Therefore, effective national risk-based food control systems are essential to protect the
health and safety of the public. Countries need also assure the safety and quality of their foods entering
international trade and ensure that imported foods conform to national requirements.
Keywords:
Public health risks, Public health hazards, Public health problems, Food safety, Food quality, Food
hygiene, Food marketing
© The Author(s). 2019Open AccessThis article is distributed under the terms of the Creative Commons Attribution 4.0 International License (http://creativecommons.org/licenses/by/4.0/), which permits unrestricted use, distribution, and reproduction in any medium, provided you give appropriate credit to the original author(s) and the source, provide a link to the Creative Commons license, and indicate if changes were made. The Creative Commons Public Domain Dedication waiver (http://creativecommons.org/publicdomain/zero/1.0/) applies to the data made available in this article, unless otherwise stated. Correspondence:zemichael12@gmail.com
Background
Food safety is an important issue that affects all of the
world
’
s people. Many countries throughout the world
are increasingly interdependent on the availability of
their food supply and on its safety. Hence, people all
over the world increasingly value food safety; food
pro-duction should be done safely to maximize public health
gains and environmental benefits. Food safety deals with
safeguarding the food supply chain from the
introduc-tion, growth, or survival of hazardous microbial and
chemical agents [1,
2].
Unsafe food containing harmful bacteria, viruses,
para-sites, or chemical substances causes more than 200
dis-eases
—
ranging from diarrhea to cancers. An estimated
600 million in the world fall ill after eating contaminated
food and 420,000 die every year, resulting in the loss of
33 million disability adjusted life years (DALYs).
Chil-dren under 5 years of age carry 40% of the food borne
disease burden, with 125,000 deaths every year.
Diar-rheal diseases are the most common illnesses resulting
from the consumption of contaminated food, causing
550 million people to fall ill and 230,000 deaths every
year [3].
Food safety is being challenged nowadays by the global
dimensions of food supply chains [1,
4,
5]. Foods in the
international market may be frauded as different parties
such as manufacturers, co-packers, distributors, and
others along the chain of distribution involve in the
na-tional or internana-tional trade [6
–
8]. Food safety in the
food market is one of the key areas of focus in public
health, because it affects people of every age, race,
gen-der, and income level around the world. The local and
international food marketing continues to have
signifi-cant impacts on food safety and health of the public.
Food supply chains now cross multiple national borders
which increase the internationalization of health risks
[9
–
14]. This systematic review of literature was,
there-fore, conducted to identify common public health risks
related to food safety issues in the food market. This
re-view provides evidence to improve food safety in the
food market using risk-based food safety strategies.
Healthcare providers, researchers, and policy makers
may use the results of this systematic literature review to
protect the public from undue health effects due to
con-sumption of foods with poor quality and safety.
Methods
Research question
What food safety
–
related public health risks are
com-monly found in the food market?
Analytical framework
We developed the components of the analytical
frame-work using the PICo (population, phenomena of interest,
and context) method. The population for this review
was the public over the globe. The phenomenon of
interest for this review was public health risks associated
with food safety. The context was the food market (such
as restaurants, food stores, supermarkets, shops, food
processing plants, and street vending). The reviewers sat
together to discuss and refine the framework.
Criteria for considering studies for this review
All published and unpublished quantitative, qualitative,
and mixed method studies conducted on food safety
–
re-lated health risks for the general public in the food market
were included. Governmental and other organizational
re-ports were also included. Articles published other than
English language, citations with no abstracts and/or full
texts, duplicate studies, and studies with poor quality were
excluded.
Search strategy
We searched published articles/or reports from
MED-LINE/ PubMed, EMBASE, CINAHL, Access Medicine,
Scopus, Web of Science, Google Scholar, WHO Library,
FAO Libraries, and WTO Library. We also searched
the-sis and dissertations from Worldcat and ProQuest. We
used a three step searching. In the first step, we
con-ducted an initial limited search of MEDLINE and
ana-lyzed the text words contained in the title and abstract,
and of the index terms used to describe articles.
Sec-ondly, we searched across all included databases using
all identified keywords and index terms. Thirdly,
refer-ences of all identified articles were searched to get
add-itional studies. The search term we used in the initial
searching is presented as follows.
Assessment of methodological quality
Search results from different electronic databases were
exported to Endnote reference manager to remove
du-plication. Two independent reviewers (ZG and BA)
screened out articles using titles and abstracts. The
re-viewers further investigated and assessed full-text articles
against the inclusion and exclusion criteria. The
re-viewers sat together to resolve disagreements during the
review. The methodological quality of the included
stud-ies was assessed using mixed methods appraisal tool
(MMAT) version 2018 [15]. This method explains the
detail of each criterion. The rating of each criterion was,
therefore, done as per the detail explanations included in
the method. Almost all of the included full-text articles
fulfilled the criteria and all the included full-text articles
were found to be better quality.
Data extraction
In order to minimize bias, we the reviewers
independ-ently extracted data from papers included in the review
using JBI mixed methods data extraction form [16]. The
data extraction form was piloted on randomly selected
papers and modified accordingly. Eligibility assessment
was performed independently by the two reviewers.
In-formation like authors, year of publication, study areas,
type of studies, and focus of the study or main messages
were extracted.
Synthesis of findings
The included full-text articles were qualitatively analyzed
using emergent thematic analysis approach to identify
key concepts and coded them into related non-mutually
exclusive themes. We then synthesized each theme by
comparing the discussion and conclusion of the included
articles. Emergent themes were identified based on
me-ticulous and systematic reading. Coding and interpreting
the data were refined during the analysis.
Results
The search process
The search strategy identified 2641 titles and abstracts
(1890 from PubMed and 751 from other sources) as of
13 June 2019. We obtained 1992 title and abstracts after
we removed duplicates. Following assessment by title
and abstract, 705 articles were retrieved for more
evalu-ation and 344 articles were assessed for eligibility.
Fi-nally, 81 articles were included for systematic literature
review based on the inclusion criteria (Fig.
1).
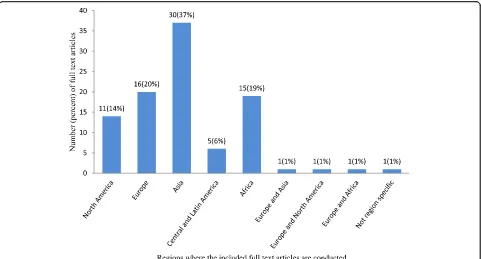
In this review, 81 of 1992 (4%) full-text articles
matched the inclusion criteria. The overwhelming
ma-jority, 74 of 81 (91%) of the included full-text articles are
research articles; 2 (3%) are short communications; 2
(3%) are regulatory papers, 1 (1%) is field inspection; 1
(1%) is research note; and the other 1 (1%) is thesis. Of
the included full-text articles, 30 of 81 (37%) are
con-ducted in Asia; 4 of 81 (5%) are concon-ducted in multiple
countries in the same region or across regions; and 1of
81 (1%) is not region specific (Fig.
2).
All the included full-text articles are published
be-tween 1991 and 2018 (35 (43%) bebe-tween 2011 and 2015;
16 (20%) between 2000 and 2005; 16 (20%) between
2006 and 2010; 12 (15%) between 2016 and 2018; and
the rest 2(2%) before 2000).
Food safety
–
related public health risks identified from
the search process
The analysis of 81 full-text articles resulted in seven
common public health risks related with food safety in
the food market. Microbial contamination of foods,
chemical contamination of foods, food adulteration,
mis-use of food additives, mislabeling, GM foods, and foods
past their use-by dates were the identified food safety
–
related health risks in the food market (Table
1).
Table
2
shows food safety
–
related public health risks
in the food market by country name (countries are
cate-gorized into developed and developing based on the
United Nations (UN) 2019 list). Among 21 full-text
arti-cles included for microbial contamination of foods, 13
(62%) were from developing countries. This may suggest
microbial contamination of foods in the food market is a
common public health risk in developing countries than
the developed. Eight (53%) of 15 articles retrieved for
chemical contamination of foods in the food market
were from developing countries. The vast majority, 8 of
9 (89%) full-text articles retrieved for food adulteration
were from developing countries, which may indicate
adulteration of foods is practiced more of in developing
countries. Similarly, 8 of 11 (73%) of the full-text articles
included for misuse of food additives were from
develop-ing countries, which may show misuse of food additives
is a common problem in developing countries. For
mis-labeling, 14 of 17 (82%) and 8 of 17 (47%) of the full-text
articles were from developed and developing countries
respectively. Four out of six (67%) of full-text articles
re-trieved for foods past use-by dates were from developing
countries. This may show selling of outdated foods is
common in developing countries than the developed.
of additives (16%), and mislabeling (16%) are the
com-monest food safety issues in the food market.
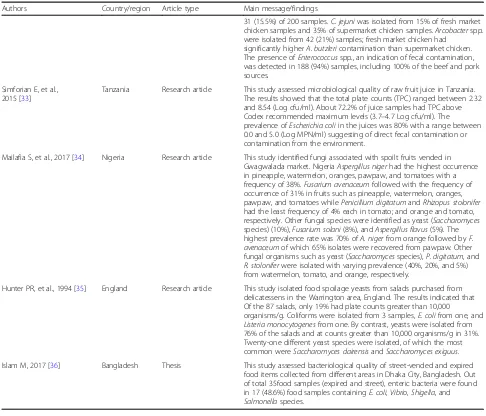
Microbial contamination of foods
In this review, 21 of 81 (26%) full-text articles reported the
presence of pathogenic microorganisms in different food
items in the food market. These studies identified different
diseases causing bacteria mainly
Salmonella
spp.,
Escheri-chia coli
,
Klebsiella
spp.,
Shigella
spp.,
Enterobacter
spp.,
Proteus
spp.,
Citrobacter
spp.
Staphylococcus aureus
,
Cam-pylobacter spp.,
Listeria
spp.,
Vibrio
,
Alklegens
spp.,
Bacillus
cereus
, Pseudomonas spp.,
Clostridium perfringens
,
Arcobac-ter spp., and
Enterococcus
spp. Moreover, different fungus
such as Blastomyces,
Fusarium
spp.,
Mucor
spp.,
Aspergillus
niger
,
Fusarium avenaceum
,
Penicillium digitatum
,
Rhizopus
stolonifer
,
Saccharomyces
species,
Fusarium solani
,
Aspergil-lus flavus
,
Saccharomyces dairensis
, and
Saccharomyces
exi-guus
were identified from different food items from food
stores or shops. The included studies also reported that
some of the microorganisms are resistant to different
anti-microbials (Table
3). The results also show that total
coli-forms, fecal colicoli-forms, and different fungus were commonly
reported in developing countries than developed countries.
On the other hand, different Campylobacter species were
re-ported in developed countries than developed countries.
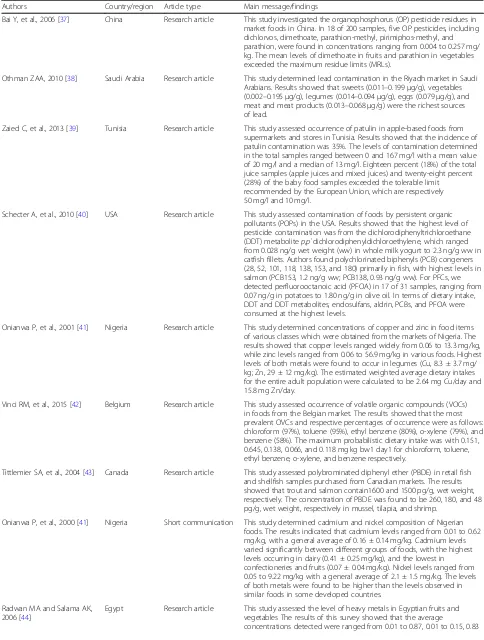
Chemical contamination of foods
Fifteen (19%) of the full-text articles included in this
re-view reported that contamination of foods with
hazard-ous chemicals is a major public health concern
associated with the food market. Heavy metals (like
cad-mium, nickel, lead, copper, zinc, iron, mercury, and
manganese), pesticide residuals (like dichlorvos,
di-methoate, parathion-methyl, pirimiphos-methyl, and
parathion), persistent organic pollutants (like
dichlorodi-phenyltrichloroethane metabolites, polychlorinated
bi-phenyls, perfluorooctanoic acid, endosulfans, and aldrin),
organic compounds (like patulin, chloroform, formalin,
and urea), volatile organic compounds (like ethyl
zene, o-xylene, and benzene), hydrocarbons (like
ben-zo[a]pyrene
and
toluene),
and
other
chemical
compounds (like calcium carbide and cyanide) are
chemical contaminants identified by the full-text articles
included in this review. In most cases, the concentration
of chemicals exceeded the tolerable limit for consumable
food items (Table
4).
Food adulteration
In 9 (11%) of full-text articles included in this review,
food adulteration has been discussed as a major public
health risk associated with food safety issues in the food
market. Most of the foodstuffs in the market are
adulter-ated in varying degrees. Chemicals (like urea fertilizer,
artificial color flavors, textile dye, formalin,
chlorofluoro-carbon; DDT powder, sodium bicarbonate, neutralizers,
detergents, hydrogen peroxide, caustic soda, sodium
chloride, boric acid, ammonium sulfate, sorbitol,
meta-nil yellow, ultramarine blue, rhodamine B., maleic
an-hydride, copper chlorophyll, dimethyl/diethyl yellow,
argemone oil, burnt mobil, and burnt oil); items which
are not the genuine component of foods (like potato
smash, cow
’
s fat and intestine in ghee, water in milk,
sugar in honey, etc.); poor-quality products; and
phys-ical or inert agents (like saw dust and brick powder) are
the commonest adulterants added to different food
items (Table
5).
Misuse of food additives
In this systematic review of literature, 11 of 81 (14%)
full-text articles showed that misuse of food additives
in the food market endangers public health. As
re-ported in the included full-text articles, even though
some food colorants and sweeteners are permitted to
use such as sunset yellow FCF (SSYFCF), tartrazine,
erythrosine, new coccine, ponceau, and saccharin
(some may not be permitted based on countries food
Fig. 2Regions where the included full-text articles conducted
Table 1
Common food safety
–
related public health risks
identified from the search process
Common public health risks related with food safety Number of papers
Microbial contamination of foods 21
Chemical contamination of foods 15
Food adulteration 9
Misuse of food additives 11
Mislabeling 17
Genetically modified foods 4
regulation), their concentration exceeded the
pre-scribed limit. Moreover, use of non-permitted
color-ants and sweeteners such as rhodamine B, metanil
yellow, orange II, malachite green, auramine, quinoline
yellow, amaranth, carmoisine, Sudan dyes, and cyclamate
(some may be permitted based on countries food
regula-tion) is also commonly reported in the included studies
(Table
6).
Table 2
Food safety
–
related public health risks in the food market by country name (countries are categorized into developed and
developing based on the United Nations (UN) 2019 list)
Food safety issues Countries where the included full-text articles are conducted
Developed Developing
Microbial contamination (21) Italy Philippines
USA Nigeria (2)
Greece (2) Mexico (2)
Spain (2) Sudan
UK (2) India (2)
South Africa
Iran
Thailand
Tanzania
Bangladesh
Chemical contamination (15) Saudi Arabia (2) China (2)
USA Tunisia
Belgium (2) Nigeria (2)
Canada Egypt
Italy Bangladesh (2)
Food adulteration (9) Taiwan Bangladesh (3)
India (2)
Pakistan
Ethiopia (2)
Misuse of additives (11) USA (2) India (4)
Taiwan Pakistan(2)
Iran
Indonesia
Mislabeling (17)a Ireland China
USA (3) Malaysia
Italy (3) India
Spain (4) Egypt (2)
Greek South Africa
Canada Brazil (2)
Belgium
Genetically modified foods (4)b USA Eastern Caribbean
Canada
Food past use-by dates (6) Canada Nigeria
USA Indonesia
Bangladesh
Kenya
Numbers in the bracket show the number of full-text articles included
a
There are studies conducted in two and/or three different countries. In this case, we may count one study twice and /or three times.
b
Mislabeling
Mislabeling of food products has been mentioned as a
major public health risk associated with food safety in
the food market in 17 of 81 (21%) full-text articles
in-cluded in this review. All of the 17 studies reported that
significant proportion of food samples collected from
su-permarkets, food stores, shops, and restaurants were
genetically identified as entirely different species from
that identified on the product labels, and therefore were
considered as mislabeled. The studies witnessed that
sea-food is the most commonly mislabeled sea-food product
(Table
7).
Genetically modified foods
In this systematic review of literature, 4 of 81 (5%) of the
in-cluded full-text articles discussed that GM foods are
be-coming an increasing public health risk. Hypertension,
stroke, diabetes, obesity, lipoprotein metabolism disorder,
Alzheimer
’
s, Parkinson
’
s, multiple sclerosis, hepatitis C,
end-stage renal disease, acute kidney failure, cancers of the
thyroid/liver/bladder/pancreas/kidney, myeloid leukemia,
diarrhea, vomiting, difficulty in breathing, respiratory
prob-lems, hormonal imbalances and susceptibility to infection
or immunosuppression, allergenic or rashes, and chemical
toxicity are health problems reported in the included
full-text articles (Table
8).
Foods past their use-by dates
Six (7%) of the included full-text articles revealed that
outdated or foods past their use-by dates are being
sold in food stores, shops, and restaurants which are
contributing huge public health and environmental
prob-lems (Table
9).
Discussion
This review identified that microbial contamination,
chemical contamination, adulteration, misuse of food
ad-ditives, mislabeling, genetically modified foods, and
out-dated foods are common public health risks related with
food safety issues in the food market. In the food
mar-ket, food can become contaminated in one country and
cause health problems in another. These food safety
is-sues cause exposure of consumers to biological,
chem-ical, and physical hazards [91
–
95] so that endanger
health of the public. The origin of food hazards can be
described as a chain which commences on the source
and continues with transportation, further processing
steps, merchandising events and finally ends with the
consumer [96
–
100]. Overall, this review suggested that
food safety
–
related public health risks are more
com-mon in developing countries than developed countries.
This can be justified that foods get easily contaminated
with microbes due to the poor hygiene and sanitation in
developing countries [101
–
104]. Moreover, hence the
regulatory services are weak in developing countries,
most food sellers may not comply with food hygiene and
safety requirements or standards [105
–
107]. In
develop-ing countries, the legislation enforcement is still weak
about administrating the concentration of harmful
con-taminants in the food [108,
109]. In addition, there is
in-adequate information and technology to detect fake and
fraud products
[110
–
112].
Table 3
Summary of full-text articles which reported microbial contamination of foods as a public risk in food marketing
Authors Country/region Article type Main message/findings
Gabriel AA, et al., 2007 [17] Philippines Research article This study assessed the microbiological quality of retailed mung bean sprouts. Ninety-four percent of the samples tested positive for the presence ofSalmonellaspp. and some samples had Coliform and
Escherichia colicounts as high as 5.90 and 5.50 log10CFU g−1, respectively. The poor microbiological quality of most of the tested sprouts was attributed to unhygienic sprout production and retailing practices.
Adeyanju GT and Ishola O, 2014 [18]
Nigeria Research article Accessed the levels ofSalmonellaandEscherichia coliin frozen poultry meats including their antimicrobial resistance pattern in Ibadan. Thirty-three percent and 43.4% of samples from retail markets tested positive forSalmonellaandEscherichia colirespectively.Salmonella entericaspp. showed 93% resistance to tetracycline and 100% resistance to augmentin and amoxicillin, whileEscherichia colishowed 100% resistance to augmentin and amoxicillin.
Giammanco GM, et al., 2011 [19]
Italy Research article This study assessed common food pathogens in cheese collected from retailing markets in Palermo. The result indicated that 4% and 44% of the samples, respectively, did not comply with the acceptability levels forS. aureusandE. coli. A high contamination of bacteria belonging to
EnterobacteriaceaeandStaphylococcaceaewas found in 42% and 50% of the cheeses analyzed, respectively. The results indicated that poor husbandry and poor hygiene practices during milk collection or preservation or during cheese production processes and handling. In addition, the retail sale conditions may have played a role in cheese contamination.
Zhao C, et al., 2001 [20] USA Research article This study assessed the prevalence of common food pathogens from retail raw meats in Washington, DC. Results of the study showed that 70.7% of chicken samples were contaminated withCampylobacter. Approximately 14% of turkey samples yieldedCampylobacter, whereas fewer pork (1.7%) and beef (0.5%) samples were positive for
Campylobacter. Thirty-eight point seven percent of chicken samples yieldedE. coli, while 19.0% of the beef samples, 16.3% of the pork samples, and 11.9% of the turkey samples were positive forE. coli. However, only 3.0% of the retail meat samples tested were positive forSalmonella.
Cárdenas C, et al., 2013 [21] Mexico Research article This study evaluated the microbiological quality of tomatoes and peppers from markets and supermarkets in Monterrey, Mexico. The results showed that the presence of indicator organisms was relatively high in peppers (average 4.4 to 4.7 log CFU/g for total mesophilic, 3.25 to 3.73 log CFU/g for total coliforms, and 1.69 log CFU/g for fecal coliforms). Tomatoes and peppers showed the greatest microorganism levels (~ 1 log CFU/g higher) in comparison with the other varieties.
Filiousis G, et al., 2009 [22] Greece Short communication This study analyzed prevalence, genetic diversity, and antimicrobial susceptibility ofListeria monocytogenesisolated from open-air food markets in Thessaloniki, Greece. Thirty (14.3%) containedL. monocytogenes
with the highest prevalence in raw meat (27.5%), raw meat products (18%), and cheese (8%). The strains were susceptible to 16 antimicrobials, except one strain which displayed resistance to tetracycline.
Pérez-Rodríguez F, et al., 2010 [23]
Spain Research article This study evaluated hygiene practices and microbiological quality of cooked meat products during slicing and handling at retail in Cordoba, Spain.Listeria monocytogenesandListeria inocuawere isolated from 7.35% (5/68) and 8.82% (6/68) of analyzed samples, respectively. Deficient handling practices were more common in small sized establishments.
Yagoub SO, 2009 [24] Sudan Research article This study aimed to isolateEnterobacteriaceaeandPseudomonasspp. from raw fish sold in fish market in Khartoum.Enterobacteriaceaewere isolated from 83 out of 150 (55%) randomly collected fishes, the most dominant isolates wereE. coli,Citrobacterspp.,Enterobacterspp., andKlebsiellaspp. This together with the highly pathogenicEnterobacteriaceaeincluding
Salmonellaspp. andShigellaspp.,Proteusspp., andAlklegensspp. Potential pathogenic organisms were also among the isolates. On the other hand,
Pseudomonasspp. were isolated from 62% of randomly collected fishes.
Kumari S and Sarkar PK, 2014 [25]
Table 3
Summary of full-text articles which reported microbial contamination of foods as a public risk in food marketing
(Continued)
Authors Country/region Article type Main message/findings
contamination in the various dairy products was up to 108cfu g−1or ml−1. An antibiogram of 144 isolates ofB. cereusgroup was obtained using 14 different antibiotics commonly used against foodborne diseases. All the 144 isolates were multidrug (at least five antibiotics) resistant.
Domınguez C, et al., 2002 [26]
Spain Research article This study assessed prevalence ofSalmonellaandCampylobacterin retail chicken meat in Spain.Salmonellawas isolated from 71 (35.83%) of the samples analyzed. The predominant serovars wereS. enteritidis(47.88%),
S. hadar(25.35%), and serotype 4,12:b:-(II) (19.71%). Other serovars such as
S. mbandaka,S. derby,S. virchow, andS. paratyphi Bwere isolated in much lower levels. Thermophilic campylobacters were isolated in 49.50% of the samples studied.
Vantarakis A, et al., 2011 [27]
Greece Research article This study assessed occurrence of microorganisms of public health and spoilage significance in fruit juices sold in retail markets in Greece. Bacteria were isolated from 51 samples (42.5%) and fungi from 78 samples (65%).
Escherichia coli O157:H7was detected in four of the analyzed samples (3.34%), andStaphylococcus aureuswas detected in four different samples (3.34%). In 11 samples (9.1%), the total number of microorganisms detected was as high as 125 CFU. Acidophilic microorganisms were isolated from 26 samples (21.7%) andBlastomyceswas detected in 46 samples (38.3%).
Heredia N, et al., 2001 [28]
Mexico Research note This study assessed microbiological Condition of Ground Meat Retailed in Monterrey, Mexico. Over 75% of the samples contained 105total mesophilic microorganisms per g, and over 40% had 106total coliforms per g. Fecal coliforms were present in most samples.Staphylococcus aureuswas detected in 2.3% of the samples,Salmonellaspp. in 11.4%,
Listeriaspp. in 62%, andL. monocytogenesin 16%.Escherichia coliwas detected in 76% of samples.Fusariumspp. andMucorspp. were detected in 3.4% of the samples, and low levels of yeast in 93%.
Nel S, et al., 2004 [28] South Africa Research article This study assessed bacterial populations associated with meat from the deboning room of a high-throughput red meat abattoir in South Africa. Almost the counts exceeded the microbiological guidelines for raw meat. The averageB. cereuscount over the sampling period was 8.32 × 10³cfu, g−1, forS. aureusandPseudomonasspp. 1.72 × 10⁵and 1.7 × 10⁵cfu g−1 respectively and forE. coli3.4 × 105cfu g−1. Sixty percent of the samples were positive for presumptiveSalmonellaspp. while 52% of the samples tested positive for the presence ofL. monocytogenes. The aerobic plate and Enterobacteriaceae counts were 1.7 × 10⁷and 4.6 × 10⁶cfu g−1, respectively.
Elson R, et al., 2004 [29] UK Research article This study examined microbiological quality of ready-to-eat cold sliced meats from catering and retail premises in the UK. Most ready-to-eat meat samples (75%) were of satisfactory/acceptable microbiological quality and 25% were of unsatisfactory/unacceptable quality. Two cold meat samples (< 1%) were of unacceptable microbiological quality because of the presence ofCampylobacter jejuniin 25 g andListeria monocytogenes
at 3.4 × 10⁴CFU g−1.
Hosseini A. 2011 [30] Iran Research article This study examined bacterial contamination of table eggs from retails markets in Iran. The result showed that 19 samples were contaminated byE. coli, four samples byProteusspp., and one sample byKlebsiellaspp.
Average colony count of coli form bacteria was 20 cfu/g andE. coliwas 12/6 cfu/g.
Banerjee M and Sarkar PK, 2003 [31]
India Research article This study investigated microbiological quality of some retail spices in India. The total aerobic mesophilic bacteria count showed that 51% of the samples were in the unacceptable level (> 106cfu g−1). While molds were detected in 97% of the samples, yeast was found in only one.Bacillus cereus,Clostridium perfringens,Staphylococcus aureus, and members of Enterobacteriaceae occurred in 85, 59, 11, and 85%, respectively of the kinds. Coliforms and fecal coliforms were found in 33 and 15%,
respectively of the kinds.Escherichia coliwas detected in only one sample, of garlic.SalmonellaandShigellawere found only in 2.6% of the samples.
Vindigni SM, et al., 2007 [32]
This review identified that microbial contamination of
foods in the food market is commonly reported in many
studies. Different bacterial species and funguses were the
commonest diseases causing pathogens identified [17
–
35,
113]. Failure to apply food safety strategies in every
stage of the food supply chain, for example bad food
handling practices, poor production process, poor
agri-cultural practices, poor transportation system, poor
mar-keting practices, and poor sanitation lead to microbial
contamination of foods [114
–
118]. Moreover, fraud of
foods such as adulteration, mislabeling, and selling of
spoiled or expired foods are also causing microbial
con-tamination [36,
119
–
122]. Microbial contamination of
foods causes millions of diseases and thousands of
deaths [123]. This review also shows that total coliforms,
fecal coliforms, and different fungus were commonly
re-ported in developing countries than developed countries.
This might be due to the fact that fecal contamination
of foods and the environment is common in developing
countries due to poor sanitation condition [124
–
126].
Moreover, the temperature and air system of food
stor-age areas are not well regulated in developing countries.
This situation creates favorable condition for molds. On
the other hand, different Campylobacter species were
re-ported in developed countries. This might be due to the
fact that advancement of molecular techniques to
iden-tify these microorganisms. Developing countries lack
specialized cultivation techniques to culture these
organ-isms [127]. The standard culture
–
based technique,
which is a predominant detection method in developing
countries, is not effective for Campylobacter species
[128
–
130].
Contamination of foods with hazardous chemicals has
been reported as a major public health concern
associ-ated with the food market in individual studies included
in this review [37
–
46,
48,
131
–
133]. The phases of food
Table 3
Summary of full-text articles which reported microbial contamination of foods as a public risk in food marketing
(Continued)
Authors Country/region Article type Main message/findings
31 (15.5%) of 200 samples.C. jejuniwas isolated from 15% of fresh market chicken samples and 35% of supermarket chicken samples.Arcobacterspp. were isolated from 42 (21%) samples; fresh market chicken had
significantly higherA. butzlericontamination than supermarket chicken. The presence ofEnterococcusspp., an indication of fecal contamination, was detected in 188 (94%) samples, including 100% of the beef and pork sources.
Simforian E, et al., 2015 [33]
Tanzania Research article This study assessed microbiological quality of raw fruit juice in Tanzania. The results showed that the total plate counts (TPC) ranged between 2.32 and 8.54 (Log cfu/ml). About 72.2% of juice samples had TPC above Codex recommended maximum levels (3.7–4.7 Log cfu/ml). The prevalence ofEscherichia coliin the juices was 80% with a range between 0.0 and 5.0 (Log MPN/ml) suggesting of direct fecal contamination or contamination from the environment.
Mailafia S, et al., 2017 [34] Nigeria Research article This study identified fungi associated with spoilt fruits vended in Gwagwalada market. NigeriaAspergillus nigerhad the highest occurrence in pineapple, watermelon, oranges, pawpaw, and tomatoes with a frequency of 38%.Fusarium avenaceumfollowed with the frequency of occurrence of 31% in fruits such as pineapple, watermelon, oranges, pawpaw, and tomatoes whilePenicillium digitatumandRhizopus stolonifer
had the least frequency of 4% each in tomato; and orange and tomato, respectively. Other fungal species were identified as yeast (Saccharomyces
species) (10%),Fusarium solani(8%), andAspergillus flavus(5%). The highest prevalence rate was 70% ofA. nigerfrom orange followed byF. avenaceumof which 65% isolates were recovered from pawpaw. Other fungal organisms such as yeast (Saccharomycesspecies),P. digitatum, and
R. stoloniferwere isolated with varying prevalence (40%, 20%, and 5%) from watermelon, tomato, and orange, respectively.
Hunter PR, et al., 1994 [35] England Research article This study isolated food spoilage yeasts from salads purchased from delicatessens in the Warrington area, England. The results indicated that Of the 87 salads, only 19% had plate counts greater than 10,000
organisms/g. Coliforms were isolated from 3 samples,E. colifrom one, and
Listeria monocytogenesfrom one. By contrast, yeasts were isolated from 76% of the salads and at counts greater than 10,000 organisms/g in 31%. Twenty-one different yeast species were isolated, of which the most common wereSaccharomyces dairensisandSaccharomyces exiguus.
Islam M, 2017 [36] Bangladesh Thesis This study assessed bacteriological quality of street-vended and expired food items collected from different areas in Dhaka City, Bangladesh. Out of total 35food samples (expired and street), enteric bacteria were found in 17 (48.6%) food samples containingE. coli,Vibrio,Shigella, and
Table 4
Summary of full-text articles which reported chemical contamination of foods as a public risk in food marketing
Authors Country/region Article type Main message/findings
Bai Y, et al., 2006 [37] China Research article This study investigated the organophosphorus (OP) pesticide residues in market foods in China. In 18 of 200 samples, five OP pesticides, including dichlorvos, dimethoate, parathion-methyl, pirimiphos-methyl, and parathion, were found in concentrations ranging from 0.004 to 0.257 mg/ kg. The mean levels of dimethoate in fruits and parathion in vegetables exceeded the maximum residue limits (MRLs).
Othman ZAA, 2010 [38] Saudi Arabia Research article This study determined lead contamination in the Riyadh market in Saudi Arabians. Results showed that sweets (0.011–0.199μg/g), vegetables (0.002–0.195μg/g), legumes (0.014–0.094μg/g), eggs (0.079μg/g), and meat and meat products (0.013–0.068μg/g) were the richest sources of lead.
Zaied C, et al., 2013 [39] Tunisia Research article This study assessed occurrence of patulin in apple-based foods from supermarkets and stores in Tunisia. Results showed that the incidence of patulin contamination was 35%. The levels of contamination determined in the total samples ranged between 0 and 167 mg/l with a mean value of 20 mg/l and a median of 13 mg/l. Eighteen percent (18%) of the total juice samples (apple juices and mixed juices) and twenty-eight percent (28%) of the baby food samples exceeded the tolerable limit recommended by the European Union, which are respectively 50 mg/l and 10 mg/l.
Schecter A, et al., 2010 [40] USA Research article This study assessed contamination of foods by persistent organic pollutants (POPs) in the USA. Results showed that the highest level of pesticide contamination was from the dichlorodiphenyltrichloroethane (DDT) metabolitep,p´dichlorodiphenyldichloroethylene, which ranged from 0.028 ng/g wet weight (ww) in whole milk yogurt to 2.3 ng/g ww in catfish fillets. Authors found polychlorinated biphenyls (PCB) congeners (28, 52, 101, 118, 138, 153, and 180) primarily in fish, with highest levels in salmon (PCB153, 1.2 ng/g ww; PCB138, 0.93 ng/g ww). For PFCs, we detected perfluorooctanoic acid (PFOA) in 17 of 31 samples, ranging from 0.07 ng/g in potatoes to 1.80 ng/g in olive oil. In terms of dietary intake, DDT and DDT metabolites, endosulfans, aldrin, PCBs, and PFOA were consumed at the highest levels.
Onianwa P, et al., 2001 [41] Nigeria Research article This study determined concentrations of copper and zinc in food items of various classes which were obtained from the markets of Nigeria. The results showed that copper levels ranged widely from 0.06 to 13.3 mg/kg, while zinc levels ranged from 0.06 to 56.9 mg/kg in various foods. Highest levels of both metals were found to occur in legumes (Cu, 8.3 ± 3.7 mg/ kg; Zn, 29 ± 12 mg/kg). The estimated weighted average dietary intakes for the entire adult population were calculated to be 2.64 mg Cu/day and 15.8 mg Zn/day.
Vinci RM, et al., 2015 [42] Belgium Research article This study assessed occurrence of volatile organic compounds (VOCs) in foods from the Belgian market. The results showed that the most prevalent OVCs and respective percentages of occurrence were as follows: chloroform (97%), toluene (95%), ethyl benzene (80%), o-xylene (79%), and benzene (58%). The maximum probabilistic dietary intake was with 0.151, 0.645, 0.138, 0.066, and 0.118 mg kg bw1 day1 for chloroform, toluene, ethyl benzene, o-xylene, and benzene respectively.
Tittlemier SA, et al., 2004 [43] Canada Research article This study assessed polybrominated diphenyl ether (PBDE) in retail fish and shellfish samples purchased from Canadian markets. The results showed that trout and salmon contain1600 and 1500 pg/g, wet weight, respectively. The concentration of PBDE was found to be 260, 180, and 48 pg/g, wet weight, respectively in mussel, tilapia, and shrimp.
Onianwa P, et al., 2000 [41] Nigeria Short communication This study determined cadmium and nickel composition of Nigerian foods. The results indicated that cadmium levels ranged from 0.01 to 0.62 mg/kg, with a general average of 0.16 ± 0.14 mg/kg. Cadmium levels varied significantly between different groups of foods, with the highest levels occurring in dairy (0.41 ± 0.25 mg/kg), and the lowest in confectioneries and fruits (0.07 ± 0.04 mg/kg). Nickel levels ranged from 0.05 to 9.22 mg/kg with a general average of 2.1 ± 1.5 mg/kg. The levels of both metals were found to be higher than the levels observed in similar foods in some developed countries.
Radwan MA and Salama AK, 2006 [44]
Egypt Research article This study assessed the level of heavy metals in Egyptian fruits and vegetables The results of this survey showed that the average
processing, packaging, transportation, and storage are
sig-nificant contributors to food contamination [109]. Food
contaminants include environmental contaminants, food
processing contaminants, unapproved adulterants and
food additives, and migrants from packaging materials.
Environmental contaminants are impurities that are either
introduced by human or occurring naturally in water, air,
or soil. Food processing contaminants include those
un-desirable compounds, which are formed in the food
dur-ing bakdur-ing, roastdur-ing, canndur-ing, heatdur-ing, fermentation, or
hydrolysis. The direct food contact with packaging
mate-rials can lead to chemical contamination due to the
migra-tion of some harmful substances into foods. Use of
unapproved or erroneous additives may result in food
contamination [134
–
138]. Chemical contamination of
foods is responsible millions of cases of poisoning with
thousands of hospitalizations and deaths each year [139].
Nine of the full-text articles included in this review
re-ported that food adulteration is a major public health risk
associated with food safety issues in the food market.
Che-micals, items which are not the genuine component of
foods, poor-quality products, and physical or inert agents
are the commonest adulterants added [47,
49
–
56]. Food
adulteration involves intentional or unintentional addition
of useless, harmful, unnecessary chemical, physical, and
biological agents to food which decreases the quality of
food. It also includes removal of genuine components and
processing foods in unhygienic way
[119,
140]. However,
removal of genuine components of food is not considered
in this review. Food is adulterated to increase the quantity
Table 4
Summary of full-text articles which reported chemical contamination of foods as a public risk in food marketing
(Continued)
Authors Country/region Article type Main message/findings
to 18.3, and 1.36 to 20.9 mg/kg for Pb, Cd, Cu, and Zn, respectively. The highest mean levels of Pb, Cd, Cu, and Zn were detected in strawberries, cucumber, date, and spinach, respectively.
Ali MH and Al-Qahtani KM, 2012 [45]
Saudi Arabia Research article This study assessed concentration of heavy metals in vegetables, cereals, and fruits in Saudi Arabian markets. The results declared that concentrations of major studied metals were exceeding than the recommended maximum acceptable levels proposed by the Joint FAO/ WHO Expert Committee. Leafy vegetables were found to contain the highest metal values especially parsley (543.2 and 0.048μg/g for Fe and Hg respectively), Jews mallow (94.12 and 33.22μg/g for Mn and Zn respectively), spinach (4.13μg/g for Cd). While peas in legumes group maintained the highest Zn content 71.77μg/g and finally cucumber had the highest Pb content 6.98μg/g on dry matter basis.
NIE Ji-yun, et al., 2016 China Research article This study analyzed the concentrations of the heavy in China’s main deciduous fruits. Only 2.2% of the samples were polluted by Ni, only 0.4% of the samples were polluted by Pb, and no samples were polluted by Cd or Cr. For the combined heavy metal pollution, 96.9% of the samples were at safe level, 2.32% at warning level, 0.65% at light level, and 0.13% at moderate level.
Vinci RM, et al., 2012 [42] Belgium Research article This study assessed human exposure to benzene through foods from the Belgian market. Benzene was found above the level of detection in 58% of analyzed samples with the highest contents found in processed foods such as smoked and canned fish, and foods which contained these as ingredients (up to 76.21μg kg−1).
Moret S, et al., 2010 [46] Italy Research article This study assessed levels of polycyclic aromatic hydrocarbons (PAHs) in dietary supplements from the Italian market. The results showed that about half of the samples analyzed presented benzo[a]pyrene (BaP) concentrations exceeding 2μg/kg, which is proposed as a regulatory limit for dietary supplements.
Ali Anma, 2013 [47] Bangladesh Regulatory paper This study investigated food safety and public health issues in Bangladesh. The study showed that use of formalin and DDT in foods is a crucial problem in Bangladesh. Supermarkets openly sell fruits, fishes, and vegetables that have been treated with formalin to keep them fresh. In Bangladesh, DDT is commonly used in dried fish (locally called assutki) processing.
Hossain MM, et al., 2008 [48]
and make more profit, which is economically motivated
adulteration [141
–
143]. Chemicals which are being used
as adulterants have a wide range of serious effects on the
health of consumers including cancer [119,
144
–
147].
In this systematic review of literature, 11 of the
full-text articles reported that misuse of food additives in the
food market endangers public health
[57
–
67]. Food
additive is any substance not normally consumed as a
food by itself; not normally used as a typical ingredient
of the food (whether or not it has nutritive value); and
added intentionally to food for a technological purpose
in the production process for the purpose of maintaining
Table 5
Summary of full-text articles which reported food adulteration as a public risk in food marketing
Authors Country/
region
Article type Main message/findings
Ali Anma, 2013 [47] Bangladesh Regulatory paper
This study investigated food safety and public health issues in Bangladesh. The study pointed out that most of the foodstuffs, be it manufactured or processed, are adulterated in varying degrees. The puffed rice is contaminated by using the urea fertilizer to make it whiter and bigger in size. Ghee is adulterated rotten milk, palm oil, soybean, animal or vegetable fat, potato paste, and with artificial color flavors.
Nasreen S and Ahmed T, 2014 [49]
Bangladesh Research article This study investigated the magnitude of food adulteration during 1995–2011 and consumer awareness in Dhaka City. The study reported that 40–54% of daily-consumed food was adulterated during 1995–2011. More than 35 food items were commonly adulterated. Some of the hazardous adulterants were white eggs of farm hens colored red with textile dye to sell as local hen eggs; inject formalin through the gills; or dip fishes in water treated with chemicals, such as chlorofluorocarbon; DDT powder to prevent rotting; textile dye in sweetened curd; toxic chemical, po tato smash, cow’s fat and intestine in ghee; chemicals, color, burnt mobil from rail locomotives, and burnt oil from electric transformer in edible oils; urea in rice to make it whiter; and many more others.
Chanda T, et al., 2012 [50] Bangladesh Research article This study aimed to detect the type of adulterants and preservatives added to the incoming fluid milk from rural areas to the Barisal, Bangladesh. The results indicated that 100% of the milk samples were adulterated with water. Cane sugar, powdered milk, and starch were detected as 26.0, 14.0, and 12.0% in the milk samples, respectively. Out of all samples, 10.0% was adulterated with formalin and 20.0% with sodium bicarbonate.
Singuluri H and Sukumaran M, 2014 [51]
India Research article The study assessed adulteration of natural milk with various illegal substances. The results pointed out that sucrose and skim milk powder were present in 22% and 80% of the milk samples respectively. Urea, neutralizers, and salt were present in 60%, 26%, and 82% of the milk samples respectively. Formalin, detergents, and hydrogen peroxide were present in 32%, 44%, and 32% of the milk samples obtained.
Barham GS, et al., 2014 [52] Pakistan Research article This study examined various adulterants of milk in Pakistan. The study found that water (73%), detergent (32%), cane sugar (22%), caustic soda (20%), rice flour (17%), sodium chloride and skimmed milk powder (15%), hydrogen peroxide (13%), starch (12%), formalin (11%), urea and vegetable oil (10%), boric acid (8%), ammonium sulfate (6%), glucose (5%), sorbitol (4%), and arrowroot (1%) were found in milk samples.
Waghray K, et al., 2011 [53] India Research article This study identified the adulteration in different food products available in the twin cities of Hyderabad and Secunderabad. The findings showed that chili powder samples showed the presence of metanil yellow (8%) added color (92%) and saw dust (48%). Dry ginger samples (8.33%) showed the presence of an unpermitted colored dye ultramarine blue. The sweet meat samples showed the presence of aluminum foil (4.3%) instead of silver foil. Coconut burfi samples contained unpermitted color orange II and cotton candy and floss candy showed the presence of rhodamine B. The total percentage of adulteration in the food samples was found to be 49.41%.
Peng G-J, et al., 2017 [54] Taiwan Research article This study outlines the major cases of food adulteration that occurred in Taiwan between 2011 and 2015, including the adulteration of food additives with plasticizers, starch products with maleic anhydride, olive oil with copper chlorophyll, lard with recycled cooking oil, and processed soymilk curd with dimethyl/diethyl yellow.
Woldemariam HW and Abera BD, 2014 [55]
Ethiopia Research article This study investigated the extent of adulteration of selected foods in Bahir Dar, Ethiopia. The result showed that 6.7% of butter samples were adulterated with vegetable sources, mainly mashed potatoes; 8% of coffee powder samples were adulterated with roasted cereals; 15% of honey samples were adulterated with sugar or invert sugar; 1.3% of the red pepper powder samples were adulterated with brick powder; and 2.7% of edible oil samples contain argemone oil.
Table 6
Summary of full-text articles which reported misuse of food additives as a public risk in food marketing
Authors Country/
region
Article type Main message/findings
Dixit S, et al., 2011 [57] India Research article
This study assessed usage pattern of synthetic food colors in different states of India. The results revealed that the majority of candyfloss, sugar toys, beverages, mouth fresheners, ice candy, and bakery product samples exceeded the prescribed limit. Non-permitted colors were mostly prevalent in candyfloss and sugar toy samples. Though sunset yellow FCF (SSYFCF) and tartrazine were the two most popular colors, many samples used a blend of two or more colors. The blend of SSYFCF and tartrazine exceeded the prescribed limit by a factor of 37 in one sample.
Tripathi M, et al., 2007 [58]
India Research article
This study assessed use of synthetic colors in India. The study reported that 31% samples contained non-permitted colors. In urban areas, samples of crushed ice which are preferentially consumed by children population, the presence of Sunset Yellow FCF and Tartrazine was found to exceed the permissible limit by 8 and 20 times while in rural areas, Sunset Yellow FCF, Tartrazine, and Carmoisine exceeded the permissible limit by 23, 16, and 15 times, respectively. Non-permitted colors such as rhodamine B, metanil yellow, orange II, malachite green, auramine, quinoline yellow, amaranth, and Sudan dyes were identified in various foodstuffs.
Stevens LJ, et al., 2014 [59]
USA Research article
This study assessed amounts of artificial food colors in commonly consumed beverages in the USA. The findings showed that most sweetened and artificially sweetened carbonated beverages, fruit drinks and punches, sports drinks, and energy drinks are dyed with either caramel color or artificial colors in widely varying amounts. Beverages (liquid and powdered) contained a wide range of concentrations of artificial food colors from 1.2 to 48 mg/240 ml.
Rao P, et al., 2004 [60] India Research article
This study assessed exposure to synthetic food colors of a selected population in Hyderabad, India. The study reported that children had an intake of solid food consumption in the range 2– 465 g day–1and liquid food consumption in the range 25–840 ml day–1with added colors. Among the eight permitted colors in India, six were consumed by the subjects of the study. The intakes of some subjects exceeded the acceptable daily intake for colors such as tartrazine, sunset yellow, and erythrosine, which is 7.5, 2.5, and 0.1 mg kg–1body weight, respectively.
Ashfaq N and Masud T, 2002 [61]
Pakistan Research article
This study assessed artificial colors in different ready-to-eat foods in Rawalpindi, Pakistan. The results showed that quantities of the permitted coloring matter among the tested samples were found within the range of 18–220 ppm and 47.56% of the samples contained non-permitted food colors.
Jonnalagadda PR, et al., 2004 [62]
India Research article
This study assessed type, extent, and use of colors in ready-to-eat (RTE) in Hyderabad, India. The results showed that 90% of the samples contained permitted colors, 2% contained a combination of permitted and non-permitted colors, and 8% contained only non-permitted colors. However, in RTE foods with permitted colors, 73% exceeded 100 ppm. Among the permitted colors, tartrazine was the most widely used color followed by sunset yellow. The maximum concentration of colors was detected in sweet meats (18 767 ppm), non-alcoholic beverages (9450 ppm), miscellaneous foods (6106 ppm), and hard-boiled sugar confectioneries (3811 ppm). Among the non-permitted colors found, rhodamine was most commonly used.
Tsai C-F, et al., 2015 [63] Taiwan Research article
This study determined synthetic dyes in chili powders and syrup-preserved fruits purchased from retail establishments in Taipei City, Taiwan. The results showed that three legal food dyes, tartrazine, and/or sunset yellow FCF, and/or new coccine, are present in some syrup-preserved fruits. Amaranth, an illegal food dye is found in an imported syrup-preserved fruit.
Moradi-Khatoonabadi Z, et al., 2015 [64]
Iran Research article
This study assessed synthetic food colors in foods from restaurants in Tehran, Iran. Of the total 573 samples, 52% were positive for at least one color. The most prevalent colors were tartrazine, quinoline yellow, and sunset yellow, with 44%, 9.1%, and 8.4% of the samples testing positive for these colors, respectively. Carmoisine and ponceau were both detected only in 0.5% of the positive samples and found only in saffron solution.
Saleem N and Umar ZN, 2013 [65]
Pakistan Research article
This study assessed the type of food colors added to various food products especially those vended at or near different educational institutes of Karachi City, Pakistan. The results revealed that some foods manufactured locally contained non-permitted colors. About 11% branded and 44% unbranded food items, respectively, were found with not permitted colors for human consumption. Similarly, 4% branded and 30% unbranded beverages were found unfit due to the presence of prohibited colors.
Petigara Harp B, et al., 2013 [66]
USA Research article
This survey assessed color additives in food products purchased from retail stores in Washington, DC, and surrounding Maryland counties. A survey of 44 food products, including beverages, frozen treats, powder mixes, gelatin products, candies, icings, jellies, spices, dressings, sauces, baked goods, and dairy products, found total color additives ranging from 1.9 to 1221 mg/kg.
Sood M, 2014 [67] Indonesia Field inspection
Table 7
Summary of full-text articles which reported mislabeling as a public risk in food marketing
Authors Country/region Article type Main message/findings
Miller DD and Mariani S, 2010 [68]
Ireland Research article This study collected food samples from supermarkets, shops, and restaurants in Dublin, Ireland to assess labeling and transparency in the European seafood industry. The assessment showed that 39 out of 156 (25%) samples were genetically identified as entirely different species from that identified on the product labels, and therefore were considered as mislabeled. More significantly, 28 out of 34(82.4%) smoked fish samples were found to be mislabeled.
Jacquet JL and Pauly D, 2008 [69]
USA Research article This paper examines the extent and consequences of renaming and mislabeling seafood, with particular attention to the USA, where 80% of the seafood is imported and more than one-third of all fish are mislabeled.
Armani A, et al., 2012 Italy Research article This survey assessed label compliance of jellyfish products sold on the Italian market. The survey found many shortfalls including the presence of a trade name referring to vegetables or a lack of an unequivocal specification of ingredients.
Armani A, et al., 2013 Italy and China Research article Forensically informative nucleotide sequencing (FINS) of a short mitochondrial COI gene fragment revealed 100% of the sample of ready-to-eat jellyfish food products in Italy and China were mislabeled.
Chin TC, et al., 2016 [70] Malaysia Research article This study detected mislabeled seafood products in Malaysia by DNA barcoding. A total of 62 seafood samples, either raw, frozen, or variously processed, were collected from commercial sources in Malaysia. The DNA targets were successfully amplified and sequenced from 81% of seafood samples. Among these samples, 16% were found to have been mislabeled at source.
Nagalakshmi K, et al., 2016 [71]
India Research article This study found out the level of seafood mislabeling prevailing in India using DNA barcoding. A total of 100 seafood samples including fresh, frozen, ready-to-cook, ready-to-eat, and canned products were collected. The results revealed 22% of seafood mislabeling prevailing in Indian domestic market.
Galal-Khallaf A, et al., 2014 [72]
Egypt Research article This study assessed the labeling status of Egyptian fish fillets. DNA barcoding was applied to ascertaining species in fish fillets (tilapia, Nile perch, and panga) purchased from Egyptian markets. Ninety commercial samples were analyzed. Sequencing of a short fragment of mitochondrial cytochrome oxidase I (COI) gene revealed 33.3% species substitution in the fish fillets analyzed, 50% Nile perch (Lates niloticus) and 50% basa fish (Pangasius bocourti) being replaced by imported Vietnamese tra fish (Pangasianodon hypophthalmus).
Cawthorn D-M, et al., 2012 [73]
South Africa Research article This study investigated incidence of fish species misrepresentation and substitution on the South African market. The results showed that 10 of 108 (9%) samples from wholesalers and 43 of 140 (31%) from retailers were identified as different species to the ones indicated at the point of sale.
Di Pinto A, et al., 2015 [74]
Italy Research article This study investigated processed-meat products from Italian markets in order to verify any species substitution or mislabeling. The results revealed a high substitution rate among the meat products, highlighting a mislabeling rate of 57%, and consequently, considerable discordance with the indications on the labels.
Carvalho DC, et al., 2017 [75]
Brazil Research article This study analyzed twenty-two processed cod products purchased from supermarkets, local stores, fast food outlets, and one restaurant in the city of Belo Horizonte, Brazil. A mixture of two or more species was found within 31% of all products and 41% mislabeling was reported within highly processed cod products.
Garcia-Vazquez E, et al., 2010 [76]
Spain and Greek Research article DNA analysis of hake products commercialized in Spanish and Greek market chains has demonstrated more than 30% mislabeling, on the basis of species substitution. Tails and fillets were more mislabeled than other products, such as slices and whole pieces. African species were substitute species for products labeled as American and European species.
Staffen CF, et al., 2017 [77]
Brazil Research article This study assessed labeling of fish products in a popular tourist destination in Brazil. A DNA barcoding of 65 samples from fisheries and 80 from restaurants revealed that 30% of mislabeled samples in fisheries and 26% in restaurants.
Muñoz-Colmenero M, et al., 2017 [78]
Spain, USA, and Canada
Research article This study assessed mislabeling in salmon products from two regions, Northwest of America and Northwest of Spain. A DNA barcoding of samples indicated that the Spanish and Northwest American samples were mislabeled 6% and 23.8% respectively.
Muñoz-Colmenero M, 2016 [79]
a food
’
s nutritional quality, for example by preventing
the degradation of vitamins, essential amino acids, and
unsaturated fats; extending the shelf life of a product, for
example by preventing microbial growth; and
maintain-ing and improvmaintain-ing a product
’
s sensory properties, such
as texture, consistency, taste, flavor, and color; Being
able to provide products [148,
149]. Substances generally
recognized as safe (GRAS) can be used as food additives
[150,
151]; however, misuse of substances such as using
more than the maximum allowable concentration; using
non-permitted substances; and blending of permitted
and non-permitted substances together causes health
hazards [152,
153].
Mislabeling of food products has been mentioned as a
major public health risk associated with food safety in
the food market in 17 of the full-text articles included in
this review
[68
–
82,
154]. Mislabeling of food products
includes false advertising, deliberately or accidentally
leaving out ingredients, not listing potential health
ef-fects, and claiming a food contains ingredients that it
does not for financial gain with the intent of deceiving
the consumer regarding what is actually in the package
[155]. These acts of fraud have increased overtime as
dif-ferent parties such as manufacturers, co-packers,
distrib-utors, and others along the chain of distribution involve
in the national or international trade. Mislabeling leads
Table 7
Summary of full-text articles which reported mislabeling as a public risk in food marketing
(Continued)
Authors Country/region Article type Main message/findings
Bosko SA, et al., 2018 [80] USA Research article This study tested 80 catfish samples collected from restaurants, grocery stores, and fish markets in the USA tested with real-time PCR. A DNA barcoding of samples showed that 7 of the 80 catfish products were found to be substituted with Pangasiidae species for a mislabeling rate of 9%. This included 5 of the 40 restaurant samples and 2 of the 32 grocery store samples.
Christiansen H, et al., 2018 [81]
Belgium Research article This study assessed seafood substitution and mislabeling in Brussels’restaurants and canteens. A DNA barcoding revealed that 31.1% of the samples were mislabeled, with mislabeling present in all types of vendors. Cod and sole were the most frequently sampled and were also mislabeled regularly (13.1% and 11.1%). Bluefin tuna was substituted almost always (95% mislabeling).
Galal-Khallaf A, et al., 2002 [82]
Egypt and Spain Research article This study is a PCR-based assessment of shellfish traceability and sustainability in seafood markets. The results found that 17.2% and 15.2% products were mis labeled in Egypt and Spain, respectively.
Table 8
Summary of full-text articles which reported genetically modified foods as a public risk in food marketing
Authors Country/region Article type Main message/findings
Swanson NL, et al., 2014 [83]
USA Research article This study found that the Pearson correlation coefficients are highly significant (< 10−4) between the percentage of GE corn and soy planted in the USA and hypertension (R= 0.961), stroke (R= 0.983), diabetes prevalence (R= 0.983), diabetes incidence (R= 0.955), obesity (R= 0.962), lipoprotein metabolism disorder (R= 0.955), Alzheimer’s (R= 0.937), Parkinson’s (R= 0.952), multiple sclerosis (R= 0.876), hepatitis C (R= 0.946), end-stage renal disease (R= 0.958), acute kidney failure (R= 0.967), cancers of the thyroid (R= 0.938), liver (R= 0.911), bladder (R= 0.945), pancreas (R= 0.841), kidney (R= 0.940), and myeloid leukemia (R= 0.889).
Pattron DD, 2005 [84] Eastern Caribbean
Research article This study investigated health implications associated with GM foods in Trinidad. The survey found that diarrhea, vomiting, rashes, difficulty in breathing, respiratory problems, hormonal imbalances, and susceptibility to infection or immunosuppression are common reported health problems associated with consuming GM foods. These medical claims were supported by medical certificates, diagnosis, treatment regimens, and physician letters and/or prescriptions. Foods consumed were validated against the list of known genetically modified foods
Bakshi A, 2003 [85] General setting Research article There are concerns about the safety of genetically modified crops. The concerns are that they may contain allergenic substances due to introduction of new genes into crops. Another concern is that genetic engineering often involves the use of antibiotic-resistance genes as“selectable markers”and this could lead to production of antibiotic-resistant bacterial strains that are resistant to available antibiotics. This would create a serious public health problem. The genetically modified crops might contain other toxic substances (such as enhanced amounts of heavy metals).
Aris A and Leblanc S, 2011 [86]