R E S E A R C H A R T I C L E
Open Access
Comparison of population-averaged and
cluster-specific models for the analysis of cluster
randomized trials with missing binary outcomes:
a simulation study
Jinhui Ma
1,2,3, Parminder Raina
1,2, Joseph Beyene
1and Lehana Thabane
1,3,4,5*Abstracts
Background:The objective of this simulation study is to compare the accuracy and efficiency of
population-averaged (i.e. generalized estimating equations (GEE)) and cluster-specific (i.e. random-effects logistic regression (RELR)) models for analyzing data from cluster randomized trials (CRTs) with missing binary responses.
Methods:In this simulation study, clustered responses were generated from a beta-binomial distribution. The number of clusters per trial arm, the number of subjects per cluster, intra-cluster correlation coefficient, and the percentage of missing data were allowed to vary. Under the assumption of covariate dependent missingness, missing outcomes were handled by complete case analysis, standard multiple imputation (MI) and within-cluster MI strategies. Data were analyzed using GEE and RELR. Performance of the methods was assessed using standardized bias, empirical standard error, root mean squared error (RMSE), and coverage probability.
Results:GEE performs well on all four measures—provided the downward bias of the standard error (when the number of clusters per arm is small) is adjusted appropriately—under the following scenarios: complete case analysis for CRTs with a small amount of missing data; standard MI for CRTs with variance inflation factor (VIF) <3; within-cluster MI for CRTs with VIF≥3 and cluster size>50. RELR performs well only when a small amount of data was missing, and complete case analysis was applied.
Conclusion:GEE performs well as long as appropriate missing data strategies are adopted based on the design of CRTs and the percentage of missing data. In contrast, RELR does not perform well when either standard or within-cluster MI strategy is applied prior to the analysis.
Keywords:Marginal model, Population-averaged model, Cluster-specific model, Multiple imputation, Cluster randomized trial, Covariate dependent missingness, Generalized estimating equations, Random-effects logistic regression
Background
Cluster randomized trials (CRTs) are randomized con-trolled trials in which clusters of subjects rather than inde-pendent subjects are randomly allocated to trial arms and outcomes are measured for individual subjects or clusters.
CRTs increasingly are being used in health services re-search and primary care. Reasons for adopting cluster randomization as a more appropriate design include: 1) administrative convenience; 2) ethical considerations; 3) intervention is naturally applied at the cluster level; 4) to enhance the subject compliance; and 5) to minimize the potential treatment “contamination” between the inter-vention and control subjects [1]. In CRTs, outcomes from subjects within the same cluster may exhibit a greater cor-relation than do outcomes from subjects in different clus-ters. The correlation within clusters, which is quantified
* Correspondence:[email protected]
1Department of Clinical Epidemiology and Biostatistics, McMaster University,
Hamilton, Ontario, Canada
3Biostatistics Unit/FSORC 3rd Floor Martha, Room H325, St. Joseph's
Healthcare Hamilton, 50 Charlton Avenue East, Hamilton, Ontario L8N 4A6, Canada
Full list of author information is available at the end of the article
by the intracluster correlation coefficient (ICC)ρ, may re-sult in substantially reduced statistical efficiency relative to trials that randomize the same number of individuals. The overall outcome varianceσ2in a CRT can be expressed as the sum of between-cluster varianceσB2and within-cluster varianceσW2. Correspondingly, the ICC is defined asρ=σB2/ (σB2+σW2), which is interpreted as the amount of variation that can be explained by variation between clusters. The re-duction in efficiency is a function of the variance inflation due to clustering, also known as the design effect or vari-ance inflation factor (VIF), given by VIF¼1þðm 1Þρ, wherem denotes the average cluster size.
Missing data may be a serious problem in some CRTs due to the lack of direct contact with individual subjects and lengthy follow-up [2]. The impact of missing data on estimation of the treatment effect and its confidence inter-val depends on the mechanism which caused the data to be missing, the strategy used to handle missing data, and the model used for statistical analysis. Missing data mechan-isms are generally categorized into missing completely at random, missing at random, and missing not at random [3]. An observation is missing completely at random if the probability of missingness is independent of any observed or unobserved measurements. An observation is missing at random if the probability of missingness depends on the observed data. Missing not at random is the situation where the probability of missingness is related to the unobserved measurement. Covariate dependent missingness (CDM) is a simple case of missing at random, where the probability of missingness depends only on the observed covariates, but not on the observed outcomes. In this study, we focus on missing outcome data since the chance of having miss-ing data on baseline characteristics or covariates, which are typically collected prior to the randomization, is relatively low. A variety of methods can be used to handle missing data: 1) listwise deletion (or complete case analysis) which excludes subjects with missing data from the analysis; 2) single imputation procedures, such as mean imputation; 3) likelihood-based methods, which usually involve a maximization of the likelihood function derived from the underlying model and estimate parameters by accounting for the missingness; and 4) multiple imputation (MI), which replaces each missing value with a set of plausible values that represent the uncertainty about the right value to im-pute. MI has become widely-used methods for handling missing data in recent years since it offers distinct advan-tages over other methods. Single imputation methods do not account for the uncertainty about the predictions of the unknown missing values and may lead to underestimation of the variance of effect estimates. Likelihood-based meth-ods may be difficult to implement when no algorithm or procedure is available to maximize the likelihood. Listwise deletion weakens the statistical power of the test conducted and may lead to biased results when data are missing not at
random. In addition, this analysis does not adopt an intention-to-treat principle — because it excludes some randomized participants (i.e. those with missing data). In general, compared to complete case analysis and single im-putation strategies, MI has the advantage of reducing the bias and improving the efficiency of effect estimates, even when only outcome data are missing [4,5]. Moreover, for cluster randomized trials, there is a higher risk that the vari-ance of effect estimate will be underestimated with single imputation methods. MI would be, therefore, the most ap-propriate choice to handle missing outcome data to minimize the likelihood of underestimating the variance. Our previous study showed that MI, if used appropriately, is a valid strategy to handle missing binary outcomes in CRTs [6].
A key property of CRTs is that inferences or analyses are frequently done to apply at the individual level while randomization is at the cluster level, thus the unit of randomization may be different from the unit of inference or analysis. In this case, the lack of independence among individuals in the same cluster, i.e. the between-cluster vari-ation, presents special methodological challenges that affect both the design and analysis of CRTs. Consequently, stand-ard approaches for statistical analysis do not apply because they may result in severely underpowered studies and spuri-ously elevated Type I error rates [1]. Different statistical methods that account for the clustering effect have been proposed in the literature, and they are categorized into individual-level and cluster-level data analysis methods. Individual-level analysis models, such as population-averaged (PA) models (also called marginal models) and cluster-specific (CS) models (also called conditional mod-els), have been advocated for the analysis of CRTs with bin-ary outcomes since they allow for the possible imbalance of both cluster-level and individual-level characteristics to be incorporated into the analysis. The ability to adjust for imbalanced characteristics between trial arms is very im-portant when the number of clusters is not large enough to keep the cluster- or individual-level characteristics balanced between the trial arms. The generalized estimating equa-tions (GEE) approach [7] and the random-effects logistic re-gression (RELR) are two commonly used individual-level analysis methods for estimating the PA and CS intervention effect for CRTs with binary outcomes, respectively.
clusters was 10, 20, 30 or 50, the mean number of subjects per cluster was either 10 or 100, the ICC was 0.1, the sponse proportion in the control arm was 0.23 and the re-sponse proportions in the intervention arm were: 0.09, 0.13, 0.18, 0.23 or 0.28. The study showed that the differ-ence between the two models diminished as the number of clusters increased. In particular, the difference was neg-ligible if the total number of clusters was at least 30. How-ever, if the total number of clusters was 10 or 20, RELR would have moderately lower power than GEE method. Ukoumunne et al. [10] compared the accuracy of esti-mated treatment effect and confidence interval coverage of several methods for analyzing binary outcomes in CRTs through a simulation study. They showed that the GEE method had acceptable properties as long as the bias of the standard error was corrected when the number of clusters was small. The RELR was not assessed in their simulation study. Maet al.[11] compared different strat-egies to handle missing binary outcomes in CRTs when GEE method and RELR were used as methods of analysis. Findings from this paper implied that both models could be used to analyze data from CRTs after multiple imput-ation was applied to handle missing outcome data. How-ever, the generalizability of their findings was limited in that their simulation was based on a real dataset. This study is an extension of this work to assess the accuracy and efficiency of PA and CS models, in particular, the GEE method and the RELR respectively, when multiple imput-ation techniques are applied to handle missing binary out-comes in CRTs using simulated data. The performance of the methods is compared in terms of standardized bias, empirical standard error, root mean squared error (RMSE), and coverage probability. The simulation is designed under the assumptions of CDM and CRTs with a balanced completely randomized design.
Methods
The rest of this section is organized as follows: First, the statistical analysis methods (i.e. GEE and RELR) used to analyze binary outcomes in CRTs are described. Second, the missing data strategies used in this study for handling missing binary outcomes are briefly introduced. Third, the method for combining the results across multiply imputed datasets is described.
Statistical analysis methods
Generalized estimating equations
The GEE approach for fitting the logistic regression devel-oped by Liang and Zeger [12] can be formulated as
logit Pr yijl¼1
¼Xijlβmarginal; ð1Þ
whereyijldenotes the binary outcome of patientlin cluster j in the intervention group i, Pr(yijl= 1) denotes the
corresponding probability of success,Xijldenotes the corre-sponding vector of individual-level or cluster level covari-ates.βmarginaldenotes the marginal regression coefficients, and logit Pr yijl¼1
¼ log Prðyijl¼1Þ
1Prðyijl¼1Þ
.
To analyze the data from CRTs, an exchangeable correlation matrix is usually specified to account for poten-tial within-cluster homogeneity in outcomes, and the robust standard error method is used to obtain the improved stan-dard error for estimation ofβmarginal. In this paper, we only
include one covariate, treatment group, in the model fitting. It has been recommended that at least 40 clusters need to be included in a study to ensure the GEE method pro-duces reliable standard errors [13]. This is because, firstly, the method tends to underestimate the covariance of observations leading to downward biased estimate of standard error and, secondly, the estimate of standard error is highly variable when the number of clusters is too small [14]. A number of methods have been proposed for dealing with the shortcomings of the robust standard error estimator [13]. In this paper, the downward bias of the sandwich standard error estimator is adjusted by multiply-ing it bypffiffiffiffiffiffiffiffiffiffiffiffiffiffiffiffiffiffiffiJ=ðJ1Þ, where J is the number of clusters in each arm.
Random-effects logistic regression
RELR incorporates cluster-specific random effects into the logistic regression and assumes that the random effects fol-low a normal distribution. The model can be formulated as
logit Pr yijl¼1
¼XijlβconditionalþUij; ð2Þ
where Uij~N(0,σB2) represent the random effects, which vary independently from one cluster to another according to a common Normal distribution with a mean of zero and variance ofσB2, which represents the between-cluster vari-ance. βconditional denotes the conditional regression
coeffi-cients. Model parameters can be estimated using maximum likelihood [15].
conditional treatment effect: βmarginal=βconditinal(1−ρ), where ρ is the intracluster correlation coefficient. In addition, different assumptions are required for the two models regarding missing data. The marginal model using GEE method requires data to be missing completely at random, whereas the cluster-specific model using RELR requires data to be missing at random. Both GEE and RELR are valid for analyzing binary outcomes in CRTs under the assumption of CDM.
Missing data strategies
In this paper, we consider three strategies to handle miss-ing binary outcomes in CRTs: 1) complete case analysis; 2) standard MI using logistic regression; and 3) within-cluster MI using logistic regression. The performance of GEE method and RELR is compared after missing data are handled by the above strategies.
Complete case analysis has been an attractive method to handle the missing data due to its simplicity. In adopting this strategy, only subjects with complete data are included for analysis, while subjects with missing data are excluded.
MI is widely applied to missing data problems. Rubin [18] described MI as a three-step process: 1) replace each missing value with a set of plausible values that represent the uncertainty about the right value to impute; 2) analyze the multiple imputed datasets independently using complete-data methods; and 3) combine the results from the multiple analyses, which allows the uncertainty regard-ing the imputation to be taken into account.
The standard MI using logistic regression method is now described in detail. The Within-cluster MI strategy is consists of applying the standard MI method to im-pute missing data for each cluster independently.
Standard multiple imputation using logistic regression is implemented through the following steps:
First, fit a logistic regression using the observed out-come and covariates to obtain the posterior predictive distribution of the parameters:
logit Prð ðyobs¼1ÞÞ ¼β0þβ1x1þ⋯þβkxk;
whereyobsis the observed binary outcome of a subject,xi,i = 1,. . .,k, denotes theithindividual or cluster-level covari-ate of the corresponding subject (two covaricovari-ates are included in this study: treatment group and the variable associated with the missingness),β= (β0,β1,. . .,βk) denotes the regression coefficients. The regression parameter
esti-mates ^β¼ ^β0;^β1;. . .;^βk
and the associated covariance matrixVare obtained to construct the posterior distribu-tion of the parameters.
Second, draw new parameters β˜¼ β˜0;β˜1;. . .;β˜k
from the posterior distribution, where β˜¼^βþVh0Z;Vh0 is the upper triangular matrix in the Cholesky decomposition,
V=Vh0Vh, and Z is a vector ofk+1 independent random Normal variates.
Third, for each subject with a missing outcome
ymis and observed covariates x1,. . .,xk, compute p¼
expðβ˜0þβ˜1x1⋯þβ˜kxkÞ 1þexpðβ˜0þβ˜1x1⋯þβ˜kxkÞ
as the expected probability of
ymis= 1.
Fourth, draw a random Uniform variate u, 0≤u≤1. If u<p, then imputeymis= 1, otherwise, imputeymis= 0.
The above steps imply two assumptions: first, sub-jects are independent, which essentially ignores the similarity of subjects from the same cluster and; sec-ond, the missing data are imputed based on the PA treatment effect.
Combination of results from different imputed data sets SupposeM sets of imputed values are generated.M esti-mates of the treatment effects β(1),β(2),. . ., andβ(M) with corresponding variance estimates V(1),V(2),. . ., and V(M) are obtained after GEE or RELR are applied to the multiple imputed datasets. The pooled treatment effect
estimate from MI is calculated as β¼ 1 M
XM m¼1β
m
ð Þ. Its
variance estimate is calculated as V ¼Wþ 1þ 1 M
B,
where W ¼ 1 M
XM m¼1V
m
ð Þ is the average
within-impu-tation variance, and B¼ 1 M1
XM m¼1 β
m
ð Þβ
2
is the
between-imputation variance. As recommended by Bar-nard and Rubin [3,19], the adjusted degree of freedom is
calculated for CRTs asvadj¼ vM1 þWVvcomvcomþþ31vcom1
1
, where
vM¼ðM1Þ 1þMMþ1WB
2
is the degree of freedom
when subjects are assumed to be independent, andvcomis the degree of freedom for the complete data test; for ex-ample, if there arek(k>2) clusters in each of the two study groups,vcom= 2(k−1).
Simulation study
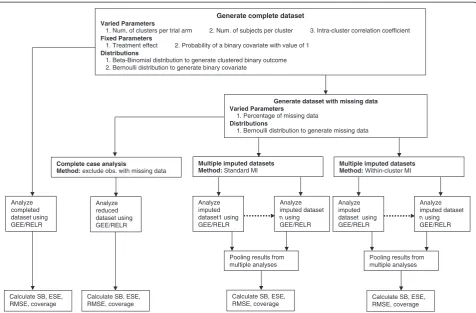
The schematic overview of the simulation study is il-lustrated in Figure 1. This simulation study is imple-mented in SAS 9.2 (Cary, NC). The mi procedure is used to implement the MI, genmod and nlmixed pro-cedures are used to estimate the intervention effect and its standard error from GEE approach and RELR respectively, and the mianalyze procedure is used to obtain the pooled estimate and its standard error across multiple imputed datasets. For nlmixed procedure, max-imum likelihood estimation via adaptive Gaussian quadra-ture and a dual quasi-Newton optimization algorithm are used.
S-design and L-design, which refer to the design settings of CRTs with a small and a large number of clusters per arm, respectively. Design parameters for CRTs in this simulation study are guided by the empirical findings that larger values of intracluster correlation coefficient tend to be associated with studies having a small number of parti-cipants within each cluster [21]. The choices of these para-meters are:
(1) For CRTs with 5 clusters per arm (S-design) and 500 subjects per cluster, ICC was set to be 0.001, 0.01 or 0.05.
(2) For CRTs with 20 clusters per arm (L-design) and 50 subjects per cluster, ICC was set to be 0.01, 0.05, or 0.1.
(3) For CRTs with 30 clusters per arm (L-design) and 30 subjects per cluster, ICC was set to be 0.05, 0.1, or 0.2.
Only two-arm, balanced, and completely randomized CRTs are considered in this study. The clustered bi-nomial responses are generated using a beta-bibi-nomial distribution [22]. The prevalence of outcome for
intervention and control arms is assumed to be 30% and 40% respectively. In addition, another binary covariate is generated, which has an equal chance of taking the value of 0 or 1 and is independent of the intervention and the out-come. For any percentage of missing data, we consider that subjects with value of 1 for this binary covariate are 1.3 times more likely to have missing outcome than subjects with a value of 0 for this covariate. For each combination of design parameters, we generate 1000 replications to achieve enough precision for estimating treatment effect [23]. Choices of the percentage of missing binary outcome are 0% (complete data), 15%, and 30%. We generate 5 replace-ments for each of the missing data.
Four quantities are chosen to evaluate the performance of GEE method and RELR: 1) standardized bias calculated
as Average of estimatesstandard deviation of estimatesparameter ; 2) root mean squared error
(RMSE) defined as
ffiffiffiffiffiffiffiffiffiffiffiffiffiffiffiffiffiffiffiffiffiffiffiffiffiffiffiffiffi
Eβ ^ββ
2
s
, where ^β andβare the estimated treatment effect and its true value respect-ively; 3) coverage probability, which is the proportion of times that the nominal 95% confidence interval contains Generate complete dataset
Varied Parameters
1. Num. of clusters per trial arm 2. Num. of subjects per cluster 3. Intra-cluster correlation coefficient
Fixed Parameters
1. Treatment effect 2. Probability of a binary covariate with value of 1
Distributions
1. Beta-Binomial distribution to generate clustered binary outcome 2. Bernoulli distribution to generate binary covariate
Generate dataset with missing data Varied Parameters
1. Percentage of missing data
Distributions
1. Bernoulli distribution to generate missing data
Calculate SB, ESE, RMSE, coverage
Multiple imputed datasets Method: Standard MI
Analyze imputed dataset1 using GEE/RELR
Pooling results from multiple analyses
Calculate SB, ESE, RMSE, coverage
Multiple imputed datasets Method: Within-cluster MI
Analyze imputed dataset n using GEE/RELR
Analyze imputed dataset using GEE/RELR
Analyze imputed dataset n using GEE/RELR
Pooling results from multiple analyses
Calculate SB, ESE, RMSE, coverage
Calculate SB, ESE, RMSE, coverage
Complete case analysis
Method: exclude obs. with missing data
Analyze reduced dataset using GEE/RELR Analyze
completed dataset using GEE/RELR
the true treatment effect across all simulation replications; and 4) empirical standard error of the treatment effect cal-culated as the average of standard errors of the estimated treatment effects across all simulation replications.
Results
Empirical standard error
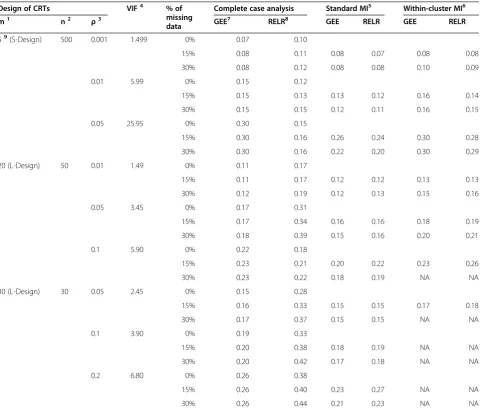
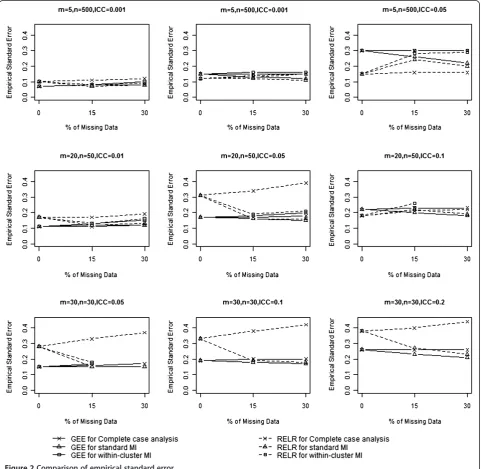
The empirical standard errors from GEE method and RELR for different design scenarios are presented in
Table 1 and Figure 2. When complete case analysis was used to handle missing data, empirical standard errors from GEE and RELR for all designs of CRTs increased with the increasing percentage of missing data. The magnitude of increase for the GEE method depended on the VIF of CRTs: the larger the VIF, the smaller amount of increase. In contrast, the magnitude of increase for the RELR depended on the cluster size: the smaller the cluster size, the larger amount of increase.
Table 1 Comparison of empirical standard error
Design of CRTs VIF4 % of
missing data
Complete case analysis Standard MI5 Within-cluster MI6
m1 n2 ρ3 GEE7 RELR8 GEE RELR GEE RELR
59(S-Design) 500 0.001 1.499 0% 0.07 0.10
15% 0.08 0.11 0.08 0.07 0.08 0.08
30% 0.08 0.12 0.08 0.08 0.10 0.09
0.01 5.99 0% 0.15 0.12
15% 0.15 0.13 0.13 0.12 0.16 0.14
30% 0.15 0.15 0.12 0.11 0.16 0.15
0.05 25.95 0% 0.30 0.15
15% 0.30 0.16 0.26 0.24 0.30 0.28
30% 0.30 0.16 0.22 0.20 0.30 0.29
20 (L-Design) 50 0.01 1.49 0% 0.11 0.17
15% 0.11 0.17 0.12 0.12 0.13 0.13
30% 0.12 0.19 0.12 0.13 0.15 0.16
0.05 3.45 0% 0.17 0.31
15% 0.17 0.34 0.16 0.16 0.18 0.19
30% 0.18 0.39 0.15 0.16 0.20 0.21
0.1 5.90 0% 0.22 0.18
15% 0.23 0.21 0.20 0.22 0.23 0.26
30% 0.23 0.22 0.18 0.19 NA NA
30 (L-Design) 30 0.05 2.45 0% 0.15 0.28
15% 0.16 0.33 0.15 0.15 0.17 0.18
30% 0.17 0.37 0.15 0.15 NA NA
0.1 3.90 0% 0.19 0.33
15% 0.20 0.38 0.18 0.19 NA NA
30% 0.20 0.42 0.17 0.18 NA NA
0.2 6.80 0% 0.26 0.38
15% 0.26 0.40 0.23 0.27 NA NA
30% 0.26 0.44 0.21 0.23 NA NA
Empirical standard error is defined as the average of standard errors of the estimated treatment effects across all simulation replications. The empirical standard errors obtained when 0% data are missing are considered as references for comparing with those obtained when 15% or 30% data are missing.
Note:
1. m: Number of clusters per trial arm. 2. n: Number of subjects per cluster.
3.ρ: intracluster correlation coefficient; 4. VIF: Variance inflation factor, i.e. 1+(m-1)ρ; 5. Standard MI: Standard multiple imputation using logistic regression method.
6. Within-cluster MI: Within-cluster multiple imputation using logistic regression method, which is not applicable (NA) for some L-design of cluster randomized trials.
7. GEE: Generalized estimating equations. 8. RELR: Random-effects logistic regression.
When standard MI was used to impute missing data, empirical standard errors from the GEE method were acceptable for CRTs with VIF<3 in terms of yielding similar or slightly larger empirical standard errors com-pared to those obtained from analyzing the complete data. However, they were underestimated for CRTs with VIF≥3. This is because standard MI strategy assumes data are independent, and cluster effect may be safely ignored for CRTs with VIF<3 when imputing missing data. In contrast, empirical standard errors from RELR were not similar as those obtained from analyzing complete data. This is because that the imputed datasets were obtained based on the estimated PA treatment
effect and corresponding underestimated standard error, which led to a difference between the standard error estimated from RELR based on the imputed datasets and that based on the complete data.
Within-cluster MI was not applicable for L-design of CRTs, which usually had a small cluster size, since all out-comes in a cluster were missing or all observed outout-comes had identical values, which caused the imputation proced-ure to fail. In the cases when within-cluster MI was applic-able and used to impute the missing data, empirical standard errors from GEE method were acceptable for CRTs with VIF≥3; however, for CRTs with VIF<3, empirical standard errors were inflated. This is because
when within-cluster MI was used to impute the missing data, the clustering effects were accounted for by imputing missing data based on the observed information within the same cluster as the missing data, therefore, the empirical standard errors for GEE were acceptable for CRTs with VIF≥3. The empirical standard errors from RELR were acceptable only when the cluster size is large (>50) and the ICC is small (≤0.01).
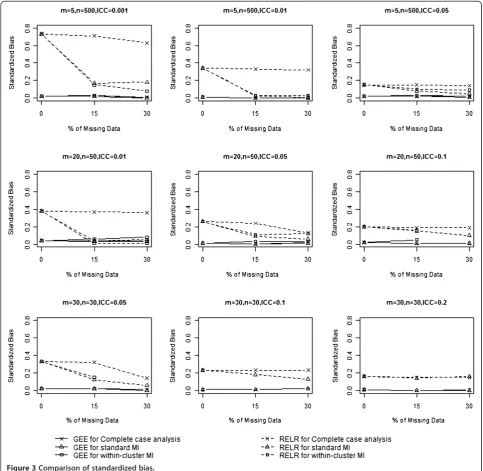
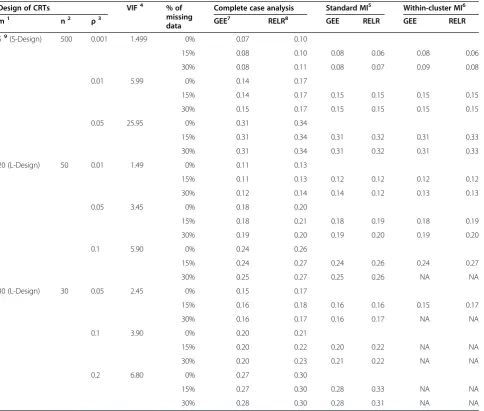
Standardized bias
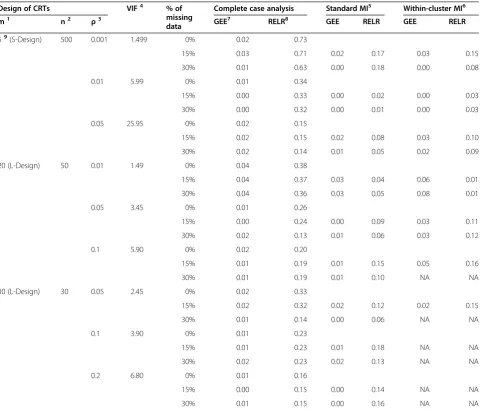
The standardized biases from GEE method and RELR for different design scenarios are presented in Table 2 and Figure 3. Standardized biases from GEE method were close to zero for any design settings and percentage of missing data, no matter which missing data strategy was used. In contrast, standardized biases for RELR were rela-tively larger. When complete case analysis was used to
Table 2 Comparison of standardized bias
Design of CRTs VIF4 % of
missing data
Complete case analysis Standard MI5 Within-cluster MI6
m1 n2 ρ3 GEE7 RELR8 GEE RELR GEE RELR
59(S-Design) 500 0.001 1.499 0% 0.02 0.73
15% 0.03 0.71 0.02 0.17 0.03 0.15
30% 0.01 0.63 0.00 0.18 0.00 0.08
0.01 5.99 0% 0.01 0.34
15% 0.00 0.33 0.00 0.02 0.00 0.03
30% 0.00 0.32 0.00 0.01 0.00 0.03
0.05 25.95 0% 0.02 0.15
15% 0.02 0.15 0.02 0.08 0.03 0.10
30% 0.02 0.14 0.01 0.05 0.02 0.09
20 (L-Design) 50 0.01 1.49 0% 0.04 0.38
15% 0.04 0.37 0.03 0.04 0.06 0.01
30% 0.04 0.36 0.03 0.05 0.08 0.01
0.05 3.45 0% 0.01 0.26
15% 0.00 0.24 0.00 0.09 0.03 0.11
30% 0.02 0.13 0.01 0.06 0.03 0.12
0.1 5.90 0% 0.02 0.20
15% 0.01 0.19 0.01 0.15 0.05 0.16
30% 0.01 0.19 0.01 0.10 NA NA
30 (L-Design) 30 0.05 2.45 0% 0.02 0.33
15% 0.02 0.32 0.02 0.12 0.02 0.15
30% 0.01 0.14 0.00 0.06 NA NA
0.1 3.90 0% 0.01 0.23
15% 0.01 0.23 0.01 0.18 NA NA
30% 0.02 0.23 0.02 0.13 NA NA
0.2 6.80 0% 0.01 0.16
15% 0.00 0.15 0.00 0.14 NA NA
30% 0.01 0.15 0.00 0.16 NA NA
Standardized bias is defined as the difference between the expectation of the estimator and the parameter, divided by the standard deviation of the estimator. Standardized biases obtained when 0% data are missing are considered as references for comparing with those obtained when 15% or 30% data are missing. Note:
1. m: Number of clusters per trial arm. 2. n: Number of subjects per cluster.
3.ρ: Intracluster correlation coefficient; 4. VIF: Variance inflation factor, i.e. 1+(m-1)ρ; 5. Standard MI: Standard multiple imputation using logistic regression method.
6. Within-cluster MI: Within-cluster multiple imputation using logistic regression method, which is not applicable (NA) for some L-design of cluster randomized trials.
7. GEE: Generalized estimating equations. 8. RELR: Random-effects logistic regression.
handle missing data, standardized biases for RELR did not change substantially with increasing percentage of missing data for S-design with a large design effect (VIF>3) and L-design with a large ICC (ICC≥0.1); however, standardized biases changed largely with an increasing percentage of missing data for other scenarios. When missing data were imputed by standard MI or within-cluster MI prior to statistical analysis, standardized biases for RELR were much smaller than those obtained by analyzing complete data (i.e. 0% missing data) using the same statistical method.
The magnitude of standardized bias was dependent on the original data structure, i.e. how the data were generated, how the missing data were handled, and which statistical model was used for analysis. As described in the previous section, the clustered binary data were generated using a beta-binomial distribution, which assumed a PA treatment effect. Since complete case analysis did not change the original data structure under the assumption of CDM, the PA and CS treat-ment effects estimated from the GEE and RELR were quite consistent with those estimated based on complete data (i.e. datasets without missing values).
The relationship between the PA and the CS treatment effects estimated from GEE method and RELR respect-ively still held; however, when either standard MI or within-cluster MI was used, the imputed values were obtained based on the estimated PA treatment effect and corresponding underestimated standard error, which largely distorted the CS treatment effects esti-mated from RELR compared with those estiesti-mated based on complete data.
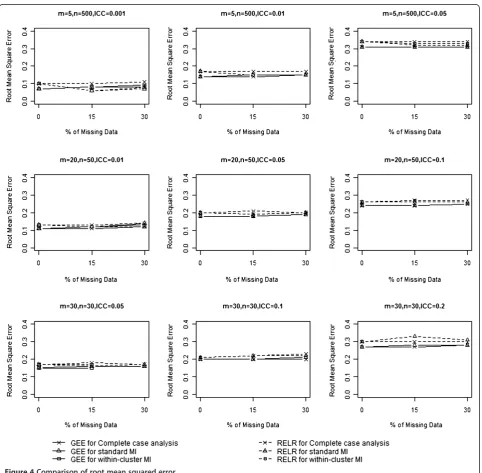
Root mean squared error
The RMSE incorporates both the variance of the esti-mator and its bias, and measures the overall accuracy of the point estimator. RMSEs from GEE method and RELR for different design scenarios are presented in Table 3 and Figure 4. When complete case analysis was used to handle missing data, RMSEs from GEE method were very similar to those obtained based on complete data for all designs of CRTs with no larger than 15%
Table 3 Comparison of root mean squared error
Design of CRTs VIF4 % of
missing data
Complete case analysis Standard MI5 Within-cluster MI6
m1 n2 ρ3 GEE7 RELR8 GEE RELR GEE RELR
59(S-Design) 500 0.001 1.499 0% 0.07 0.10
15% 0.08 0.10 0.08 0.06 0.08 0.06
30% 0.08 0.11 0.08 0.07 0.09 0.08
0.01 5.99 0% 0.14 0.17
15% 0.14 0.17 0.15 0.15 0.15 0.15
30% 0.15 0.17 0.15 0.15 0.15 0.15
0.05 25.95 0% 0.31 0.34
15% 0.31 0.34 0.31 0.32 0.31 0.33
30% 0.31 0.34 0.31 0.32 0.31 0.33
20 (L-Design) 50 0.01 1.49 0% 0.11 0.13
15% 0.11 0.13 0.12 0.12 0.12 0.12
30% 0.12 0.14 0.14 0.12 0.13 0.13
0.05 3.45 0% 0.18 0.20
15% 0.18 0.21 0.18 0.19 0.18 0.19
30% 0.19 0.20 0.19 0.20 0.19 0.20
0.1 5.90 0% 0.24 0.26
15% 0.24 0.27 0.24 0.26 0.24 0.27
30% 0.25 0.27 0.25 0.26 NA NA
30 (L-Design) 30 0.05 2.45 0% 0.15 0.17
15% 0.16 0.18 0.16 0.16 0.15 0.17
30% 0.16 0.17 0.16 0.17 NA NA
0.1 3.90 0% 0.20 0.21
15% 0.20 0.22 0.20 0.22 NA NA
30% 0.20 0.23 0.21 0.22 NA NA
0.2 6.80 0% 0.27 0.30
15% 0.27 0.30 0.28 0.33 NA NA
30% 0.28 0.30 0.28 0.31 NA NA
Root mean squared error is defined as the square root of the mean squared error, which is the average squared difference between the estimated treatment effect and the true parameter. The root mean squared errors obtained when 0% data are missing are considered as references for comparing with those obtained when 15% or 30% data are missing.
Note:
1. m: Number of clusters per trial arm. 2. n: Number of subjects per cluster.
3.ρ: Intracluster correlation coefficient; 4. VIF: Variance inflation factor, i.e. 1+(m-1)ρ; 5. Standard MI: Standard multiple imputation using logistic regression method.
6. Within-cluster MI: Within-cluster multiple imputation using logistic regression method, which is not applicable (NA) for some L-design of cluster randomized trials.
7. GEE: Generalized estimating equations. 8. RELR: Random-effects logistic regression.
missing data. With 30% missing values, the RMSEs from GEE were larger than those obtained based on analyzing complete data for the design of CRTs with a small design effect (VIF<3). Similarly, RMSEs from RELR were very similar to those obtained based on complete data for all designs of CRTs with no larger than 15% missing data; however, with 30% missing values, RMSEs from RELR were much larger than those obtained based on complete data for the design of CRTs with a small design effect (VIF<3) and a small cluster size (<50).
When standard MI was used to impute missing data, RMSEs from GEE method increased with the percent-age of missing data. With no larger than 15% missing data, the increase of RMSEs from GEE compared to those obtained based on complete data was not substan-tial. When the amount of missing values increased to 30%, RMSEs from the GEE method increased substan-tially for CRTs with a small design effect (VIF<3). In contrast, RMSEs from RELR method were much smaller than those obtained from analyzing complete data for most of the design scenarios. We should note that the
small RMSE for RELR here was not an indication of more accurate or precise estimate for the treatment ef-fect, but rather a result of biased CS treatment effects and the corresponding underestimated standard error.
When within-cluster MI was used to impute missing data, the same pattern for RMSEs from both GEE and RELR was observed as when standard MI was used to impute missing data.
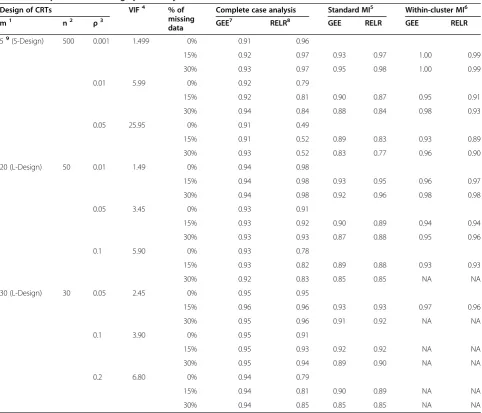
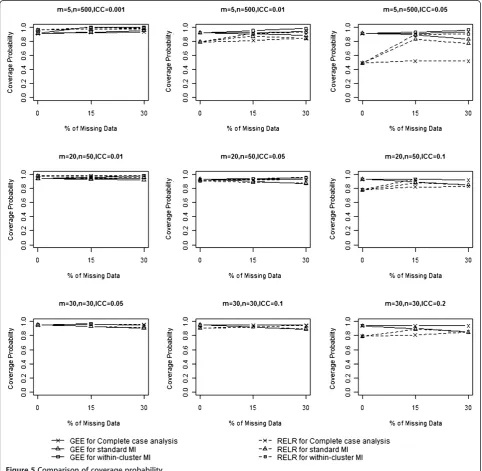
Coverage probability
Table 4 and Figure 5 show the coverage probabilities from GEE method and RELR for different designs of CRTs. When complete case analysis was used to handle missing data, the coverage probabilities from GEE method were at least 0.90 for all the scenarios consid-ered in this paper. The coverage probabilities from RELR were at least 0.95 for design of CRTs with a small design
Table 4 Comparison of coverage probability
Design of CRTs VIF4 % of
missing data
Complete case analysis Standard MI5 Within-cluster MI6
m1 n2 ρ3 GEE7 RELR8 GEE RELR GEE RELR
59(S-Design) 500 0.001 1.499 0% 0.91 0.96
15% 0.92 0.97 0.93 0.97 1.00 0.99
30% 0.93 0.97 0.95 0.98 1.00 0.99
0.01 5.99 0% 0.92 0.79
15% 0.92 0.81 0.90 0.87 0.95 0.91
30% 0.94 0.84 0.88 0.84 0.98 0.93
0.05 25.95 0% 0.91 0.49
15% 0.91 0.52 0.89 0.83 0.93 0.89
30% 0.93 0.52 0.83 0.77 0.96 0.90
20 (L-Design) 50 0.01 1.49 0% 0.94 0.98
15% 0.94 0.98 0.93 0.95 0.96 0.97
30% 0.94 0.98 0.92 0.96 0.98 0.98
0.05 3.45 0% 0.93 0.91
15% 0.93 0.92 0.90 0.89 0.94 0.94
30% 0.93 0.93 0.87 0.88 0.95 0.96
0.1 5.90 0% 0.93 0.78
15% 0.93 0.82 0.89 0.88 0.93 0.93
30% 0.92 0.83 0.85 0.85 NA NA
30 (L-Design) 30 0.05 2.45 0% 0.95 0.95
15% 0.96 0.96 0.93 0.93 0.97 0.96
30% 0.95 0.96 0.91 0.92 NA NA
0.1 3.90 0% 0.95 0.91
15% 0.95 0.93 0.92 0.92 NA NA
30% 0.95 0.94 0.89 0.90 NA NA
0.2 6.80 0% 0.94 0.79
15% 0.94 0.81 0.90 0.89 NA NA
30% 0.94 0.85 0.85 0.85 NA NA
Coverage probability is defined as the proportion of times that the nominal 95% confidence interval contains the true treatment effect across all simulation replications. Coverage probabilities obtained when 0% data are missing are considered as references for comparing with those obtained when 15% or 30% data are missing.
Note:
1. m: Number of clusters per trial arm. 2. n: Number of subjects per cluster.
3.ρ: Intra-cluster correlation coefficient; 4. VIF: Variance inflation factor, i.e. 1+(m-1)ρ; 5. Standard MI: Standard multiple imputation using logistic regression method.
6. Within-cluster MI: Within-cluster multiple imputation using logistic regression method, which is not applicable (NA) for some L-design of cluster randomized trials.
7. GEE: Generalized estimating equations. 8. RELR: Random-effects logistic regression.
effect (VIF<3) but were very low for CRTs with a large design effect (VIF≥3).
When standard MI was used to impute missing data, coverage probabilities from GEE method increased for CRTs with a small design effect but decreased for CRTs with a large design effect. Coverage probabilities from RELR increased for almost all designs of CRTs compared to those obtained by analyzing complete data using the same statistical analysis method. When within-cluster MI was used to impute missing data, the same pattern for the coverage probabilities from both GEE and RELR was
observed as when standard MI was used to impute missing data. It should be noted that the higher coverage from RELR when either standard or within-cluster MI strategy was applied prior to the analysis was not an indication of high efficiency, but rather a result of biased CS treatment effects and the corresponding underestimated standard effort.
We noticed that the coverage probabilities from GEE were larger than the nominal level when within-cluster MI is applied prior to the analysis for CRTs with a small design effect and a large percentage of missing data. This
is because within-cluster MI tends to provide larger standard errors of the estimated treatment effects (i.e. wider 95% confidence interval).
Convergence problems
For the GEE method, at most 1 out of 1000 simulated datasets with S-design could not converge to a solution because they either encountered a non-positive definite matrix in the iterations or because there was no vari-ation between the clusters in each arm. No convergence problems occurred for the simulated datasets based on the L-design. Lack of convergence was encountered more often for RELR than GEE. About 10 out of 1000 simulated datasets for some designs of CRTs could not converge for RELR due to negative estimates of between-cluster variance component during iteration.
Discussion
In this paper, we compared the accuracy and efficiency of PA and CS models through a simulation study, in par-ticular, the GEE method and the RELR respectively, for analyzing binary outcomes in CRTs with missing data. Results from the present simulation study show that under the assumption of CDM, the GEE method per-forms well as long as an appropriate strategy is applied to handle missing data based on the percentage of miss-ing data and the design of CRTs. The appropriate strat-egy in this instance is using complete case analysis for any CRTs with a small percentage of missing outcomes (<15%), using standard MI to impute missing outcomes for CRTs with a small design effect (VIF<3), or within-cluster MI to impute missing outcomes for CRTs with a large design effect (VIF≥3) and cluster size (>50). In con-trast, the RELR performs poorly when either standard or within-cluster MI strategy is used to impute missing data prior to the analysis.
Results from the present comprehensive simulation study also imply that MI using random-effects logistic regression may not appropriate for imputing binary out-comes in CRTs. This is because that if the underlying data structure assumes a PA treatment effect, the MI using random-effects logistic regression, which impute missing data based on the CS treatment effect, may dis-tort the original data structure and lead to invalid infer-ence. Moreover, the convergence problems will greatly hinder the application of this method for imputing miss-ing binary data. This implication seems to be in contra-diction with current literature: for example, Taljaard et al. [24] proposed mixed-effects regression imputation strategies to handle missing continuous outcomes in CRTs. Results from that study showed that the mixed-effects regression imputation strategy takes into account the between-cluster variance and therefore provides valid inferences for the treatment effect. In a previous
study [11], we proposed MI using random-effects logistic regression to impute missing binary outcomes in CRTs and found that this strategy may be valid for imputing binary outcomes in CRTs. These two studies reached a different conclusion from the present simulation study since the mixed-effects regression imputation strategy by Taljaard et al.is used to handle the missing continuous outcome, and the MI using random-effects logistic regression by Maet al.is based on a real dataset which has relatively large ICC, number of clusters per arm, and number of subjects per cluster, which limited the generalizability of their conclusions to more general settings.
MI has been accepted as a solution for missing data problems in many settings. Both GEE and RELR are commonly used for analyzing binary data in CRTs [1]. Results from this paper also imply that the choice of statistical analysis method and imputation method should reflect the same data structure as the inherent structure of the original data; otherwise, valid or improved inferences will not be achieved. For research-ers with thorough undresearch-erstandings of the GEE method, RELR, CRTs, and the MI, results from this present study may not entirely surprising; however, the application of imputation and analysis methods in practice for CRTs does not reflect this finding. Some CRTs used mixed effects models for statistical analysis, but fixed-effects for clusters in imputation [25-28]. In some other CRTs [29-31], no details were provided on which imputation procedure was applied. Findings from this simulation study urge caution on the use of RELR in the analysis of data from CRTs when missing binary outcomes are imputed by either standard or within-cluster MI strat-egy, thus improve the statistical practice in epidemio-logical research.
considered; therefore, the conclusion from this paper regarding to the performance of RELR may not be ap-plicable when missing data are handled using likelihood based analyses or other imputation methods. Further re-search may investigate the scenarios when missing data are handled by likelihood based analysis. Fourth, MI strategies investigated in this project were implemented using SAS. Other software packages, such as STATA and MLwiN, also provide MI procedures or macros. We think that similar results may be expected if the proced-ure in STATA is used since it generates imputed values from a prediction model using logistic regression — which is similar to the MI procedure for imputing miss-ing binary data in SAS; while different results may be expected if the macros in MLwiN is used — because it generates imputed values using the random-effects logis-tic regression model. Finally, results from GEE and RELR are different since the two models estimate differ-ent parameters as outlined in the previous section. The intervention effect in the simulation has a population-average interpretation since the beta-binomial model is used to specify an overall unconditional probability within each trial arm, which gives preference to the GEE model.
Conclusions
Under the assumption of CDM, GEE method performs well as long as an appropriate missing data strategy is adopted based on the design of CRTs and the percentage of missing data. In contrast, RELR dose not perform well when either standard or within-cluster MI strategy is ap-plied to impute missing data prior to the analysis.
Abbreviation
CRTs: Cluster randomized trials; ICC: Intracluster correlation coefficient; VIF: Variance inflation factor; PA: Population-averaged; CS: Cluster-specific; GEE: Generalized estimating equations; RELR: Random-effects logistic regression; RMSE: Root mean squared error; CDM: Covariate dependent missingness.
Competing interests
The authors declare that they have no competing interests.
Authors’contributions
JM, PR, JB, and LT conceived the research question. JM conducted literature review, designed and implemented the simulation study, composed the initial draft of the manuscript, and revised the manuscript. LT oversaw the design and implementation of the study, revised the manuscript. PR and JB provided assistance with design of the simulation study. All authors read and approved the final manuscript.
Acknowledgement
This study was supported in part by funds from the Canadian Network and Centre for Trials Internationally (CANNeCTIN) program and the Drug Safety and Effectiveness Cross-Disciplinary Training (DSECT) program in the form of training awards for the first author. No additional external funding received for this study. Dr. Lehana Thabane is a clinical trials mentor for the Canadian Institutes of Health Research (CIHR). Dr. Parminder Raina holds a Raymond and Margaret Labarge Chair in Research and Knowledge Application for Optimal Aging, and the Canada Research Chair in GeroScience.
Author details 1
Department of Clinical Epidemiology and Biostatistics, McMaster University, Hamilton, Ontario, Canada.2McMaster University Evidence-based Practice
Center, Hamilton, Ontario, Canada.3Biostatistics Unit/FSORC 3rd Floor Martha, Room H325, St. Joseph's Healthcare Hamilton, 50 Charlton Avenue East, Hamilton, Ontario L8N 4A6, Canada.4Centre for Evaluation of Medicines, St Joseph’s Healthcare, Hamilton, Ontario, Canada.5Population Health
Research Institute, Hamilton Health Sciences, Hamilton, Ontario, Canada.
Received: 16 August 2012 Accepted: 14 January 2013 Published: 23 January 2013
References
1. Donner A, Klar N:Design and Analysis of Cluster Randomization Trials in Health Research. New York: John Wiley & Sons; 2000.
2. Donner A, Brown KS, Brasher P:A methodological review of non-therapeutic intervention trials employing cluster randomization, 1979–1989.Int J Epidemiol1990,19(4):795–800.
3. Little RJA, Rubin DB:Statistical analysis with missing data. 2nd edition. New-York: John Wiley & Sons; 2002.
4. Groenwold RH, Donders AR, Roes KC, Harrell FE Jr, Moons KG:Dealing with missing outcome data in randomized trials and observational studies.
Am J Epidemiol2012,175(3):210–217.
5. Liublinska V, Rubin DB:Re: "dealing with missing outcome data in randomized trials and observational studies.Am J Epidemiol2012, 176(4):357–358.
6. Ma J, Raina P, Beyene J, Thabane L:Comparing the performance of different multiple imputation strategies for missing binary outcomes in cluster randomized trials: a simulation study.J Open Access Med Stat2012, 2:93–103.
7. Zeger SL, Liang KY, Albert PS:Models for longitudinal data: a generalized estimating equation approach.Biometrics1988,44:1049–1060.
8. Austin PC:A comparison of the statistical power of different methods for the analysis of cluster randomization trials with binary outcomes.
Stat Med2007,26:3550–3565.
9. Bellamy SL, Gibbard R, Hancock L, Howley P, Kennedy B, Klar N, Lipsitz S, Ryan L:Analysis of dichotomous outcome data for community intervention studies.Stat Methods Med Res2000,9:135–159.
10. Ukoumunne OC, Carlin JB, Gulliford MC:A simulation study of odds ratio estimation for binary outcomes from cluster randomized trials.Stat Med 2007,26(18):3415–3428.
11. Ma J, Akhtar-Danesh N, Dolovich L, Thabane L:CHAT investigators. Imputation strategies for missing binary outcomes in cluster randomized trials.BMC Med Res Methodol2011,11:18.
12. Liang K, Zeger S:Longitudinal data analysis using generalized linear models.Biometrika1986,73(1):13–22.
13. Murray DM, Varnell SP, Blitstein JL:Design and analysis of group-randomized trials: a review of recent methodological developments.Am J Public Health2004,94:423–432.
14. Mancl LA, DeRouen TA:A covariance estimator for GEE with improved small-sample properties.Biometrics2001,57:126–134.
15. McCulloch CE, Searle SR:Generalized, Linear and Mixed Models. New York: John Wiley & Sons Inc; 2001.
16. Feng Z, Diehr P, Peterson A, McLerran D:Selected statistical issues in group randomized trials.Annu Rev Public Health2001,22:167–187. 17. Neuhaus JM:Statistical methods for longitudinal and clustered designs
with binary responses.Stat Methods Med Res1992,1:249–273. 18. Rubin DB:Multiple imputation after 18+ years.J Am Stat Assoc1996,
91:473–489.
19. Barnard J, Rubin DB:Small-sample degrees of freedom with multiple imputation.Biometrika1999,86:949–955.
20. Eldridge SM, Ashby D, Feder GS, Rudnicka AR, Ukoumunne OC:Lessons for cluster randomized trials in the twenty-first century: A systematic review of trials in primary care.Clin Trials2004,1(1):80–90.
21. Donner A:An empirical study of cluster randomization.Int J Epidemiol 1982,11(3):283–286.
22. Lee EW, Bubin N:Estimation and sample size considerations for clustered binary responses.Stat Med1994,13:1241–1252.
24. Taljaard M, Donner A, Klar N:Imputation strategies for missing continuous outcomes in cluster randomized trials.Biom J2008,50(3):329–345. 25. Brown EC, Graham JW, Hawkins JD, Arthur MW, Baldwin MM, Oesterle S,
Briney JS, Catalano RF, Abbott RD:Design and analysis of the community youth development study longitudinal cohort sample.Eval Rev2009, 33:311–324.
26. Hawkins JD, Brown EC, Oesterle S, Arthur MW, Abbott RD, Catalano RF:Early effects of communities that care on targeted risks and initiation of delinquent behavior and substance use.J Adolesc Health2008,43:15–22. 27. Hawkins JD, Oesterle S, Brown EC, Arthur MW, Abbott RD, Fagan AA,
Catalano RF:Results of a type 2 translational research trial to prevent adolescent drug use and delinquency.Arch Pediatr Adolesc Med2009, 163:789–798.
28. Clark NM, Shah S, Dodge JA, Thomas LJ, Andridge RR, Awad D, Little RJA: An evaluation of asthma interventions for preteen students.J Sch Health 2010,80:80–87.
29. French SA, Story M, Fulkerson JA, Himes JH, Hannan P, Neumark-Sztainer D, Ensrud K:Increasing weight-bearing physical activity and calcium-rich foods to promote bone mass gains among 9–11 year old girls: outcomes of the cal-girls study.Int J Behav Nutr Phys Act2005,2:8. 30. Pate RR, Ward DS, Saunders RP, Felton G, Dishman RK, Dowda M:
Promotion of physical activity among high-school girls: a randomized controlled trial.Am J Public Health2005,95:1582–1587.
31. Ganz PA, Farmer MM, Belman MJ, Garcia CA, Streja L, Dietrich AJ, Winchell C, Bastani R, Kahn KL:Results of a randomized controlled trial to increase colorectal cancer screening in a managed care health plan.Cancer2005, 104:2072–2083.
doi:10.1186/1471-2288-13-9
Cite this article as:Maet al.:Comparison of population-averaged and cluster-specific models for the analysis of cluster randomized trials with missing binary outcomes: a simulation study.BMC Medical Research Methodology201313:9.
Submit your next manuscript to BioMed Central and take full advantage of:
• Convenient online submission
• Thorough peer review
• No space constraints or color figure charges
• Immediate publication on acceptance
• Inclusion in PubMed, CAS, Scopus and Google Scholar
• Research which is freely available for redistribution