Aerodynamic optimisation of Formula student vehicle using computational fluid dynamics
Frankie F. Jackson, University of Huddersfield
[email protected] Accepted date: 08/11/2017 Published date: 21/02/2018
Abstract
This work aims to improve the external aerodynamic characteristics of the 2017 University of Huddersfield Formula student vehicle. To improve dynamic
performance in the student events, a multiple-element rear wing was developed, which incorporated adjustable elements to constitute a drag reduction system (DRS). A numerical modelling approach was adopted to produce a suitable design. A
simplified model of the vehicle was created to obtain baseline coefficients of lift (CL) and drag (CD). The rear wing was optimised to find the peak configuration generating maximum downforce. The results show that the incorporated rear wing improved the vehicle’s CL from 0.21 acting in the positive Y axis (lift) to 1.15 acting in the negative Y axis (downforce), whereas the CD increased from 0.71 to 1.21. However, the DRS configuration reduced the CD to 0.79. Using the obtained lift and drag coefficients, vehicle performance was estimated, such as maximum cornering speed, straight-line top speed and straight-line acceleration capabilities. The rear wing improved the theoretical maximum cornering speed by 3.1% for a corner radius of 13 m. The DRS increased the theoretical top speed by 18.2% compared to a fixed wing
predictions of the acceleration event time, which were compared to the track results from the 2017 Hungary student event. The results showed a 97% similarity.
Keywords
Vehicle aerodynamics, Formula student, CFD, rear wing, drag reduction system
Acknowledgments
Introduction
The Formula SAE (Society of Automotive Engineers) is a motorsport event first introduced in 1981 (IMechE, 2017a) that consists of university teams designing and building single-seated race cars to compete in a series of events. Teams are
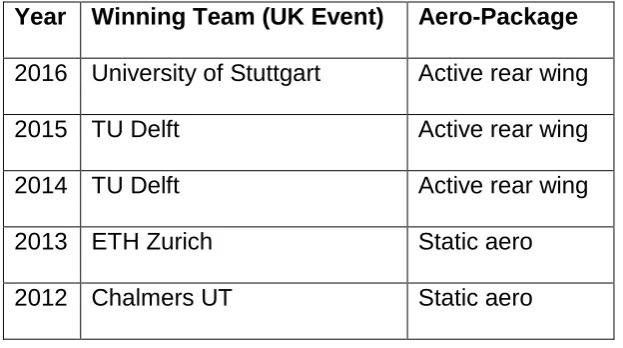
expected to compete in two main areas. Static events comprise design cost and sustainability with business presentation, technical and safety scrutineering, tilt test and brake and noise test. Dynamic events comprise skid pad (figure of eight), sprint, acceleration, endurance and fuel economy (IMechE, 2017b). Teams are awarded points for their performance in each of these categories. To achieve the highest points possible, each aspect of the car must be designed with performance and cost taken into consideration. Aerodynamics in motorsport is now a fundamental aspect of producing a competitive design. The successful implementation of aerodynamic devices in vehicles, first seen in 1960 (Katz, 1995), has enabled increased cornering speeds and subsequent decreased lap times. In the context of the student event, the winning teams from 2012 to 2016 all had aerodynamic devices fitted to their vehicles (Table 1) and, therefore, the 2017 University of Huddersfield team had decided to adopt its first full aerodynamic package. The rules governing the student events also allow relative aerodynamic design freedom, such that movable aerodynamic devices are still permitted, allowing the incorporation of DRS. See Appendix 1 for the
Table 1
Previous winning teams of the Formula student UK event from 2012 to 2016. Retrieved from http://www.imeche.org/events/formula-student/previous-events
Year Winning Team (UK Event) Aero-Package 2016 University of Stuttgart Active rear wing 2015 TU Delft Active rear wing 2014 TU Delft Active rear wing 2013 ETH Zurich Static aero 2012 Chalmers UT Static aero
Methods for developing aerodynamic components can include wind tunnel testing of both scaled-down and full-size models, as well as track testing. However, this is often time and cost intensive. Due to an ongoing increase in computing performance and developments in numerical analysis, computational fluid dynamics (CFD) is becoming an ever more crucial tool in automotive design. The CFD design approach has been used by teams such as KTH - Royal Institute of Technology to aid in
designing the full vehicle aerodynamic package (Dahlberg, 2014). The work
presented in Dahlberg’s thesis used the ANSYS Fluent© CFD package to optimise
the design of the diffuser, front wing and rear wing. Additionally, Leitl and Dürnberger
(2009) used ANSYS CFX© to compare two Formula Student vehicle concepts.
The values obtained from the CFD simulations are often used to make performance predictions. Work conducted by Merkel (2013) made predictions of vehicle
The aim of the present work was to improve the aerodynamic characteristics of the 2017 Formula Student vehicle by using CFD and to describe a unique methodology to calculate traction-limited acceleration. The main objective, therefore, was to develop a multiple-element rear wing with adjustable rear elements, which could provide high levels of downforce to aid with cornering speed capability as well as having a reduced drag configuration to aid in straight-line acceleration. The CFD solver used in this work was ANSYS CFX©. ANSYS CFX© is a finite volume solver that uses an unstructured grid. In this work, Reynolds-averaged Navier–Stokes
(RANS) equations were solved with the k-ε turbulence model for the −𝜌𝜌𝑢𝑢′�������𝚤𝚤𝑢𝑢′𝚥𝚥 term
(Eq. 1).
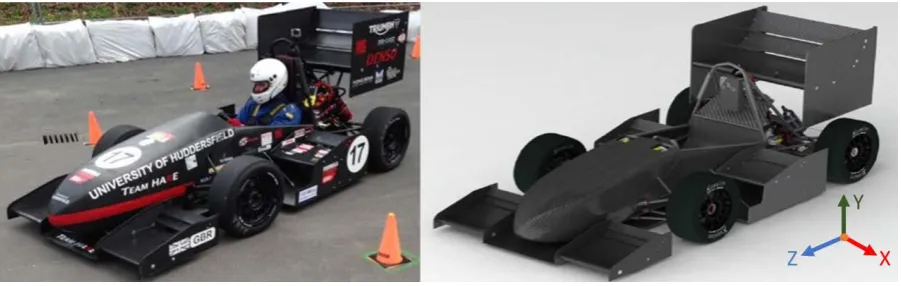
Figure 1
Final vehicle assembly with implemented aerodynamic devices (left) compared with final vehicle CAD model (right) with additional aerodynamic devices comprising; front wing, side pods and diffuser
Numerical modelling
also assumed to be negligible, and thus the problem is treated as isothermal. The governing RANS equations can be written in Cartesian tensor notation as follows:
𝜌𝜌 �𝜕𝜕𝑈𝑈𝜕𝜕𝜕𝜕�𝚤𝚤+𝑈𝑈�𝑗𝑗𝜕𝜕𝑈𝑈�𝜕𝜕𝑥𝑥𝑖𝑖 𝑗𝑗�=−
𝜕𝜕𝑃𝑃� 𝜕𝜕𝑥𝑥𝑖𝑖+
𝜕𝜕 𝜕𝜕𝑥𝑥𝑗𝑗�𝜇𝜇
𝜕𝜕𝑈𝑈�𝑖𝑖
𝜕𝜕𝑥𝑥𝑗𝑗 − 𝜌𝜌𝑢𝑢′��������𝚤𝚤𝑢𝑢′𝚥𝚥 (1)
where ρ is the density, P is the pressure, t is the time, U is the mean velocity, μ is the viscosity and x is a position vector. The last term on the right-hand side requires further modelling. This is known as the closure problem and is the subject of
turbulence modelling. In this work, the last term was modelled using the standard k-ε turbulence model as it is widely used, robust and reasonably accurate (ANSYS, 2006).
To validate the performance of a rear wing, the baseline performance of the vehicle had to be determined. A simplified 1:1 scale model was created of the 2014
University of Huddersfield Formula student vehicle. The 2014 vehicle was chosen because the current (2017) model was incomplete at the time of writing, and the 2014 model closely matched this year’s intended dimensions. The assumption was made that minor details such as suspension geometry would not greatly impact the results of the study, and these have therefore been removed from the model for simplicity and to decrease computation time. The size of the flow domain was
condition applied. This will result in zero fluid velocity at the surface. Isothermal conditions were assumed and the fluid temperature set to default 25 °C . Each study used the k-ε turbulence model with the convergence criteria set as a root mean square (RMS) residual target of 1.E-4.
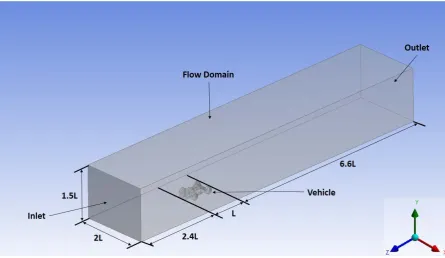
Figure 2
Flow domain and named selections used in CFD study. Flow dimensions are 4,540, 3,027, 30,270 (X, Y, Z mm)
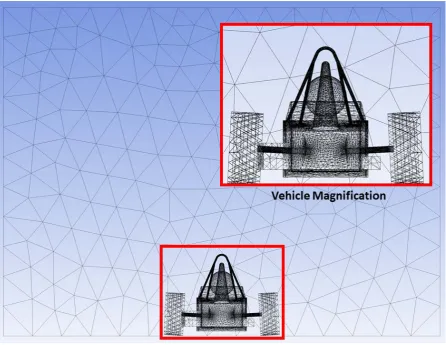
Figure 3
Final mesh corresponding to mesh independence study number 6. Magnified image of the vehicle to illustrate the application of finer mesh around areas of high
curvature, such as the roll bars and wheel axles
Multiple-element wing configuration
for such designs. As downforce is a product of area, the maximum permissible chord length (c) and span (s) of 860 mm and 920 mm respectively were used. A three-element design comprising a main three-element and two flaps was chosen as it was assumed to offer the benefits of a high lift configuration while keeping design complexity to a minimum (Figure 4). Research by Dahlberg (2014) investigated a number of high lift aerofoils and suggested that the E423 aerofoil would provide the best compromise of high lift characteristics to manufacturing ease.
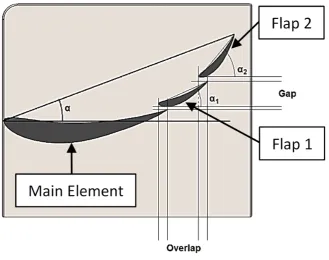
Figure 4
Configuration of multiple-element (E423) rear wing with key variables of study α1 and α2. Chord length of main element set to 540 mm, with Flap 1 & 2 set at 180 mm,
overlap of Flap 1 and Flap 2 of 26.25 mm and gap of 20 mm
timeframe, suggested values of gap and overlap of 1–4%c and 1–6%c respectively (McBeath, 2006) were used and optimisation was focused on the AOA. Suggested values of AOA of trailing element are also presented by McBeath (2006), with angles of 25–30 and 30–70 degrees for flap 1 and 2, respectively, expected to produce the highest levels of downforce. Six models were generated with a range of AOA (Table 2). The wing was tested in free-stream conditions with the same simulation
parameters previously utilised in the baseline vehicle analysis. To save on
computation time, symmetry was utilised, and thus the downforce values are half of the final full wing model. The assumption is made that the most efficient
configuration in free-stream conditions will also be the most effective once implemented with the vehicle.
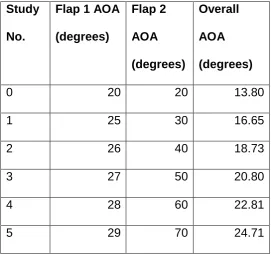
Table 2
Configuration of multiple-element rear wing consisting of three elements: main element, flap 1 and flap 2
Study No.
Flap 1 AOA (degrees) Flap 2 AOA (degrees) Overall AOA (degrees)
0 20 20 13.80
1 25 30 16.65
2 26 40 18.73
3 27 50 20.80
4 28 60 22.81
Results and discussion
Baseline vehicle analysis
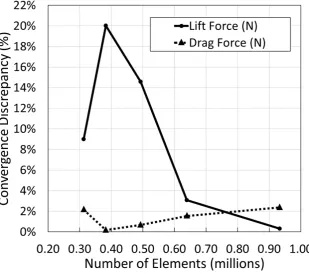
The change in lift and drag forces was recorded as the number of elements were increased (Figure 5). A relatively coarse domain enables quicker simulation time with acceptable result convergence (<5% for both lift and drag force values).
Figure 5
Convergence discrepancy of lift and drag forces against number of elements for baseline vehicle model
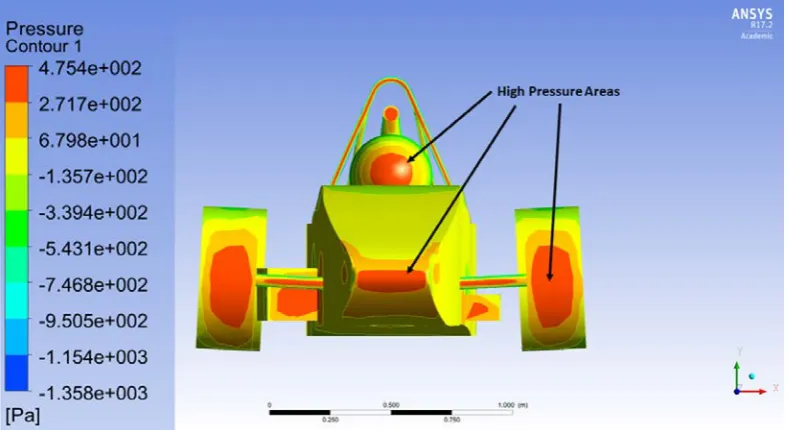
wing would benefit from being mounted as high as possible to avoid the disturbed flow from behind the driver’s head, roll hoop and air intake.
Figure 6
Spatial pressure (Pa) contour over the simplified vehicle surface
The coefficient of lift (CL) and coefficient of drag (CD) are dimensionless values which are used as an indication of a vehicle’s aerodynamic performance. Using the force value acting on the vehicle in the Z axis of 277.6 N, the resulting CD was calculated (Eq. 2).
𝐶𝐶𝐷𝐷 =𝜌𝜌𝜌𝜌𝑉𝑉2𝐹𝐹2 (2)
where F is the force acting on the vehicle body in the Z axis, ρ is the density of the
fluid, A is the frontal projection area which is used for calculating both drag and lift coefficients of vehicles (Katz,1995) and V is the vehicle velocity.
calculated coefficient of drag value, the result was compared to the experimentally obtained value of the Monash University FSAE 2005 vehicle, which gives a value of CD=0.83 (Wordley & Saunders, 2006), a similarity of 86%. Although the cars are different in design, they do offer enough similarity to indicate that the CFD results obtained are in a close enough margin to justify the analysis configuration.
The vehicle analysis indicated that positive lift is generated, which for a race car is detrimental to its performance due to decreased stability at high speeds as well as a reduction in achievable cornering speed. The addition of aerodynamic devices generating downforce should, therefore, improve the performance of the car, making it more competitive in dynamic events.
Rear wing performance
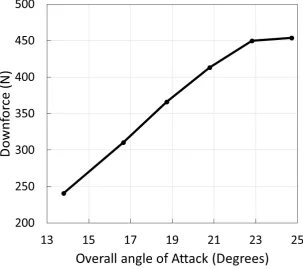
Increasing the AOA of an aerofoil increases both the lift and drag forces generated. However, as the AOA increases, the flow becomes detached due to adverse
Figure 7
Downforce as a function of overall AOA
Simplified model with implemented rear wing
The optimised rear wing assembly was combined with the simplified vehicle model to evaluate the performance. The positioning of the rear wing was determined by
setting the top of the end plates to be 1,200 mm from the ground, and the back face of the endplates to be 250 mm behind the rear wheels, ensuring regulation
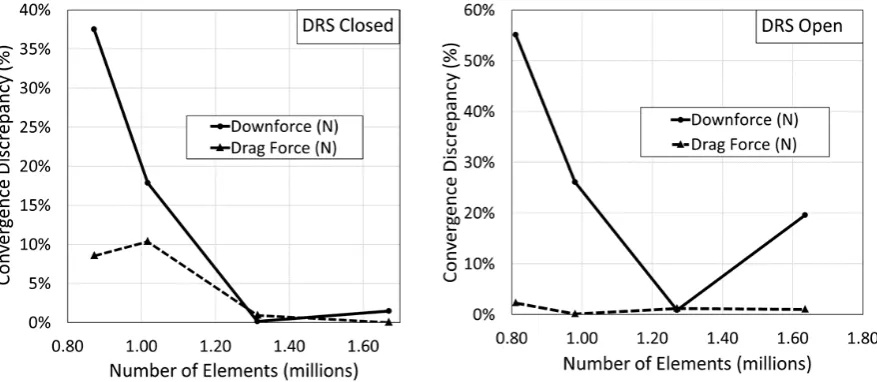
compliance. To account for the implemented rear wing, further mesh independence studies were performed with both the DRS open (low drag configuration) and DRS closed (high downforce configuration) (Figure 8). The simulation was configured with the same settings as the baseline vehicle model. The size of the domain was driven by the new vehicle length with the implemented wing of 3,277 mm. The generated mesh used face sizing control of 0.02 m on the car and 0.01 m on the rear two
rear wing to avoid deformation aft of the aerofoil due to the complex geometry. The final mesh file contained 1,669,602 elements.
Figure 8
Mesh independence study of vehicle with implemented rear wing with the DRS closed (left) and DRS open (right)
Although a higher level of convergence would be preferable for the downforce with the DRS open, limitations in computation power were causing excessively long computational time. However, as the primary focus of the DRS open configuration is the drag force, the results can be used as there was only a 1.0% discrepancy for this parameter.
the frontal projection area is reduced to 0.99 m2. Using this area, the CL and CD were calculated to be 0.26 (acting in the negative Y axis) and 0.79, respectively.
Figure 9
Spatial pressure (Pa) contour over vehicle surface with rear wing in both DRS closed (a) and DRS open (b)
Predicting vehicle performance with rear wing
To determine the effectiveness of the implemented rear wing, the new vehicle characteristics were used to determine track performance with respect to the
Figure 10
Drag force as a function velocity for the vehicle with the DRS open and closed
The resulting reduction in drag force was calculated to be 35% with the DRS open (Eq. 3).
∆ =𝐹𝐹𝐷𝐷𝐷𝐷𝐷𝐷−𝑂𝑂𝑂𝑂𝑂𝑂𝑂𝑂𝐹𝐹 − 𝐹𝐹𝐷𝐷𝐷𝐷𝐷𝐷−𝐶𝐶𝐶𝐶𝐶𝐶𝐶𝐶𝑂𝑂𝐶𝐶
𝐷𝐷𝐷𝐷𝐷𝐷−𝑂𝑂𝑂𝑂𝑂𝑂𝑂𝑂 (3)
Cornering speed
The calculation of maximum cornering speed is computed (Eq. 4). The value produced by this equation assumes that there is sufficient power to produce the maximum cornering speed. The limiting factors are that of the grip of the tires and CL.
𝑣𝑣𝑀𝑀𝑀𝑀𝑀𝑀 =�𝑚𝑚 𝑚𝑚𝑔𝑔
where m is the vehicle mass and r is corner radius. The increased CL of the vehicle with implemented rear wing enabled quicker cornering speeds to be reached (Figure 11, left). As the corner radius increases, the maximum speed achievable differential between the two configurations becomes more apparent (Figure 11, right). The rear wing improved the theoretical maximum cornering speed by 3.1% for a corner radius of 13 m.
Figure 11
Predicted cornering speed capabilities(left); speed difference between two configurations as a function of corner radius increases (right)
Straight-line top speed
Using the procedure described by McBeath (2006), the theoretical top speed can be calculated (Eq. 5). The equation has been modified to incorporate SI units as utilised by Wordley and Saunders (2006).
𝑉𝑉𝑀𝑀𝑀𝑀𝑀𝑀(𝑚𝑚/𝐶𝐶) = �𝑃𝑃𝑘𝑘𝑘𝑘 × 1633𝐶𝐶 𝐷𝐷𝜌𝜌
3
where PkW is the maximum engine power in kW. For the baseline vehicle the maximum speed achievable is expected to be 53.62 m/s. For the vehicle with the rear wing in both the DRS open and closed positions, the top speeds are expected to be 49.94 m/s and 40.86 m/s, respectively. The DRS open yields an 18.2% increase in straight-line speed potential compared to the closed configuration. However, top speeds are limited by the event design at student events and, as such, are not a key focus of aerodynamic design.
Acceleration
The dynamometer data from the KTM EXC 500 engine, which was acquired in 2012 by the Huddersfield Formula Student team, was combined with the gear ratios to determine the driving force acting at the wheels (Fw). The initial driving force exceeds the available grip of the tyres, and thus the assumption is made that the friction force (Ff) on the rear wheels will be the initial limiting factor of acceleration. At standstill Ff-0=µN, where µ is the friction coefficient of the tyre and N is the normal load. Thus,
acceleration from standstill ẍ0 can be expressed as ẍ0=Ff-0/m. However, as the car begins to accelerate, additional load will be placed on the rear wheels, from the mass transfer (Pi) and downforce (FL). Pi is calculated as follows:
𝑃𝑃𝑖𝑖 = 𝑚𝑚𝑥𝑥̈(𝑎𝑎+𝑖𝑖−1𝑏𝑏)ℎ (6)
to rear. The simplifying assumption is also made that clutch slip and rolling
resistance are negligible. Thus, the formula for calculating the frictional force of the rear tyres is as follows:
𝐹𝐹𝑓𝑓 =𝜇𝜇 �0.65𝑚𝑚𝑔𝑔± 1 2� 𝜌𝜌𝜌𝜌𝐶𝐶𝐿𝐿𝑉𝑉2+𝑚𝑚𝑥𝑥̈(𝑎𝑎+𝑖𝑖−1𝑏𝑏)ℎ� (7)
Again, using ẍi=Ff/m, the acceleration can be calculated. As the driving force at the
wheels becomes less than the friction force (Ff>FW) due to the increasing drag force FD, the car becomes power limited in acceleration and the effects of the DRS
becomes apparent. Power-limited acceleration (ẍP) can be expressed as follows:
𝑥𝑥̈𝑃𝑃 = (𝐹𝐹𝑘𝑘𝑚𝑚− 𝐹𝐹𝐷𝐷) (8)
Acceleration potential as a function of velocity was generated (Figure 12). Tyre friction coefficients (μ) of 0.8–1.2 display the effects of traction-limited acceleration.
Figure 12
Acceleration as a function of velocity
The acceleration potential increased by 15.7% at a velocity of 25 m/s with the DRS open. In an attempt to predict and compare the performance over the 75 m
acceleration event, an online FSAE vehicle simulator (FSAESim.com) was used with the inputted vehicle characteristics. The simulator predicted a time of 5.31 s and the result for the 2017 Hungary event was 5.49 s, a similarity of 96.7%.
Conclusions
This paper used the computational fluid dynamics method to investigate the
aerodynamic characteristics of the 2017 University of Huddersfield Formula Student vehicle with the implementation of a rear wing with incorporated DRS. It was
dynamic events and that the DRS system should increase the vehicle’s acceleration and top speed capabilities compared to the standard fixed wing configuration.
An initial investigation into the baseline performance of the vehicle was first performed to display the CL and CD values of 0.21 and 0.71, respectively. The CD was then compared to wind tunnel test results from the Monash University team, revealing a similarity of 86%. A multiple-element rear wing was configured and subsequently optimised to produce maximum downforce while avoiding stall. The baseline vehicle model was then used to generate two separate models, one with the incorporated wing in the standard configuration and the other with the wing in the DRS open configuration. The two models were then evaluated independently to find the aerodynamic characteristics for each configuration. With the wing in the DRS closed position, the CL and CD were found to be 1.15 and 1.21, respectively, while the vehicle with the wing in the DRS open position had a CL and CD of 0.26 and 0.79, respectively.
The obtained vehicle characteristics were then used to predict the dynamic
performance with respect to the Formula Student event. The difference in drag force between the DRS open and closed configuration was first calculated to be 35%. The maximum cornering speed as a function of radius was investigated for the baseline vehicle and the baseline vehicle with implemented rear wing in the closed position. The vehicle with implement wing with could take a 13 m radius corner 3.1% quicker than the baseline vehicle. The theoretical maximum straight-line speed was
increase in acceleration potential of 15.7% was observed for a velocity of 25 m/s with the DRS open. Finally, the predicted time for the 75 m acceleration event was
generated using an online simulator and compared to results obtained by the team in their 2017 Hungary event. The predicted time was 5.31 s, whereas the recorded time was 5.49 s, a similarity of 96.7%.
Appendix 1
Nomenclature
Symbol Description Units (SI)
A Area m2
(a+b) Wheelbase m
AOA (α) Angle of attack Degrees
c Chord length m
CD Coefficient of drag Dimensionless CL Coefficient of lift Dimensionless
F Force N
g Acceleration due to gravity m/s2 h Height from ground to
centre of gravity
m
m Mass kg
P Pressure Pa
r Radius m
s Wing span m
V Vehicle velocity m/s
ẍ Acceleration m/s2
μ Coefficient of friction Dimensionless
References
ANSYS. (2006). ANSYS CFX-Solver Theory Guide: ANSYS CFX Release 11.0. [Software documentation].
Dahlberg, H. (2014). Aerodynamic development of Formula Student race car (Thesis). KTH Mechanics. Retrieved 27 November 2016 from
http://urn.kb.se/resolve?urn=urn:nbn:se:kth:diva-148799
Franck, G., Nigro, N., & Storti, M. (2009). Numerical Simulation of the Flow Around the Ahmed Vehicle Model. Latin American Applied Research, 39, 295–306. Retrieved 16 February 2017 from
http://www.scielo.org.ar/scielo.php?script=sci_arttext&pid=S0327-07932009000400003
IMechE. (2017a). History of Formula Student [web page]. Retrieved 14 September 2017 from https://www.imeche.org/events/formula-student/about-formula-student/history-of-formula-student
IMechE. (2017b). The Formula Student Challenge [web page]. Retrieved 1 September 2017 from https://www.imeche.org/events/formula-student/about-formula-student/the-challenge
Katz, J. (1995). Race Car Aerodynamics: Designing for Speed. Cambridge, MA: R. Bentley.
Leitl, P., Dürnberger, J. (2009). Using ANSYS CFX in Formula Student Racing, 2008
(July) [Unpublished paper].
Merkel, J. P. (2014). Development of Multi-Element Active Aerodynamics for The Formula SAE Car. (Thesis). The University of Texas Arlington. Retrieved 23
November 2016 from https://uta-ir.tdl.org/uta-ir/handle/10106/24176
Versteeg, H. K., & Malalasekera, W. (2007). An Introduction to Computational Fluid Dynamics: The Finite Volume Method (2nd ed.). Harlow: Pearson Prentice Hall.