VOLUME NO. 6 (2016), ISSUE NO. 06 (JUNE) ISSN 2231-5756
A Monthly Double-Blind Peer Reviewed (Refereed/Juried) Open Access International e-Journal - Included in the International Serial Directories Indexed & Listed at:
Ulrich's Periodicals Directory ©, ProQuest, U.S.A., EBSCO Publishing, U.S.A., Cabell’s Directories of Publishing Opportunities, U.S.A., Google Scholar, Open J-Gage, India [link of the same is duly available at Inflibnet of University Grants Commission (U.G.C.)],
VOLUME NO. 6 (2016), ISSUE NO. 06 (JUNE) ISSN 2231-5756
CONTENTS
Sr.
No.
TITLE & NAME OF THE AUTHOR (S)
Page
No.
1.
PERCEIVED ROLE OF CORPORATE CULTURE IN PERFORMANCE OF COMMERCIAL STATE
CORPORATIONS IN KENYA
THOMAS C.O. MOSE, DR. MIKE IRAVO, DR. GEORGE O. ORWA & DR. ENG.THOMAS SENAJI
1
2.
A STUDY ON PATIENTS’ SATISFACTION TOWARDS SERVICES PROVIDED BY PRIVATE HOSPITALS IN
ERODE TALUK, ERODE DISTRICT
S. SASIKALA & DR. C. VADIVEL
8
3.
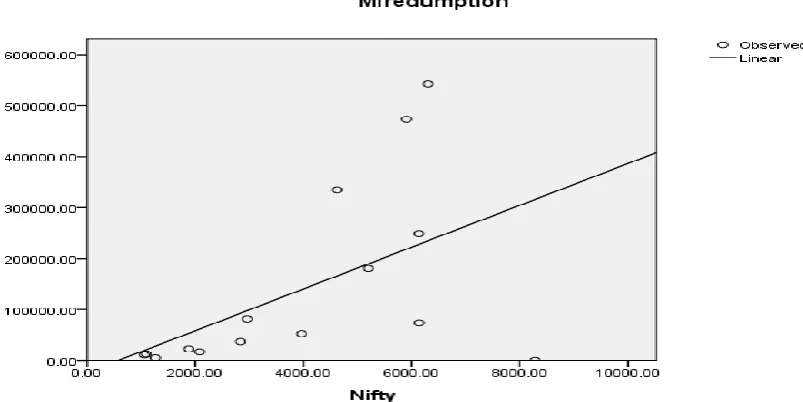
A STUDY ON MARKET MOVEMENT IMPACT ON MUTUAL FUND SUBSCRIPTIONS AND REDEMPTIONS
Y. JAYA RADHA SANKAR, DR. P. DIANA DAVID & LEELA CHAKRAVARTHI AKULA
14
4.
EFFECTIVE CHANGE MANAGEMENT
SINDHU S PANDYA
19
5.
SUPPLY CHAIN MANAGEMENT PRACTICES IN ORGANIZED RETAILING: A STUDY IN TRICHY REGION
DR. S. SARAVANAN & K. S. TAMIL SELVAN
21
6.
BANK CREDIT TO SMALL AND MEDIUM SPORTS GOODS MANUFACTURING ENTERPRISES OF MEERUT
- OBSTACLES IN FINANCING AND RECOVERY OF THE LOAN
KALI RAM GOLA, P. K. AGARWAL & MRIDUL DHARWAL
25
7.
IMPACT OF CHANGES IN INTEREST RATE ON BANK PROFITABILITY: A RE-EXAMINATION
DR. NAMRATA SANDHU & HIMANI SHARMA
30
8.
IT & ITES EMPLOYEES’ OPINION ON THE PERSPECTIVES CONSIDERED IN THE BALANCED SCORECARD-
A STUDY WITH SPECIAL REFERENCE TO COIMBATORE DISTRICT
SHYAM UMASANKAR K K & DR. V KRISHNAVENI
33
9.
IMPACT OF EXCHANGE RATE MOVEMENT AND WORLD OIL PRICE ON INDIAN AUTO STOCKS
NISCHITH. S & DR. MAHESH. R
39
10.
IMPACT OF NON PERFORMING ASSET ON PROFITABILITY OF PUBLIC AND PRIVATE SECTOR BANKS IN
INDIA
LAVEENA & KAMAL KAKKAR
46
11.
POLITICAL EMPOWERMENT OF WOMEN IN PNACHAYATI RAJ INSTITUTIONS: AN OVER VIEW
DR. M. GOPI
51
12.
CO-INTEGRATION OF INDIAN STOCK MARKET WITH US STOCK MARKET
ABHAY KUMAR
56
13.
INDIAN VALUE ADDED TAX (VAT) SYSTEM: A PROTOTYPE FOR NIGERIA
AHMED JINJIRI BALA & DR. A. THILAGARAJ
61
14.
A STUDY OF COMMITMENT OF SCHOOL TEACHERS IN RELATION TO SOME BACKGROUND VARIABLES
DR. KAMALPREET KAUR TOOR
65
15.
A STUDY ON EMPLOYEE JOB SATISFACTION IN WITH REFERENCE TO KERALA GARMIN BANK,
THRISSUR DISTRICT
MIRANDA PAUL
71
16.
JOB STRESS AND JOB SATISFACTION IN THE COMMUNICATION SERVICE INDUSTRY: EVIDENCE FROM
TECH MAHINDRA GHANA LTD.
PAUL APPIAH-KONADU & HENRY KWADWO FRIMPONG
75
17.
THE EFFECTS OF ERP SYSTEM
SAJID NEGINAL
81
18.
INTERNET BANKING: DEBATING CORE ISSUES AND BENEFITS
LAVANYA K.N.
83
19.
IMPACT OF WORKING CAPITAL MANAGEMENT ON CORPORATE PERFORMANCE: A STUDY BASED ON
SELECTED BANKS IN NIGERIA
ALIYU SANI SHAWAI
85
20.
CARE FOR INDIA: TACKLING URBAN-RURAL DISPARITIES: URBAN VS. RURAL ACCESS TO HEALTHCARE
SERVICES IN UTTAR PRADESH
RHEA SHUKLA
89
VOLUME NO. 6 (2016), ISSUE NO. 06 (JUNE) ISSN 2231-5756
CHIEF PATRON
PROF. K. K. AGGARWAL
Chairman, Malaviya National Institute of Technology, Jaipur
(An institute of National Importance & fully funded by Ministry of Human Resource Development, Government of India)
Chancellor, K. R. Mangalam University, Gurgaon
Chancellor, Lingaya’s University, Faridabad
Founder Vice-Chancellor (1998-2008), Guru Gobind Singh Indraprastha University, Delhi
Ex. Pro Vice-Chancellor, Guru Jambheshwar University, Hisar
FOUNDER PATRON
LATE SH. RAM BHAJAN AGGARWAL
Former State Minister for Home & Tourism, Government of Haryana
Former Vice-President, Dadri Education Society, Charkhi Dadri
Former President, Chinar Syntex Ltd. (Textile Mills), Bhiwani
FORMER CO-ORDINATOR
DR. S. GARG
Faculty, Shree Ram Institute of Business & Management, Urjani
ADVISORS
PROF. M. S. SENAM RAJU
Director A. C. D., School of Management Studies, I.G.N.O.U., New Delhi
PROF. M. N. SHARMA
Chairman, M.B.A., Haryana College of Technology & Management, Kaithal
PROF. S. L. MAHANDRU
Principal (Retd.), Maharaja Agrasen College, Jagadhri
EDITOR
PROF. R. K. SHARMA
Professor, Bharti Vidyapeeth University Institute of Management & Research, New Delhi
CO-EDITOR
DR. BHAVET
Faculty, Shree Ram Institute of Engineering & Technology, Urjani
EDITORIAL ADVISORY BOARD
DR. RAJESH MODI
Faculty, Yanbu Industrial College, Kingdom of Saudi Arabia
PROF. SANJIV MITTAL
University School of Management Studies, Guru Gobind Singh I. P. University, Delhi
PROF. ANIL K. SAINI
Chairperson (CRC), Guru Gobind Singh I. P. University, Delhi
DR. SAMBHAVNA
VOLUME NO. 6 (2016), ISSUE NO. 06 (JUNE) ISSN 2231-5756
DR. MOHENDER KUMAR GUPTA
Associate Professor, P. J. L. N. Government College, Faridabad
DR. SHIVAKUMAR DEENE
Asst. Professor, Dept. of Commerce, School of Business Studies, Central University of Karnataka, Gulbarga
ASSOCIATE EDITORS
PROF. NAWAB ALI KHAN
Department of Commerce, Aligarh Muslim University, Aligarh, U.P.
PROF. ABHAY BANSAL
Head, Department of I.T., Amity School of Engineering & Technology, Amity University, Noida
PROF. A. SURYANARAYANA
Department of Business Management, Osmania University, Hyderabad
PROF. V. SELVAM
SSL, VIT University, Vellore
DR. PARDEEP AHLAWAT
Associate Professor, Institute of Management Studies & Research, Maharshi Dayanand University, Rohtak
DR. S. TABASSUM SULTANA
Associate Professor, Department of Business Management, Matrusri Institute of P.G. Studies, Hyderabad
SURJEET SINGH
Asst. Professor, Department of Computer Science, G. M. N. (P.G.) College, Ambala Cantt.
FORMER TECHNICAL ADVISOR
AMITA
Faculty, Government M. S., Mohali
FINANCIAL ADVISORS
DICKIN GOYAL
Advocate & Tax Adviser, Panchkula
NEENA
Investment Consultant, Chambaghat, Solan, Himachal Pradesh
LEGAL ADVISORS
JITENDER S. CHAHAL
Advocate, Punjab & Haryana High Court, Chandigarh U.T.
CHANDER BHUSHAN SHARMA
Advocate & Consultant, District Courts, Yamunanagar at Jagadhri
SUPERINTENDENT
VOLUME NO. 6 (2016), ISSUE NO. 06 (JUNE) ISSN 2231-5756
CALL FOR MANUSCRIPTS
We invite unpublished novel, original, empirical and high quality research work pertaining to the recent developments & practices in the areas of Com-puter Science & Applications; Commerce; Business; Finance; Marketing; Human Resource Management; General Management; Banking; Economics; Tourism Administration & Management; Education; Law; Library & Information Science; Defence & Strategic Studies; Electronic Science; Corporate Gov-ernance; Industrial Relations; and emerging paradigms in allied subjects like Accounting; Accounting Information Systems; Accounting Theory & Practice; Auditing; Behavioral Accounting; Behavioral Economics; Corporate Finance; Cost Accounting; Econometrics; Economic Development; Economic History; Financial Institutions & Markets; Financial Services; Fiscal Policy; Government & Non Profit Accounting; Industrial Organization; International Economics & Trade; International Finance; Macro Economics; Micro Economics; Rural Economics; Co-operation; Demography: Development Planning; Development Studies; Applied Economics; Development Economics; Business Economics; Monetary Policy; Public Policy Economics; Real Estate; Regional Economics; Political Science; Continuing Education; Labour Welfare; Philosophy; Psychology; Sociology; Tax Accounting; Advertising & Promotion Management; Management Information Systems (MIS); Business Law; Public Responsibility & Ethics; Communication; Direct Marketing; E-Commerce; Global Business; Health Care Administration; Labour Relations & Human Resource Management; Marketing Research; Marketing Theory & Applications; Non-Profit Or-ganizations; Office Administration/Management; Operations Research/Statistics; Organizational Behavior & Theory; Organizational Development; Pro-duction/Operations; International Relations; Human Rights & Duties; Public Administration; Population Studies; Purchasing/Materials Management; Re-tailing; Sales/Selling; Services; Small Business Entrepreneurship; Strategic Management Policy; Technology/Innovation; Tourism & Hospitality; Transpor-tation Distribution; Algorithms; Artificial Intelligence; Compilers & Translation; Computer Aided Design (CAD); Computer Aided Manufacturing; Computer Graphics; Computer Organization & Architecture; Database Structures & Systems; Discrete Structures; Internet; Management Information Systems; Mod-eling & Simulation; Neural Systems/Neural Networks; Numerical Analysis/Scientific Computing; Object Oriented Programming; Operating Systems; Pro-gramming Languages; Robotics; Symbolic & Formal Logic; Web Design and emerging paradigms in allied subjects.
Anybody can submit the soft copy of unpublished novel; original; empirical and high quality research work/manuscript anytime in M.S. Word format after preparing the same as per our GUIDELINES FOR SUBMISSION; at our email address i.e. [email protected] or online by clicking the link online submission as given on our website (FOR ONLINE SUBMISSION, CLICK HERE).
GUIDELINES FOR SUBMISSION OF MANUSCRIPT
1. COVERING LETTER FOR SUBMISSION:
DATED: _____________
THE EDITOR
IJRCM
Subject: SUBMISSION OF MANUSCRIPT IN THE AREA OF .
(e.g. Finance/Mkt./HRM/General Mgt./Engineering/Economics/Computer/IT/ Education/Psychology/Law/Math/other, please specify)
DEAR SIR/MADAM
Please find my submission of manuscript titled ‘___________________________________________’ for likely publication in one of your journals.
I hereby affirm that the contents of this manuscript are original. Furthermore, it has neither been published anywhere in any language fully or partly, nor it is under review for publication elsewhere.
I affirm that all the co-authors of this manuscript have seen the submitted version of the manuscript and have agreed to inclusion of their names as co-authors.
Also, if my/our manuscript is accepted, I agree to comply with the formalities as given on the website of the journal. The Journal has discretion to publish our contribution in any of its journals.
NAME OF CORRESPONDING AUTHOR :
Designation/Post* :
Institution/College/University with full address & Pin Code :
Residential address with Pin Code :
Mobile Number (s) with country ISD code :
Is WhatsApp or Viber active on your above noted Mobile Number (Yes/No) :
Landline Number (s) with country ISD code :
E-mail Address :
Alternate E-mail Address :
Nationality :
VOLUME NO. 6 (2016), ISSUE NO. 06 (JUNE) ISSN 2231-5756
NOTES:
a) The whole manuscript has to be in ONE MS WORD FILE only, which will start from the covering letter, inside the manuscript. pdf.
version is liable to be rejected without any consideration.
b) The sender is required to mention the following in the SUBJECT COLUMN of the mail:
New Manuscript for Review in the area of (e.g. Finance/Marketing/HRM/General Mgt./Engineering/Economics/Computer/IT/
Education/Psychology/Law/Math/other, please specify)
c) There is no need to give any text in the body of the mail, except the cases where the author wishes to give any specific message
w.r.t. to the manuscript.
d) The total size of the file containing the manuscript is expected to be below 1000 KB.
e) Only the Abstract will not be considered for review and the author is required to submit the complete manuscript in the first
instance.
f) The journal gives acknowledgement w.r.t. the receipt of every email within twenty-four hours and in case of non-receipt of
acknowledgment from the journal, w.r.t. the submission of the manuscript, within two days of its submission, the corresponding author is required to demand for the same by sending a separate mail to the journal.
g) The author (s) name or details should not appear anywhere on the body of the manuscript, except on the covering letter and the
cover page of the manuscript, in the manner as mentioned in the guidelines.
2. MANUSCRIPT TITLE: The title of the paper should be typed in bold letters, centeredand fully capitalised.
3. AUTHOR NAME (S) & AFFILIATIONS: Author (s) name, designation, affiliation (s), address, mobile/landline number (s), and email/al-ternate email address should be given underneath the title.
4. ACKNOWLEDGMENTS: Acknowledgements can be given to reviewers, guides, funding institutions, etc., if any.
5. ABSTRACT: Abstract should be in fully Italic printing, ranging between 150 to 300 words. The abstract must be informative and
eluci-dating the background, aims, methods, results & conclusion in a SINGLE PARA. Abbreviations must be mentioned in full.
6. KEYWORDS: Abstract must be followed by a list of keywords, subject to the maximum of five. These should be arranged in alphabetic
order separated by commas and full stop at the end. All words of the keywords, including the first one should be in small letters, except special words e.g. name of the Countries, abbreviations etc.
7. JEL CODE: Provide the appropriate Journal of Economic Literature Classification System code (s). JEL codes are available at
www.aea-web.org/econlit/jelCodes.php. However, mentioning of JEL Code is not mandatory.
8. MANUSCRIPT: Manuscript must be in BRITISH ENGLISH prepared on a standard A4 size PORTRAIT SETTING PAPER. It should be free
from any errors i.e. grammatical, spelling or punctuation. It must be thoroughly edited at your end.
9. HEADINGS: All the headings must be bold-faced, aligned left and fully capitalised. Leave a blank line before each heading.
10. SUB-HEADINGS: All the sub-headings must be bold-faced, aligned left and fully capitalised.
11. MAIN TEXT:
THE MAIN TEXT SHOULD FOLLOW THE FOLLOWING SEQUENCE:
INTRODUCTION REVIEW OF LITERATURE
NEED/IMPORTANCE OF THE STUDY STATEMENT OF THE PROBLEM OBJECTIVES
HYPOTHESIS (ES)
RESEARCH METHODOLOGY RESULTS & DISCUSSION FINDINGS
RECOMMENDATIONS/SUGGESTIONS CONCLUSIONS
LIMITATIONS
SCOPE FOR FURTHER RESEARCH REFERENCES
APPENDIX/ANNEXURE
VOLUME NO. 6 (2016), ISSUE NO. 06 (JUNE) ISSN 2231-5756
12. FIGURES & TABLES: These should be simple, crystal CLEAR, centered, separately numbered & self-explained, and the titles must be above the table/figure. Sources of data should be mentioned below the table/figure. It should be ensured that the tables/figures are
referred to from the main text.
13. EQUATIONS/FORMULAE: These should be consecutively numbered in parenthesis, left aligned with equation/formulae number placed
at the right. The equation editor provided with standard versions of Microsoft Word may be utilised. If any other equation editor is utilised, author must confirm that these equations may be viewed and edited in versions of Microsoft Office that does not have the editor.
14. ACRONYMS: These should not be used in the abstract. The use of acronyms is elsewhere is acceptable. Acronyms should be defined
on its first use in each section e.g. Reserve Bank of India (RBI). Acronyms should be redefined on first use in subsequent sections. 15. REFERENCES: The list of all references should be alphabetically arranged. The author (s) should mention only the actually utilised
references in the preparation of manuscript and they may follow Harvard Style of Referencing. Also check to ensure that everything
that you are including in the reference section is duly cited in the paper. The author (s) are supposed to follow the references as per
the following:
All works cited in the text (including sources for tables and figures) should be listed alphabetically. Use (ed.) for one editor, and (ed.s) for multiple editors.
When listing two or more works by one author, use --- (20xx), such as after Kohl (1997), use --- (2001), etc., in chronologically ascending order.
Indicate (opening and closing) page numbers for articles in journals and for chapters in books.
The title of books and journals should be in italic printing. Double quotation marks are used for titles of journal articles, book chapters, dissertations, reports, working papers, unpublished material, etc.
For titles in a language other than English, provide an English translation in parenthesis.
Headers, footers, endnotes and footnotes should not be used in the document. However, you can mention short notes to elucidate
some specific point, which may be placed in number orders before the references.
PLEASE USE THE FOLLOWING FOR STYLE AND PUNCTUATION IN REFERENCES:
BOOKS
Bowersox, Donald J., Closs, David J., (1996), "Logistical Management." Tata McGraw, Hill, New Delhi. Hunker, H.L. and A.J. Wright (1963), "Factors of Industrial Location in Ohio" Ohio State University, Nigeria.
CONTRIBUTIONS TO BOOKS
Sharma T., Kwatra, G. (2008) Effectiveness of Social Advertising: A Study of Selected Campaigns, Corporate Social Responsibility, Edited by David Crowther & Nicholas Capaldi, Ashgate Research Companion to Corporate Social Responsibility, Chapter 15, pp 287-303.
JOURNAL AND OTHER ARTICLES
Schemenner, R.W., Huber, J.C. and Cook, R.L. (1987), "Geographic Differences and the Location of New Manufacturing Facilities," Jour-nal of Urban Economics, Vol. 21, No. 1, pp. 83-104.
CONFERENCE PAPERS
Garg, Sambhav (2011): "Business Ethics" Paper presented at the Annual International Conference for the All India Management Asso-ciation, New Delhi, India, 19–23
UNPUBLISHED DISSERTATIONS
Kumar S. (2011): "Customer Value: A Comparative Study of Rural and Urban Customers," Thesis, Kurukshetra University, Kurukshetra.
ONLINE RESOURCES
Always indicate the date that the source was accessed, as online resources are frequently updated or removed.
WEBSITES
VOLUME NO. 6 (2016), ISSUE NO. 06 (JUNE) ISSN 2231-5756
PERCEIVED ROLE OF CORPORATE CULTURE IN PERFORMANCE OF COMMERCIAL STATE CORPORATIONS
IN KENYA
THOMAS C.O. MOSE
RESEARCH SCHOLAR
COLLEGE OF HUMAN RESOURCE DEVELOPMENT
JOMO KENYATTA UNIVERSITY OF AGRICULTURE & TECHNOLOGY
NAIROBI
DR. MIKE IRAVO
PRINCIPAL
COLLEGE OF HUMAN RESOURCE DEVELOPMENT
JOMO KENYATTA UNIVERSITY OF AGRICULTURE & TECHNOLOGY
NAIROBI
DR. GEORGE O. ORWA
HEAD
STATISTICAL & ACTUARIAL SCIENCES DEPARTMENT
COLLEGE OF HUMAN RESOURCE DEVELOPMENT
JOMO KENYATTA UNIVERSITY OF AGRICULTURE & TECHNOLOGY
NAIROBI
DR. ENG.THOMAS SENAJI
SR. LECTURER
COLLEGE OF HUMAN RESOURCE DEVELOPMENT
JOMO KENYATTA UNIVERSITY OF AGRICULTURE & TECHNOLOGY
NAIROBI
ABSTRACT
The purpose of this study was to investigate the role of corporate culture in organisational performance of commercial state corporations in Kenya. The study adopted descriptive and explanatory research designs with a statistical sample of 103 employees responsible for key result areas in 36 commercial state corpora-tions in Kenya. Data was collected using a structured questionnaire as well as various reports. Corporate culture was measured using culture traits of Denison’s model while organizational performance was measured through Fisher’s measures with some modifications. The moderating variable was measured using scale of personal values in the Social Value Survey developed by Schwartz. Data was analyzed using descriptive and inferential statistics with the aid of Statistical package for social sciences (SPSS) version 20 for descriptive statistics, factor analysis, hypotheses testing and regression analysis. Secondary data was analyzed through the use of R-program. Results of the study show a positive significant role of corporate culture in performance of state corporations (R2 = 0.951). The study recommends
that state corporations embrace positive corporate culture that promotes entrepreneurship and productivity for them to become competitive and remain successful.
KEYWORDS
corporate culture, denison model, ceo values, organizational performance, commercial state corporations.
INTRODUCTION
rganisations in many industries, such as service, energy, banking, electronics and agriculture have faced increasingly complex and changing environments brought about by deregulation, technological revolution, foreign competition and unpredictable markets. This has not spared state corporations (Liu, Kiley & Ballard, 2009). Besides, the fierce competition of the market economy and globalization trends are forcing businesses to constantly explore new things and boost creativity and adaptability to changes in order to survive and develop (Nguyen, 2015). This requires businesses to build and maintain culture-specific routines to promote the capacity and promote the contribution of everyone to achieve the overall objectives of the organization - which is Corporate Culture (CC). Development of a particular culture for the organisation is key to the success of these organisations (Philip & McKeown, 2004). This consists of fostering attitudes of flexibility, dynamism and responsiveness; seeking structures and cultures that are positive and organic; and developing the human resource to its maximum capacity (Pettinger, 2000).
STATEMENT OF THE PROBLEM
Despite several efforts by the government to restructure the State Corporations to enhance performance, the corporations have over the years performed dismally due to a number of challenges notably bad governance, political interference and lack of corporate culture (Mwaura, 2007). Although empirical studies have been carried out globally on corporate culture and performance of organizations, there has been little evidence relating the effect of corporate culture to organizational performance (McKinon et al., 2003). This shows that the importance of corporate culture, as a factor in defining performance, has received considerably little attention (Tepeci & Bartlett, 2002).
VOLUME NO. 6 (2016), ISSUE NO. 06 (JUNE) ISSN 2231-5756 In a study of Hong Kong and Australian managers, Lok and Crawford (2004) found a positive effect of corporate culture on employee performance. In another study Zain et al. (2009) examined the effect of four dimensions of corporate culture namely teamwork, communication, reward and recognition, and training and development on organizational performance and found that all the four dimensions of corporate culture were important determinants of organizational perfor-mance. While Mahmudah (2012) report a significant relationship between corporate culture and organizational performance, research by Lahiry (1994) showed only a weak association between corporate culture and organizational performance.
Locally, there is scarce literature on the role of corporate culture in performance of state corporations (SCs). Several studies have been conducted on performance of SCs in Kenya, such as one in which Shitakwa (2008) undertook a study of the relationship between performance contracting and performance of state owned corporations. Muriithi (2008) also did a research on corporate governance and the financial performance of state corporations. Wario’s (2012) study was on the role of HRM in operationalization of tacit knowledge in Kenyan state corporations. Ong’onge’s (2012) study was on the effect of autonomy on financial performance of commercial state corporations in Kenya. Mwaura (2007) focussed on the failure of corporate governance in state owned enterprises in Kenya while Chumo’s (2013) study was on effects of Chief Executive Officers’ turnover and succession on the performance of state corporations in Kenya. Kibui (2014) conducted a study on role of talent management on employees of state corporations in Kenya. Empirical review among all these studies conducted shows no one has addressed role of corporate culture on performance of commercial state corporations in Kenya. Therefore, there is need to address corporate culture and its role in performance of commercial state corporations in Kenya as the knowledge gap necessitating this research study.
The purpose of the study was to examine this relationship with particular reference to four corporate culture dimensions, namely involvement, consistency, adaptability and mission, in State Corporations in Kenya. CEO’s values were adopted as the moderating variable because previous studies examining top leaders’ personal values found that values can function as a cognitive hierarchy (Behr, 1998; Ravlin & Meglino, 1987) and the hierarchy of values has been used to explain the differences in organizational outcomes (Meglino & Ravlin, 1998). It is important to analyse performance and conditions of parastatals under different aspects and changing environment and to use modern research methods in order to contribute to recommendations and improvement of performance of SCs. The research conducted by Denison is the most extensive quantitative study on organisational culture and organisational performance. Although a significant amount of re-search has been conducted on the Denison Organizational Culture Survey elsewhere, there have been no studies of this nature in Kenya. This study, thus, seeks to answer the question: what is the role of corporate culture in the performance of State Corporation in Kenya?
OBJECTIVE OF THE STUDY
The general objective of this study was to assess the role of corporate culture in organisational performance of State Corporations in Kenya.
METHODOLOGY
According to Cooper & Schindler (2006) a research design is the blue print for fulfilling research objectives and answering questions. It is the various steps that are generally adopted by a researcher in studying his research problem along with the logic behind them (Chumo, 2011). Selecting a design may be complicated by availability of a large variety of methods, techniques, procedures, protocols and sampling plans. This study was descriptive in nature, as the relationship between corporate culture and performance was described through the research. Christensen (1997) indicates that the primary characteristic of the descriptive research approach is that it represents an attempt to provide an accurate description or picture of a particular situation or phenomenon. It attempts to identify variables that exist in a given situation and describes the relationship that exists between those variables. This research meets these requirements as the characteristics and constructs of corporate culture and performance are clearly defined and will be analysed using quantitative techniques, and the aim of the research is to determine the nature of the relationship between the two variables.
Explanatory research goes further than merely indicating that relationships exist between variables (Mouton & Marais, 1994). It indicates the direction of the relationships in a causal relationship model. In this research, a particular organisational culture profile is hypothesised to have a role in the performance of the SCs. This research can thus also be described as being explanatory in nature.
Thus the study adopted a descriptive survey research with the SCs in Kenya as the unit of analysis because the design best serves to answer the questions and the purposes of the study. The survey research is one in which a group of people or items is studied by collecting and analyzing data from only a few people or items considered to be representative of the entire group. In other words, only a part of the population is studied, and findings from this are expected to be generalized to the entire population (Nworgu, 1991).
The hypotheses that were put forth by the researcher were tested through statistical outcomes, and the choice of statistical tests were based upon the level of measurement of the data; the validity of the instrument utilized for measuring the variables of interest; the power of the statistical test selected; and the meth-odological limitations of the research (Teddie & Tashakkori, 2010 cited in Sang, 2015).
RESULTS AND DISCUSSION
RESPONSE RATEData was collected from 26 commercial state corporations while targeting 34 state corporations. A total of 70 out of 103 self administered questionnaires were filled and returned giving a response rate of 68 %. This was considered adequate as the recommended rate is 60% of respondents (Sekaran, 2009).
ROLE OF INVOLVEMENT CULTURE IN PERFORMANCE
In this study involvement culture was operationalized into empowerment, team orientation, and capability development. A five-point likert scale was used to measure each of the sub-variables and the results were presented in tables. Percentages were used to describe the results.
EMPOWERMENT
From the results in Table 1 below, 80% of the respondents were of the opinion that decisions are usually made at the level where the best information is available, 12.9% were neutral and 7.1% disagreed. It is deduced that decisions in the organizations are made where the best information is available. This facilitates quality of apt decisions at managerial level. On whether information is widely shared so that everyone can get the information he or she needs when it is needed, 68.6% agreed, 20% were neutral and 11.4% disagreed. This implies that information is widely shared in the organizations as and when required. It is a positive sign which facilitates employees to know all the details needed by them. Asked whether everyone believes that he or she can have a positive impact, 65.7% agreed, 21.4% were neutral and 12.9% disagreed. It is deduced that employees in their individual capacity consider their impact on performance of an organization. This can be attributed to their sense of positive contribution in the growth of the organization.
TABLE 1: RESPONSE ON EMPOWERMENT
Empowerment Strongly
Disagree
Disagree Neutral Agree Strongly Agree
Summary
Mean Median Mode Decisions are usually made at the level where the best information is available. 1.4% 5.7% 12.9% 54.3% 25.7% 4 4 4 Information is widely shared so that everyone can get the information he or she
needs when it is needed.
0.0% 11.4% 20.0% 48.6% 20.0% 4 4 4
Everyone believes that he or she can have a positive impact. 2.9% 10.0% 21.4% 40.0% 25.7% 4 4 4 TEAM ORIENTATION
VOLUME NO. 6 (2016), ISSUE NO. 06 (JUNE) ISSN 2231-5756 disagreed. It is deduced that employees believe working in the team instead of taking instructions in the hierarchy. This is an appropriate method of working in the organizations.
TABLE 2: RESPONSE ON TEAM ORIENTATION
Team orientation Strongly
Disagree
Disagree Neutral Agree Strongly Agree
Summary
Mean Median Mode Working in this organization is like being part of a team. 2.9% 7.1% 14.3% 47.1% 28.6% 4 4 4 This organization relies on horizontal control and
coordi-nation to get work done rather than hierarchy.
2.9% 28.6% 20.0% 35.7% 12.9% 3 3 4
Teams are the primary building blocks of this organization. 4.3% 5.7% 27.1% 45.7% 17.2% 4 4 4
On whether the organization relies on horizontal control and coordination to get work done rather than hierarchy, 48.6% agreed, 20% were neutral and 31.5% disagreed. Lastly, for the opinion that teams are the primary building blocks of the organization, 62.9% agreed, 27.1% were neutral and 10% disagreed. This reveals that to a large extent organization teams are their building blocks.
CAPABILITY DEVELOPMENT
A modified five-point Likert scale was used to measure capability development and the results were as tabulated in Table 3. Percentages were used to describe the results. From the findings, 60% agreed with the opinion that the organization is constantly improving its ‘bench strength’ in many dimensions, 34.3% were neutral and 5.7% disagreed. It is deduced that there is continuous investment in order to improve the skills of employees. On whether the organization continuously invests in the skill of employees, 68.6% agreed, 17.1% were neutral and 5.7% disagreed. This shows that to a great extent concerted efforts are made to develop and utilize the skill of employees. Lastly, 74.3% agreed with the opinion that the capability of people in the respective organization is viewed as an important source of competitive advantage, 14.3% were neutral and 11.4% disagreed. This shows that capability of employees is viewed as an important source of compet-itive advantage.
TABLE 3: RESPONSE ON CAPABILITY DEVELOPMENT
Capability Development Strongly
Disagree
Disagree Neutral Agree Strongly Agree
Summary
Mean Median Mode The organization is constantly improving its ‘bench strength’ in
many dimensions.
1.4% 4.3% 34.3% 42.9% 17.1% 4 4 4
This organisation continuously invests in the skill of employees. 2.9% 11.4% 17.1% 32.9% 35.7% 4 4 5 The capability of people in this organisation is viewed as an
im-portant source of competitive advantage.
1.4% 10.0% 14.3% 47.1% 27.1% 4 4 4
RELIABILITY
Internal consistency refers to the degree to which responses are consistent across the items (variables) within a single measurement scale (Kline, 2005 cited in Nguyen, 2010). According to Cortina (1993), Cronbach’s Alpha remains the most widely used measure of scale reliability. A low Cronbach’s Alpha coefficient indicates that variables may be too heterogeneous, thus perform poorly in representing the measure (the construct). Accordingly, Cronbach’s Alpha above 0.70 is considered an acceptable indicator of internal consistency, and the values of 0.60 to 0.70 are at the lower limit of acceptability as suggested in the literature (Hair, et al., 2006).
Since no factor was removed, reliability test results before and after factor analyses were the same as shown in Table 4.
TABLE 4: RELIABILITY MEASUREMENT RESULTS FOR INVOLVEMENT CULTURE
Variable Number of Items Cronbach's Alpha
Involvement culture 9 0.834
Cronbach’s alpha result of 0.834 obtained in this variable shows good internal consistency. Davidson, et al (2007) obtained Cronbach’s alpha of 0.84 while Mu-hammad (2007) obtained alpha of 0.889 in a similar study.
FACTOR ANALYSIS
Principal Factor Analysis was conducted to determine if all factors/questionnaire items had significant factor loadings. All the factor loading was either greater than, or close to the threshold of 0.50 suggested by Hair et al (2006), supporting the reliability of the variables. All items were therefore retained since they had factor loadings greater than 0.5.
Normality Test
The basic assumption in regression analysis is normality of the residuals in the dependent variable in order to generalize findings of the study beyond the sample collected (Field, cited in Kimutai, 2014). Kolgomorov-Siminov test was used to test for normality of organisational performance. The results indicate that the dependent variable (organisational performance) is normally distributed as shown in Table 5 with a mean of 17.34 and standard deviation of 5.04.
TABLE 5: KOLMOGOROV-SMIRNOV TEST One-Sample Kolmogorov-Smirnov Test
Organizational Performance
N 70
Normal Parametersa Mean 17.337347
Std. Deviation 5.0411655 Most Extreme Differences Absolute 0.078 Positive 0.077 Negative -0.078
Kolmogorov-Smirnov Z 0.649
Asymp. Sig. (2-tailed) 0.794
VOLUME NO. 6 (2016), ISSUE NO. 06 (JUNE) ISSN 2231-5756 FIGURE 1: NORMALITY PLOT OF ORGANISATIONAL PERFORMANCE (DEPENDENT VARIABLE)
It is important to validate the assumption that data of this sample was from a normal distribution, through visual inspection of data plots because this validates generalising of results from the sample to the entire population of state corporations in Kenya. When majority of the responses are closer to the normality line it shows that the data was effective and therefore it is suitable for all types of statistical analysis including parametric and regression analysis (Weru, 2014).
FIGURE 2: BOX PLOT OF ORGANISATIONAL PERFORMANCE (DEPENDENT VARIABLE)
The results of a box-plot also depicted that organisational performance lies between 14 and 20 units. However, there is one outlier at the bottom whose perfor-mance is low, as shown in Figure 2.
Correlations between Involvement Culture and Performance
Variables of this study were measured on likert scale (nominal scale) and were converted into weighted data using R-programme to gain atleast approximate interval characteristic (Nguyen, 2013). The extent of linear approximation between two variables was indexed by a statistic known as the Pearson correlation coefficient (r) (Jaccard & Becker, 1997), which can assume any value from -1.00 to +1.00 inclusive. The size of the absolute value provides an indication of the strength of the relationship. A correlation coefficient of -1.00 or +1.00 and -0.50 or +0.50 indicates perfect and moderate correlation respectively (Pallant, 2007). However, in behavioural science research, where complex behaviours are studied, significant correlation of 0.20 to 0.30 (and -0.20 to -0.30), are often considered important (Jaccard & Becker, 1997). The variable that was identified to have significant association with several other variables was further analysed through a stepwise regression process to reveal whether it (as a criterion) could be predicted or explained by those variables (as predictors). In this study, 43 factors which included 9 factors of involvement culture (IC), 9 of consistency culture (CC), 9 of adaptability culture (AC), 9 of mission culture (MC), and 7 of CEO values (CV) were used to test the hypotheses and answer the research questions. The correlation analysis was performed to identify aspects of the relationship among these dimensions. Table 6 shows the Pearson’s Bivariate correlation between organisational performance and involvement culture.
TABLE 6: CORRELATION BETWEEN ORGANISATIONAL PERFORMANCE AND INVOLVEMENT CULTURE
Variable Organizational Performance Involvement Culture
Organizational Performance Pearson Correlation 1 0.474** Sig. (2-tailed) 0.000 Involvement Culture Pearson Correlation 0.474** 1 Sig. (2-tailed) 0.000
**. Correlation is significant at the 0.01 level (2-tailed).
VOLUME NO. 6 (2016), ISSUE NO. 06 (JUNE) ISSN 2231-5756 FIGURE 3: SCATTER PLOT ON RELATIONSHIP BETWEEN INVOLVEMENT CULTURE AND ORGANISATIONAL PERFORMANCE
A scatter diagram is a type of mathematical diagram using Cartesian Coordinates to display values for two variables for a set of data. The data are displayed as a collection of points on the horizontal and vertical axes (Kimutai, 2014). The results show that as magnitude of involvement culture increases organisational per-formance increases in the same positive direction and therefore the two variables are correlated positively. Since the two variables are associated with each other, a hypothesis that postulates a significant relationship between the two variables can be tested by examining the correlation between the two (Sekaran & Bourgie, 2010).
Regression Analysis of Organisational Performance on Involvement Culture
Table 7 shows that R2 is 0.225, that is, 22.5% of the variation in organizational performance is explained by the model: Y= b0 + b1X1+ ε………Equation 1
Where Y is Organisational Performance, b0 is the Y intercept, b1 is the gradient of the regression line, X1 is Involvement Culture and ε is the error term. This result shows that involvement culture can only explain 22.5% of change in organizational performance and other factors explain 77.5% of variation in organizational performance (Sekaran & Borgie, 2010).
TABLE 7: VARIATION OF THE REGRESSION MODEL FOR INVOLVEMENT CULTURE
Model R R Square Adjusted R Square Std. Error of the Estimate
1 0.474 0.225 0.213 4.4715642
Analysis of variance (ANOVA) determines whether the regression model results in significantly better prediction using the ‘F’ values. The value determines how much variability the model can explain relative to how much it cannot explain. It is the ratio of how good the model is compared with how bad it is (Field, 2009 cited in Kimutai, 2014). The results of ANOVA in Table 8 give a p-value of the above fitted model as 0.000 which is less than the level of significance of 0.05.
TABLE 8: SIGNIFICANCE OF THE REGRESSION MODEL IN PREDICTION OF ORGANIZATIONAL PERFORMANCE
Model Sum of Squares df Mean Square F Sig.
1 Regression 393.869 1 393.869 19.698 0.000 Residual 1359.652 68 19.995
Total 1753.521 69
This implies a highly significant overall model at 0.000. It can, therefore be concluded that the regression model results in significantly better prediction of organ-izational performance than if we used the mean value of organorgan-izational performance.
In equation 1, b0 is the Y intercept and this corresponds with value of B in the Table 9 for the constant. From the table the value of b0 is 8.560 units and this can be interpreted to mean that when involvement culture is not present or embraced by the organizations (X1 = 0), the model predicts that organizational performance will be 8.560 units.
TABLE 9: REGRESSION COEFFICIENTS OF INVOLVEMENT CULTURE Model Coefficients
B Std. Error t Sig.
1 (Constant) 8.560 2.049 4.178 0.000
(1) INVOLVEMENT CULTURE 0.449 0.101 4.438 0.000
VOLUME NO. 6 (2016), ISSUE NO. 06 (JUNE) ISSN 2231-5756 each predictor affects the outcome. Given b-value = 0.449, it implies that as involvement culture improves by one unit, organizational performance increases by 0.449 units. When the b-values are substituted in equation 1, the model can be defined as follows:
Y= 8.56 + 0.449 (Involvement Culture).
HYPOTHESIS TESTING
The hypothesis of the study was as follows:
H0 : Involvement culture has no influence on performance of commercial state corporations in Kenya.
To test this hypothesis, linear regression was performed to determine the level of significance of the relationship between mission culture and organizational performance of commercial state corporations in Kenya. As shown in Table 4.15, b1 = 0.449, p = 0.000. Since p-value is less than 0.01, the null hypothesis is rejected and therefore it can be declared that there is a highly significant relationship between mission culture and organizational performance in Kenya’s commercial state corporations.
To test whether the regression relationship was not positive, the b-value was subjected to further analysis using t-test. Calculated t-value was compared with the critical t-value. For involvement culture tcalc (69) = 4.438 while t0.95 (69) = 1.6672 at 0.05 level of significance. The null hypothesis was rejected because the calculated t-value was found to be greater than the critical t-value and therefore the alternative hypothesis that there was a significant positive relationship between involve-ment culture and performance of commercial state corporations in Kenya was adopted.
In relation to hypothesis one, there is significant positive relationship between involvement culture and organisational performance. This implies that increase in employee involvement is associated with increase in organisational performance. This finding supports earlier reports by Denison (1984) and Denison and Mishra (1995) that involvement culture is significantly correlated with return on assets. There are several reasons why employee involvement is related to performance. Organizations that have participative corporate cultures and well-organized workplaces have better performance records than those that do not have (Denison 1984). Receiving input from organization members tend to increase the quality of decision and improve their implementation. Profitability goals set by organiza-tions are easily achieved when employees are involved in decision-making. Involvement empowers, and empowerment increases motivation. Superior perfor-mance capabilities are created by employee empowerment. Organizations in which employees are involved in decision making will achieve their goals better than those that do not involve employees in decision-making (Amah, 2012). Parastatals that set unattainable targets without inputs from their employees have wit-nessed high employee turnover.
Other studies have shown that employee involvement is positively related to productivity (Rossler & Koelling, 1993). There are several possible explanations for this significant relationship. Employees reduce cost through recommendations to senior executives and this result in higher productivity. Involvement creates a sense of ownership and responsibility amongst employees and this motivates them to be more productive. Involvement increases commitment to the organization amongst employees. Committed employees are more productive than uncommitted employees. Empowerment enhances creativity in employees and this could lead to increased productivity. The finding suggests that organizations in which employees are involved will be more productive than those in which they are not involved. Parastatals in Kenya need to involve employees as much as possible to improve both the organizational processes and the individuals themselves. Denison (1990) stated that effective organizations require a high level of involvement. The finding that employee involvement is positively related to productivity is also supported by Kelleher (1995) in (McShane & Von Glinow 2006) who stated that the strength of Southwest comes not from products or services but from a unique culture and management philosophy that emphasizes employee involvement and empowerment. Based on the results one can say that involvement and organi-sational performance are positively related.
CONCLUSIONS
This study confirms the work of Denison (1990) and from the findings, it can be concluded that involvement culture had a positive and significant role in perfor-mance of commercial state corporations in Kenya. This is consistent with empirical literature.
RECOMMENDATIONS
Boards of Directors of Commercial State Corporations in Kenya need to consider corporate culture as an important ingredient in the performance of the corpora-tions. To turn around the corporations and achieve high performance they need to build and sustain a culture of involvement.
REFERENCES
1. Amah Edwinah, (2012). Corporate culture and organisational effectiveness: a case study of the Nigerian banking industry. European Journal of Business and Management, 4 (8) 212-229
2. Bavik, A. (2014). Developing the hospitality industry organizational culture scale: A New Zealand case study. Doctor of Philosophy Thesis University of Otago, New Zealand.
3. Behr, E. T. (1998). Acting from the center. Management Review, 87(3), 51-55. 4. Christensen, L.B. (1997). Experimental methodology, (7th ed.). Boston: Allyn & Bacon.
5. Chumo, B. (2013). Effects of Chief Executive Officers’ turnover and succession on the performance of state corporations in Kenya. PhD Thesis, Jomo Kenyatta University of Agriculture and Technology.
6. Cooper, D.R & P.S. Schindler, (2014). Business research methods. New York, McGraw-Hill/Irwin series.
7. Cortina, J.M. (1993). What is coefficient alpha? An examination of theory and applications. Journal of Applied Psychology, 78, 98-104. 8. Denison, D. R. (1984). Bringing corporate culture to the bottom line. Organizational Dynamics, 13 (2) 4-22.
9. Denison, D. R. (1990). Corporate culture and organizational effectiveness. New York: Wiley.
10. Denison, D.R. and Mishra, A.K. (1995). Toward a theory of organizational culture and effectiveness. Organization Science, 6 (2), 204-223. 11. Hair, J. et al. (2006). Multivariate data analysis (6th edition). Uppersaddle River, N.J.: Pearson Prentice Hall
12. Hosseini, S.A. (2014). Components of organizational culture based on Denison model. Arabian Journal of Business and Management Review, 3(12a),31-42. 13. Jaccard, J., & Becker, M. A. (1997). Statistics for the behavioral sciences (3rd ed.). Pacific Grove, CA, USA: Brooks/Cole Pub. Co.
14. Kelleher, D. (1996). A defence of the use of the term ethnicity and culture. In Kelleher, D.& Hillier, S. (Eds) Researching cultural differences in health. London. Routledge.
15. Kibui, A. W. et al. (2014). Role of talent management on employees retention in Kenya: a survey of state corporations in Kenya: Empirical review. International
Journal of Science and Research (IJSR) 3 (2) ISSN (Online): 2319-7064
16. Kimutai, G. (2014) Role of quality management system certification factors on health workforce performance in Kenyan referral hospitals. PhD thesis, JKUAT. 17. Lahiry, S. (1994). Building commitment through organizational culture. Training and Development, 3, 50-52.
18. Liu, Kiley & Ballard (2009). The relationship between organisational culture and effectiveness in the Western Cape banking industry. Journal of Business and
Management Dynamics, 3(1), 1-17.
19. Lok, P., & Crawford, J. (2004). The effects of organizational culture and leadership style on job satisfaction and organizational commitment. Journal of
Man-agement Development, 23(4), 321-338.
20. Mahmudah, E. W., (2012). Effects of organizational culture and ability on organizational commitment and performance in Ibnu Sina hospital, Gresik. Academic
Research International, 2(1), 349-355.
VOLUME NO. 6 (2016), ISSUE NO. 06 (JUNE) ISSN 2231-5756 22. McShane, S & von Glinow. (2006). Organisational behaviour. McGraw-Hill Higher Education.
23. Mouton, S. & Marais, H.C. (1994). Basic concepts in the methodology of the social sciences. Pretoria: HSRC.
24. Muhammad, A.K., (2008). Organizational culture and its impact on organizational performance. PhD thesis, National University of Modern Languages, Islam-abad.
25. Mwaura, K. (2007). The failure of corporate governance in state owned enterprises and the need for restructured governance in fully and partially privatized enterprises: The case of Kenya. Fordham International Law Journal, 33(1).
26. Nguyen, H. N. (2009). The impact of leadership behaviours and organisational culture on knowledge management practices in small and medium enterprises. PhD thesis, Griffith University.
27. Nguyen, T. P., (2015). The Corporate Culture and its Effect on Managerial Effectiveness in Vietnamese Companies; Proceedings of the Second Asia-Pacific
Conference on Global Business, Economics, Finance and Social Sciences (AP15Vietnam Conference) ISBN: 978-1-63415-833-6 Danang-Vietnam, 10-12 July, 2015 Paper ID: VL531
28. Nworgu, B.G. (1991). Educational research: basic issues and methodology, Ibadan: Wisdom Publishers Ltd
29. Ong’ong’e, M. (2012) The effect of autonomy on financial performance of commercial state corporations in Kenya. MBA Project Report, University of Nairobi. 30. Pallant, J. (2007). SPSS survival manual: a step-by-step guide to data analysis using SPSS for Windows (Version 15) / Julie Pallant (3rd ed.). Crows Nest, N.S.W.:
Allen & Unwin.
31. Pettinger, R. (2000). Mastering organisational behavior. New York: Palgrave.
32. Philip, G. & McKeown, I. (2004). Business transformation and organisational culture: The role of competency, IS and TQM. European Management Journal, 22(6):624–636.
33. Ravlin, E. C. & Meglino, B. M. (1987). Effect of values on perception and decision making: A study of alternative work values measures. Journal of Applied
Psychology, 72(4), 666-673.
34. Rossler, P.E. and Koelling, C.P. (1993). The effect of gain sharing on business performance at a paper mill. National Productivity Review, 12, 365-82. 35. Sang, H.W. (2015). The relationship between human resource management practices and labour productivity in state corporations in Kenya. PhD thesis.
JKUAT.
36. Sekaran, U. (2006). Research methods for Business: A skill building approach (4th ed.). New Delhi: John Wiley & Sons. 37. Sekeran, U & Bougie, R. (2010). Research methods for business: A skill building approach (4th ed.). London: John Willey & Sons.
38. Shitakwa, M. (2008). A Study of the relationship between performance contracting and performance of State – Owned Enterprises: The case of Agricultural Finance Corporation (AFC), Unpublished MBA thesis. Nairobi: University of Nairobi.
39. Tashakkori, A, & Teddie, C. (2010). Handbook of mixed methods in social and behavioural research (2nd edition). Thousand Oaks, CA: Sage
40. Tepeci, M., & Bartlett, A. (2002). The hospitality industry culture profile: a measure of individual values, organizational culture, and person-organization fit as predictors of job satisfaction and behavioral intentions. International journal of hospitality management, 21(2), 151-170.
41. Wario, G. (2012) The role of HRM in intra-firm operationalization of tacit knowledge in Kenyan state corporation. PhD thesis, JKUAT.
42. Weru, J.M., (2014). Role of human resource management in adoption of quality management systems among state corporations in Kenya. PhD thesis, JKUAT. 43. Zain, Z.M. et al (2009). The influence of corporate culture on organisational commitment: a study of Malaysian listed company. European Journal of
VOLUME NO. 6 (2016), ISSUE NO. 06 (JUNE) ISSN 2231-5756
A STUDY ON PATIENTS’ SATISFACTION TOWARDS SERVICES PROVIDED BY PRIVATE HOSPITALS IN ERODE
TALUK, ERODE DISTRICT
S. SASIKALA
ASST. PROFESSOR
NAVARASAM ARTS & SCIENCE COLLEGE FOR WOMEN
ERODE
DR. C. VADIVEL
PRINCIPAL
BHARATHIAR UNIVERSITY ARTS & SCIENCE COLLEGE
ERODE
ABSTRACT
Healthcare service quality is even more difficult to define and measure than in other sectors. A critical challenge for health services in developing countries is to find ways to make them more client-oriented. The present study aims at analyzing the saisfaction of the patients in private general hospital services. In the present study 150 patients were selected from 21 private hospitals in Erode taluk. Data were collected with validity and reliability questionnaire which were analyzed using chi-square test and weighted score ranking analysis. In this study, 56 % of participants were female. 64% of the respondents were married and they are under the age group of above 45 years. There was a statistically significant relationship between educational qualification of the respondents and patient’s satisfaction on expert in diagnosing the diseases and also between monthly family Income and level of satisfaction on fees charged. Majority of the respondents are satisfied with Doctors Experience, Doctors punctuality at all times and Expert in diagnosing diseases. From the study it was observed that patient’s recommendations regarding Limited time spent for each patient, Intensive care unit (ICU) & lab facilities and Heavy dosage has strongest effect on the satisfaction level of the patients.
KEYWORDS
patients satisfaction, private hospitals, Erode district.
INTRODUCTION
ervice industry has played increasingly important role in the economy. In emerging countries, it has become one of the fastest growing sectors. The rapid growth of this sector has been accompanied by dramatic changes in the environment, challenging health care managers and administrators to find alter-native ways of remaining viable.
Healthcare service quality is even more difficult to define and measure than in other sectors. Distinct healthcare industry characteristics such as intangibility, heterogeneity and simultaneity make it difficult to define and measure quality. Healthcare service is an intangible product and cannot physically be touched, felt, viewed, counted, or measured like manufactured goods. Producing tangible goods allows quantitative measures of quality, since they can be sampled and tested for quality throughout the production process and in later use. However, healthcare service quality depends on service process and customer and service provide interactions.
Healthcare services can differ between producers, customers, places, and daily. Healthcare outcomes cannot be guaranteed. Quality healthcare is a subjective, complex, and multi-dimensional concept. Issues related to healthcare quality are crucial to any health system anywhere in the world. Therefore, a survey of patients’ opinions regarding the provided service is one of the main tools to measure the quality of healthcare services. There is a general agreement that patient satisfaction is an essential component of service.
Measuring the value of any healthcare resources level refers to healthcare quality. The main aim of healthcare is to provide medical resources of high quality to all. Most people would define healthcare quality as receiving best care possible for one’s illness or condition, and for many, it also includes the entire experience of receiving care-including the avoidance of errors or mistakes.
Services can be regarded or disregarded by patients depending on the ratings they base on. Patients’ satisfaction is basic. Dissatisfied patients tend to launch complaints to the establishment or seek redress from it more often and dis- suade others from seeking health care services from the system if the systems do not favour them. All healthcare providers should realize the fact, that the main beneficiary of healthcare- system is clearly the patient.
A critical challenge for health services in developing countries is to find ways to make them more client-oriented. Indifferent treatment of patients, unofficial payments to providers, lack of patient privacy, and inadequate provision of medicines and supplies are common, yet are rarely acknowledged by traditional quality assessment methods. Hospitals have expanded in terms of availability of specialties, improved technologies, facilities and increased competition and the expecta-tions of patients and their relatives have increased many fold. Consumer expectation in any medical experience influences whether how soon and how often they seek care from which medical facility. Previously, there were very few government hospitals with no charge to the patients. Hence, the expectations were also very minimal. But now, the scenario has changed. The hospitals (even Govt.) have started charging the patient in the name of user charges. Private hospital care cost has gone very high. With the advent of Consumer Protection Act (1986), the patient’s expectation has also gone very high. Now hospitals have to be very careful about patient dissatisfaction to avoid any unnecessary litigation.
LITERATURE REVIEW
Mst. JoynabSiddiqua, Md. Ariful HaqueChoudhury (2014) Service quality has been viewed as a determinant of patient satisfaction. Different dimensions of service quality have been considered by various researchers. This study identifies components of service quality of private Hospitals in Dhaka city. Data are collected from seventeen private hospitals. For gathering data, a questionnaire is designed by closed ended 29 questions and the respondents were 110 patients of different hospitals. The study is exploratory in nature and uses chi –square test to find out the relationship between different variables to identify the most important factors of customer satisfaction with service quality. The research methodology is empirical and a survey of patients (customers) was conducted. The findings reveal that the overall service quality regarding private hospitals are providing satisfactory service to the patients without discriminating by income or occupation. It requires government attention to formulate regulation regarding private midicare sysem to ensure providing better quality services.
Dhyana Sharon Ross, Dr. R. Venkatesh (2015) Patient satisfaction on healthcare quality plays a vital part on the assessment of healthcare frequently. Measuring the value of any healthcare resources level refers to healthcare quality. The main objectives are 1.To analyze factors influencing quality in healthcare and patient satisfaction,2.To study patient perception towards factors influencing quality, and 3.To assess the role of hospital administrators towards quality and patient satisfaction. The study adopted a questionnaire survey amongst patient/attendants and administrators. The hospital chosen for study were all corporate hospitals in the capital city of Tamil Nadu, India. Totally 272 samples were collected, 208 from patients/ attendants and 64 from hospital administrators using simple random sampling technique. Friedman test and chi-square test were used for statistical analysis. The study concludes that physical facilities is the most important factor on healthcare quality, followed by food and behavior of staff and admission procedure from patient perspective. Based on the years of experience of staff the level of understanding on healthcare quality differs widely with high experienced staff with more knowledge on healthcare quality.
VOLUME NO. 6 (2016), ISSUE NO. 06 (JUNE) ISSN 2231-5756
STATEMENT OF THE PROBLEM
Health care sector, like other service organizations has become a highly competitive and rapidly growing service industry around the world. Not only the diseased, even the healthy people visit doctor for a checkup, since prevention is better than cure. It‟s because of people move far away from natural life, changing food habit, mechanical life, pollution, and western culture. In health care, patients’ attitude and satisfaction are considered to be the major indicator to assess the performance of health care organization. The real progress of health care organization lies in how best it can deliver service with respect to health care consumer’s needs and wishes.
The private hospitals, on the other hand, enter the health industry for both profit and social enterprises. It already plays and will continue to play a pivotal role in improving the health of the people. This service encourages the customers to visit the hospital repeatedly. Dissatisfaction with public health care sector is also shifting demand toward private health care sector. Hence research is made to conduct the study on patients satisfaction towards services provided by private general hospitals in Erode Taluk.
OBJECTIVES OF THE STUDY
MAIN OBJECTIVEA study on patients’ satisfaction towards services provided by private general hospitals in Erode Taluk, Erode district. Tamilnadu, India. SECONDARY OBJECTIVES
To know the socio-economic profile of the respondents.
To identify the factors that influence the patients to select the hospital.
To analyze the level of Satisfaction regarding the services offered by the private general hospitals. To ascertain the grievances faced by the respondents.
To offer suggestions to improve the services rendered in the hospitals. HYPOTHESES
Ho: There is a no significant relationship between independent and dependent variable. Ha: There is a significant relationship between independent and dependent variable.
Independent variable taken for the study includes Age group, Occupational status, Educational qualification and Monthly income of the respondents. Patients satisfaction was taken as Dependent variable.
RESEARCH METHODOLOGY
Methodology is the way to solve the research problems systematically. It may be understood as a science of studying how research is done scientifically. The researcher has selected a particular place randomly for survey. The researcher obtained information on the patient (outpatient) Attitude and satisfaction with the services offered by private general hospitals in Erode Taluk, Tamilnadu, India.
SAMPLING METHOD: The study samples were collected from private General hospitals in Erode taluk. Erode taluk comprises of only one block named Erode town. There are 21 private general hospitals in Erode taluk. All the hospitals were taken for the study purpose.
DATA COLLECTION PROCEDURES: The researcher used a self-administered questionnaire to collect data for the research. Self-administered questionnaire is the survey in which respondents take responsibility for reading and answering the questions. It is considered as a superior mode for minimizing bias and improving response rates. The effects of independent variables on the dependable variable are assessed by the 3-point Likert attitude scale.
Secondary information was gathered from different secondary sources such as books, magazines, journals, newspapers and online databases via internet etc. These data are usually available, can be obtained quickly and inexpensive. Sample survey or cross-sectional survey was the main method to explore attitudes of patients’ and satisfaction with private general hospitals in Erode Taluk. This is a method of primary data collection in which information is based on communication with a representative sample of target population at a point in time. In this research, a total of 160 questionnaires were distributed to the patients visiting private hospitals, who met the sampling requirements. A total of 150 questionnaires were returned to the researcher so the response rate is approximately 93.75%. Data collection took nearly 2 weeks from May 20th to May30th, 2016.
TOOLS FOR ANALYSIS: Data collected through questionnaire were presented in a master table. From the master table, sub-tables were prepared. In order to analyze and interpret the data simple statistical tools were followed like,
Simple Percentage analysis. Chi-Square analysis.
Weighted score ranking analysis.
RESULTS AND RECOMMENDATIONS
TABLE 1: PERCENTAGE ANALYSIS (N=150)
Source: Primary data
s. no variables No. of respondents Percentage(%)
Gender Male 84 56
Female 66 44
Age group Below 25 years 42 28
25to 35 years 34 22
36 to 45 years 26 17
Above 45 years 48 30
Marital status Married 96 64
Unmarried 54 36
Educational qualification Illiterate 28 18
Primary level 38 25
Secondary level 48 32
College level 36 24
Occupational status
Monthly family income
Agriculture 32 21
Student 19 12
Employed 33 22
Business 40 26
Housewife 26 17
Rs.10,001 to Rs.20,000 34 22
Rs.20,001 to Rs.30,000 41 27
Rs.30001 to Rs.40000 50 33
VOLUME NO. 6 (2016), ISSUE NO. 06 (JUNE) ISSN 2231-5756 Among the Demographic and socio-economic factors, 56% were males as against 44% females. 64% of the respondents were married,30% of respondents were comes under the age group of above 45 years. and 32%of the respondents have secondary level of education.26% were doing business and their monthly family income is between Rs.30001 to Rs.40000.
TABLE 2: LEVEL OF SATISFACTION WITH REGARD TO DIFFERENT TYPE OF SERVICES RENDERED IN PRIVATE HOSPITAS
s.no Factors Level of satisfaction
Highly satisfied Satisfied Dissatisfied Total
1 Experience Doctors 26
(17%) 90 (60%) 34 (23%) 150
2 Doctors are punctual at all times, 19 (13%) 104 (69%) 27 (18%) 150
3 Expert in diagnosing diseases. 46 (31%) 72 (48%) 32 (21%) 150
4 Immediate cure 38
(25%) 82 (55%) 30 (20%) 150
5 Providing proper treatment 51 (34%) 78 (52%) 21 (14%) 150
6 Waiting time of patients. 18 (12%) 76 (51%) 56 (37%) 150
7 ICU & lab facilities. 31 (21%) 39 (26%) 80 (53%) 150
8 Fees charged 15
(10%) 72 (48%) 63 (42%) 150
9 Prescribing more medicine 11 (7%) 63 (42%) 76 (51%) 150
10 Efficiently respond to the patients. 50 (33%) 57 (38%) 43 (29%) 150
Source: Primary data
The above table reveals that, respondents are satisfied with Doctors Experiance, Doctors punctuality at all times, Expert in diagnosing diseases. Immediate cure, proper treatment, waiting time. But still some of the factors like ICU & lab facilities., fees charged by the doctors Prescribing more medicine provide dissatisfaction to the respondents for which they need some modifications.
CHI-SQUARE ANALYSIS
TABLE 3.1: AGE GROUP OF THE RESPONDENTS AND OVERALL SATISFACTION (Two-way table)
S.No
Age group Level of satisfaction
Total
Highly satisfied Satisfied Dissatisfied
1 Below 25 years 8 (22%) 14 (19%) 12 (29%) 34
2 25-35years 10 (27%) 22 (30%) 10 (24%) 42
3 36-45 years 7 (19%) 13 (18%) 6 (15%) 26
4 Above 45 years 12 (32%) 23 (32%) 13 (32%) 48
Total 37 72 41 150
Source: Primary data
TABLE 3.2: AGE GROUP OF THE RESPONDENTS AND OVERALL SATISFACTION (Chi-Square test)
Factors Calculated value (X2) Table value Degree of freedom Significant level
Age group 5.00 12.592 6 5%
The above table shows that the calculated chi-square value (5.00) is less than the table value (12.592).So null hypothesis is accepted. Hence there is a no relationship between age group of the respondents and overall satisfaction.
TABLE 4.1: EDUCATIONAL QUALIFICATION AND LEVEL OF SATISFACTION ON EXPERT IN DIAGNOSING DISEASES (Two-way table)
S.No Educational Qualification Level of satisfaction
Total
Highlysatisfied Satisfied Dissatisfied
1 Illiterate 10
(22%) 8 (11%) 10 (31%) 28
2 Primary level 14
(30%) 18 (25%) 6 (19%) 38
3 Secondary level 12
(26%) 26 (36%) 10 (31%) 48
4 College level 10
(22%) 20 (28%) 6 (19%) 36
Total 46 72 32 150
Source: Primary data
TABLE 4.2: EDUCATIONAL QUALIFICATION AND LEVEL OF SATISFACTION ON EXPERT IN DIAGNOSING DISEASES (Chi-Square test)
Factors Calculated value (X2) Table value Degree of freedom Significant level
Educational qualification 16.73 12.592 6 5%
The above table shows that the calculated chi-square value (16.73) is greater than the table value (12.592).So null hypothesis is rejected. Hence there is a close relationship between educational qualification of the respondents and level of satisfaction on expert in diagnosing the diseases.
VOLUME NO. 6 (2016), ISSUE NO. 06 (JUNE) ISSN 2231-5756 TABLE 5.1: OCCUPATIONAL STATUS OF THE RESPONDENTS AND OVER ALL SATISFACTION (Two-way table)
S.No
Occupational Status Level of satisfaction
Total
Highly satisfied Satisfied Dissatisfied
1 Agriculture 8
(22%) 14 (19%) 10 (24%) 32
2 Student 6
(16%) 8