A b s t r a c t. In this research a non-destructive, rapid and cost effective examination machine for the estimation of the ripeness fraction, oil content and free fatty acid level in oil palm fresh fruits bunch was developed. The automatic machine-vision based in-spection system provided consistency, rapid estimation and accep-table accuracy results in non-destructive manner. Fresh fruits bunch samples from Tenera cultivar (7 to 20 years trees) were taken from Cimulang plantation, Bogor, Indonesia. Two statistical analysis methods were used: a forward stepwise multiple linear regression analysis and a multilayer-perceptron artificial neural network analysis. The best prediction of ripeness and oil content models were obtained using the latter method, while the best free fatty acid prediction model was developed by the first method. The models were then employed in the machine-vision inspection systems of the machine. The system best prediction accuracy of ripeness, oil content and free fatty acid models was 93.5, 96.41, and 89.32%, with standard error of prediction being 0.065, 0.044 and 0.068, respectively. The system was tested through a series of field tests, and successfully examined more than 12 t of fruits bunch per hour, without causing damage.
K e y w o r d s: oil palm, fresh fruits bunch, automatic quality inspection, machine vision, non-destructive evaluation
INTRODUCTION
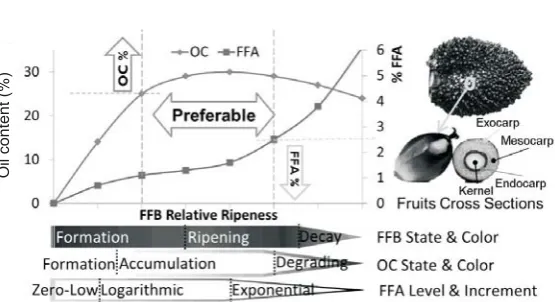
The quality of oil palm (Elaeisguineensis Jacq.) fresh fruit bunches (FFB) can be determined by their conditioneg. ripeness, damage or bruises. Correspondingly, the purchas-ing value ofFFBsshould be based on bunch appearance and prediction of the quantity and quality of oil that can be extrac-ted from the bunch. Ripe bunches are desirable (Fig. 1), since they have more oil compared to unripe ones, with lower free fatty acid (FFA) than over-ripe bunches (Siregar, 1976). This makes the bunch ripeness become a major factor for determining the quantity and quality of oil yield. Ideally,
upon purchasing theFFBs, oil palm mills should know the oil contains of eachFFBas well as its quality (Makkyet al., 2013a). However, only ripeness can be determined by ma-nual visual inspection, while other properties cannot be de-termined until the milling process is completed (Makky and Soni, 2014). AlthoughFFBsoil content (OC) can be pre-cisely measured manually in the laboratory, it is neither cost effective nor feasible to analyse every singleFFB in the processing line. Another constraint inFFBmanual quality inspection is the risk of damage and injury toFFBsduring inspection, which should be avoided, since it will reduce the quality of oil due to increment ofFFAlevel in the fruits cau-sed by acceleration of lipolytic activity (Hadiet al., 2009). Level ofFFAdetermines the price and quality of crude palm oil (CPO) produced, and affects the decision on method of production, storing and marketing of the CPO (Saadet al., 2006). To address these problems, a non-destructive, rapid and cost effective examination system that can determine ripe-ness and estimate theOCandFFA level in everyFFB is required. An automatic inspection machine with machine-vision-based system may provide consistent and quick exami-nation with acceptable accuracy and non-destructive nature. A wide range of applications of imaging techniques for agricultural products have been used to assess the physical and chemical properties of commercial agricultural products such as apples (Nicolaiet al., 2007; Zduneket al., 2014), barley (Zapotoczny, 2012), beets (Arenas-Ocampoet al., 2012), date fruits (Mireeiet al., 2010), eggs (Asadiet al., 2012), maize seeds (Hernandezet al., 2011), rose peduncles (Matsushimaet al., 2013), wheat (Arefiet al., 2011), as well as other biological material (Briseño-Tepepaet al., 2008; Gonzalez-Ballesteroset al., 2006).
Int. Agrophys., 2014, 28, 319-329 doi: 10.2478/intag-2014-0022
Automatic non-destructive quality inspection system for oil palm fruits
Muhammad Makky
1,2,3, Peeyush Soni
1*, and Vilas M. Salokhe
41Agricultural Systems and Engineering, Asian Institute of Technology, Pathumthani 12120, Thailand 2
Department of Agricultural Engineering, Andalas University, West Sumatera 25163, Indonesia
3
School of Agricultural Technology, Alexander Technological Educational Institute of Thessaloniki, Thessaloniki 57400, Greece
4
Kaziranga University, Jorhat, Assam, India
Received March 11, 2013; accepted November 18, 2013
© 2014 Institute of Agrophysics, Polish Academy of Sciences
*Corresponding author e-mail: [email protected]
In addition, the application of imaging technologies in an automatic inspection system for commercial agricultural products increases the machines potency in terms of speed, volume and continuity of work (Hernandez et al., 2010; Koenderinket al., 2010; Kondo, 2010).
Using machine vision, several researches regarding FFBripeness assessment have been carried out (Jaffaret al., 2009; Jamilet al., 2009; Makkyet al., 2004; Makky and Soni, 2013b; Roseleenaet al., 2011). However, those works were focused mainly on ripeness determination ofFFB ba-sed on its physical appearance. On the other hand, only limi-ted literature is available on the relationship between phy-sical appearance ofFFB and its oil content (Razaliet al., 2011; Shaaraniet et al., 2010), as well as association of physical appearance ofFFBwith itsFFA(Junkwonet al., 2009; Makky and Soni, 2014). Nonetheless, all those studies were undertaken either under laboratory conditions or without the use of machine vision or automation technology. The esti-mation ofFFBsoil content andFFAstill remains a manual task which is time consuming, expensive and labour intensive.
The objective of this work was to assess the quality pa-rameters of oil palmFFBby utilising machine-vision based automatic inspection system platform. In the previous work (Makky and Soni, 2013b), an automatic grading machine for oil palmFFBwas developed with the main focus on the de-termination of physical appearance quality of theFFB. In this research, further development of this machine was done, that enables the machine to assess not only the ripeness of theFFB, but also itsOCandFFAproperties by means of non-destructive technique. The performance of the inspec-tion machine was compared to manual and laboratory asses-sment for these three features. The tests were carried out under field operation.
MATERIAL AND METHODS
For the assessment purpose, the inspection machine from previous work (Makky and Soni, 2013b) was upgraded, including its mechanical system, control system, and machi-ne vision system. The machi-new system comprized mechanical platform, electronic control systems, and operational systems.
The mechanical platform included a ladder type chas- sis to support the whole equipment, evenly-arranged idle rollers to support the conveyor belt, dynamic rollers driven by the electric motor through speed reducer gearbox and chain-sprocket power transmissions to rotate the conveyor, and a separator gate driven by two motors and limit switches to segregate the substandard fruits bunch. The electronic control systems consisted of a portable computer as central processing unit, single chip programmable interface for controlling moving parts and actuators, and input-output analogue-to-digital and digital-to-analogue peripherals for interfacing the mechanical parts with the computer, thus enabling communication and feedback between components and control systems. The whole system runs by an operatio-nal system in the form of a custom made image processing program, performing the qualitative and quantitative ana-nlyses of the samples.
Using the same chassis platform, modification was done in several sections of the machine. The conveyor belt was repainted with white colour to provide best contrast between the belt and the object (FFB), which enables image to be segmented properly. The tone surface of conveyor enables light to be scattered, thus reducing reflection of light that might interfere during image acquisitions. The power drive and transmission unit were unchanged, while the dampers were replaced to provide more stable (shock-free) conveyor belt operation. The separator movement is now limited to only 45° to ease segregation of poor qualityFFB, according to inspection results.
The control system layout was revised accordingly. The position of the laser emitter and light dependent resistors (LDR) sensor were placed further back down toward the exit of the inspection chamber (Fig. 2). The repositioning was aimed to enable the wholeFFBsection to be captured in the image, especially for the extremely large bunch. The soft-ware program for running the single chip microcontroller (SCM) was modified to accommodate the repositioning of LDR sensor as well as the adjustment of limit switches that govern separator gate movement, while maintaining the In System Programmable (ISP) capability.
Fig. 1.Physical and chemical development ofFFBupon maturing.
Oil
content
The real time image acquisition and analysis was improved. The image processing software in machine vision system was modified to enable assessment of two otherFFB quality properties,ie OCandFFA(Fig. 3). The image pro-cessing software was developed using C# (SharpDevelop 3.2, IC#Code Team) and Visual Basic (VB 6.0, Microsoft)
programming by utilizing native Win32 application pro-gramming interface (API). The capturedFFB image was segmented to extract the features, in order to calculate the ripeness,OCandFFA. The separation ofFFBis based on its ripeness,OCandFFAestimation by the software (Fig. 4). The whole system runs automatically without the necessity of an operator to control the process. However, one person labour was required to feed theFFBonto the conveyor belt. The inspection chamber dimensions and conveyor belt speed, as well as the procedure of feedingFFBonto the machine, ensure that only oneFFBenters the chamber at a time.
TheFFBfeatures from each captured image were cal-culated and stored. The features included the number of Pixels in the object as well as its red-green-blue (RGB) digi-tal number (DN). The data of each pixel were calculated and stored in variables, namely object pixel, R, G, and B. The performance of colour recognition using machine vision system relies heavily upon the choice of appropriate colour range and the characteristics of variables employed in the calibration model. Therefore, in this work, the image pro-cessing program transforms image RGB colour model into hue-saturation-intensity (HSI) (Gonzalez and Woods, 2008) to generate more information on the object. The results were Fig. 2.Reposition of laser detection in the machine vision
in-spection system.
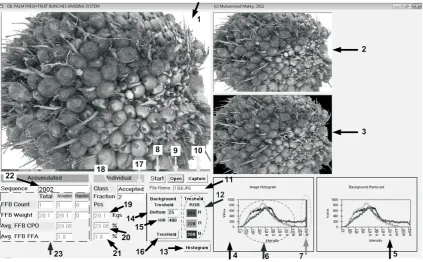
Fig. 3.The image processing program display. 1. Camera live view, 2. Snapshot image, 3. Segmented image, 4. RGB histogram from recorded image, 5. RGB histogram from segmented image, 6. Object of interest, 7. RGB background, 8. Run system with Single Chip Microcontroller SCM interfacing I/O operation, 9. Run program using stored image, 10. Run system by manually capturing frame from camera, 11. Uploaded file name, 12. RGB threshold value for segmentation, 13. Reload segmented image histogram after manually changed threshold value, 14. Initial lower bound for adaptive thresholding, 15. Initial upper bound for adaptive thresholding, 16. Reload the threshold after manually changed bottom and hill value, 17. CurrentFFBclassification result accepted = F1, F2, F3; rejected = F00, F0, F4, F5, F6., 18. CurrentFFBFraction, 19. CurrentFFBmass estimation, 20. CurrentFFB OCestimation, 21. CurrentFFB FFA
assigned as variables H, S, and I. To minimize the effect of change in intensity, normalization of RGB DN data into nor-malized: R (r), G (g) and B (b) were performed by methods mentioned in Makky and Soni (2013b). Another feature extracted from the image was ripeness index (RI) described by Roseleenaet al. (2011). That set of variables (object pixel, R, G, B, H, S, I, r, g, b, RI) was used as independent variables for generating models for the estimation ofFFBs ripeness, oil content andFFA.
The FFB scan be classified into 8 ripeness fractions (Makky and Soni, 2013b). In this research, 180FFBsamples of Tenera cultivar were taken randomly from oil palm trees aged 7 to 20 years, from Cimulang plantation, Bogor,
Indo-nesia. All FFB images were captured in the inspection chamber to extract the features from the object. To inactivate the lipases, the samples were boiled immediately. Oil that dissolved into water during boiling was measured using the method described by American Public Health Association (APHA, 2005).
For assessing the ripeness of eachFFBsample, a panel of three experienced graders was appointed. In the laboratory analysis, 25 samples of fruitlets from each bunch were used to analyse the oil content andFFAlevel in the laboratory. The fruit samples were taken from different sections of each bunchie. top, middle, and bottom part. The number of fruits selected from the inner, middle, and outer part of the bunch (Fig. 5) were eight, eight and nine fruits, respectively. The tests were conducted during November until December 2011.
For measuring the oil content in fruit mesocarp, fruit samples were detached from spikelet, and pared to separate the mesocarp. The mesocarp was then weighed using analy-tical balances (Sartorius, BP 160 P, Germany) for ensuring high measurement accuracy. Samples were then dried in the oven for one day to remove physical water from the meso-carp. The oil in the mesocarp was extracted using a soxhlet extractor, with hexane as chemical solvent. The extraction process was complete after hexane colour in the soxhlet became translucent. The remaining fibre and the oil solution in the thimble were dried to remove the dissolved hexane, and then cooled in a desiccator. It was then weighed in the analytical balance, and the result was recorded for mesocarp oil content calculation, as specified by Indonesian Oil Palm Research Institute (IOPRI, 1997). The mesocarp oil (Oilm) can be calculated as:
%Oil M M %
M m=
-1 2
3
100 , (1)
Fig. 4.FFBhierarchy grading selection.
where:M1is thimble and oil mass (g),M2is empty thimble
mass (g), andM3is mesocarp sample mass (g).
The CPO recovery from the sampleFFBwas calculated using the equation:
%OC M % %
M M Oil
f
FFB m m
=å (2)
where:OCis oil content,Mfis fruitlets mass (kg),MFFBis mass ofFFB(kg), %Mmis percentage of mesocarp mass from fruitlets (%), %Oilmis percentage of mesocarp oil.
Free fatty acid is considered as an important quality parameter for CPO. FFA is formed in the process of oil hydrolysis to become acid. Accelerated by light and heat, FFAformed in CPO decreases the smoking point (Bobbio and Bobbio, 2001) and is responsible for undesirable fla-vours and aroma (Osawaet al., 2007).
Since the oil extraction process using the soxhlet invol-ves heat and requires significant time, there might be a risk that the extracted oil becomes degraded and raises theFFA level, and thus significantly affects the measurement accu-racy. For this reason, the oil used forFFAlevel assessment in this work was taken from the mesocarp of boiled fruits samples, and extracted using a mechanical squeezer. This was done to evade oil degradation and to increase the accuracy ofFFAmeasurement. TheFFAin the oil was mea-sured by the titration method (IOPRI, 1997; AOCS, 2004; NSAI, 2006). The percentage ofFFAin CPO was calculated as palmitic acid and interpreted as the mass of KOH (in milligrams) required to counteract acid from 1 g of sample. In this research,FFAwas measured using the procedure de-fined by IOPRI (1997) in accordance with standards estab-lished by the National Standardization Body of Indonesia, SNI 01-2901-2006 (NSAI, 2006). This procedure meets the qualification according to the American Oil Chemist Society (AOCS, 2004) official method Ca 5a-40. The percentage ofFFA(as palmitic acid) is expressed as:
%FFA as palmitic( ) . NV M
=25 6 , (3)
where:V– volume of KOH (ml),N– normality of KOH, and 25.6 is the constant based on the molar mass of palmitic acid, andM– sample mass (g).
For modelling the ripeness,OC, andFFAof oil palmFFB in the image processing algorithm, two analyses were per-formed using Forward Stepwise Multiple Linear Regression (FS-MLR) and Multilayer-Perceptron Artificial Neural Network (MP-ANN) method. These two methods were intro-duced using Statistical engineering software (IBM, USA) to generate theFFBquality models: ripeness fraction,OCand FFAprediction. The models are created by regressing ma-nual assessment results with features extracted from the images (ie. Object pixel, R, G, B, H, S, I, r, g, b, RI). Insignificant variables were identified and removed using F-statistics. Data acquired from 180 samples were split evenly into three parts. The first two parts were used as data training for creating the models, and the rest was used for cross-validation of the accuracy of the models.
The FS-MLR analysis for modelling has been succes-sfully used for model calibration (Liuet al., 2008; Makky and Soni, 2014; Naes and Mevik, 2001). This method can improve model accuracy by removing collinearity in va-riables, thus increasing the efficiency of the algorithm re-sults. By introducing fewer variables compared to common Multi Linear Regression analysis, the prediction accuracy of the model generated using this method can be expected to increase significantly. The FS-MLR prediction models were constituted of several variables, however, it is precarious to determine the importance of each variable due to col-linearity problems, although the exegeses of the model re-main possible. The advantage of models generated using FS-MLR method is the simplicity of the equation to be writ-ten in mathematical form. Common multiple linear regres-sion can be written as:
yi=b0+b1 1x+ +... bn ix +ei, (4) where:yiis regression,xiis input variables or predictors,bI is regression coefficients,b0is intercept andeiis error term.
The MP-ANN analyses for modelling theFFBquality assessments were used for approximation estimation ofFFB qualities (ie. ripeness,OCandFFA) by training a set of multi-layer perceptron, input multi-layers, hidden multi-layers and output layer. To avoid over-fitting of the models upon training, which may lead to poor performance upon validation, the set of hidden layers and processing elements were set to be changed automatically by the software.
All models were built using statistical engineering soft-ware (IBM, USA). In analysing the data, confidence level of 99.99 was used (p<0.01), along with boosting accuracy option in the software.
The models performance was evaluated by comparing the prediction results and measured values, in the validation sets. The main performance statistics for model validation were the coefficient of determination (R2), the standard error of calibration (SEC) and the standard error of pre-diction (SEP) (Makky and Soni, 2013b; 2014).
RESULTS AND DISCUSSION
The inspection machine was run through a series of tests in actual field conditions. During the tests, the accuracy of the models was validated. The effectiveness of operation was examined for all components of the developed machine. Feeding ofFFBby the operator resulted in irregular orien-tation of the bunch on the conveyor belt. However, the results show no significant differences.
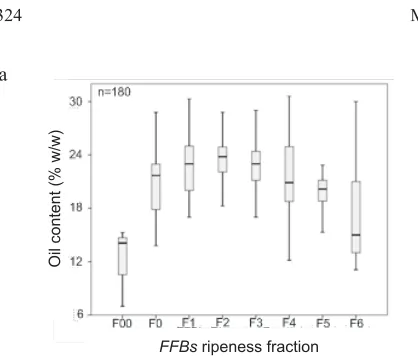
samples of fractions 4, 5 and 6 had lowerOCcompared to FFBin fractions 1, 2, and 3, while theFFAlevel wasvice versa. The reason was, when calculated as the whole bunch, the percentage of oil content inFFBwas decreased due to the increasing number of detached fruitlets in the field, many of which cannot be recovered due to various factors. The desirableFFBought to have a highOC, while theFFAin the oil is low. The chemical analysis results showed that mode-rately ripeFFBswithin fraction range of 1 to 3 are preferred over the higher fractions, considering theirOCandFFA.
Images captured by the camera were segmented by the image processing program to remove the background. The adaptive thresholding algorithm used in the program sepa-rated the object from its background in the image, rapidly and accurately, without losing object features. A texture analysis of the image was done to classify the RGB value of specific components of the object in order to distinguish among fruitlets, spikelets, and other parts (Fig. 7).
The case of multiple linear regressions in real-world regression models involves multiple predictors, where the response variable y or regression is still a scalar. Therefore, the model for ripeness fraction of oil palm FFB can be written as:
Fraction= -4.1 10-5Object pixel+8.43 10-2R+6.95 10-2G -6.03 10-2B+14.39g-5.05b+0.012H–9.06 10-2I-1.81 (5) where:FractionisFFBripeness fraction estimation, Object pixel is the number of pixel in the object, R, G, and B are the average of red, green, and blue DN in the object,gandbare the average of normalized green and blue DN in the object, HandIare the average of hue and intensity DN in the object. In fraction model, two predictors are excluded,randS, for being insignificant (p>0.01).
As for the model of oil content (OC), it can be written as:
OC= 8.3 10-2R-9.86 10-2B-17.82r+51g-51.89b+
0.13H+3.95 10-2S+0.26RI+7.18 (6)
where:OCis percentage estimation of oil content inFFB, R andBare the average of red and blue DN in the object,gand bare the average of normalized green and blue DN in the object,HandSare the average of hue and saturation DN in the object, andRIis the ripeness index of theFFBsample based on the proportion of the R, G, and B in the object (Roseleenaet al., 2011). VariablesGandIwere excluded being insignificant (p>0.01).
Fig. 6.Measured: a –OC, and b –FFAaccording to ripeness fraction.
a b
Fig. 7.Texture analysis ofFFBimage: a – original image, b – textured image.
a b
Oil
content
(%
w
/w
)
Free
fatty
acid
(%
w
/w
)
TheFFAmodel is given as:
FFA=-0.084R+250r+119.21g-4.14b-0.05S+
0.064I+6.5 10-5RI-9 (7)
where:FFA is percentage estimation of free fatty acids in FFB,Ris the average of red DN in the object,r,g, andb are the average of normalized red, green, and blue DN in the object, S and I are the average of saturation and intensity DN in the object, andRIis the ripeness index of the FFB sample based on the proportion of the R, G, and B in the object (Roseleenaet al., 2011). In theFFAmodel, variables G, B and H were excluded (p>0.01). The models results for ripeness,OCandFFAassessment using FS-MLR method are described in Table 1.
For the models formulated using MP-ANN method, the matrix of predictors, mass, and coefficients for each re-gression are presented in Tables 2 and 3, where values in-dicating synaptic network mass and strength of con-nections are given. The models developed by two statistical methods perform differently in predicting each of three assessed FFB properties. For ripeness fraction and OC prediction, models developed using MP-ANN statistical analysis perform better, while FS-MLR statistical analysis has better model for predicting theFFA. The comparative results of the models are presented in Table 4.
Out of three models for assessingFFBproperties, only the performance ofFFBripeness fraction classification can be done using the receiver operating characteristic (ROC) curve analysis. Selection of ROC analysis was considered of importance for performance analysis ofFFBfraction classifi-cation to better understand the sensitivity and specificity balance of the models, while reducing the determination scores. The ROC performance analysis was closely
correla-ted to the area under the curve, which refleccorrela-ted the model accu-racy. The area with value near to 1 indicates that the model significantly separated the classes, while the area value of 0.50 shows that the predictor is no better than chance.
The ROC curve analysis for ripeness classification mo-dels by means of FS-MLR and MP-ANN statistical analysis method is presented in Fig. 8.The area under the curve for FS-MLR model (Fig. 9a) is 0.846, lower compared to the va-lue of 0.935 of MP-ANN model (Fig. 9b). This result strong-ly suggests that a model developed by means of MP-ANN statistical analysis forFFBripeness classification is prefe-rable, rather than employing FS-MLR method. With 99.99% confidence interval, the area under the curve is significantly dif-ferent from null hypothesis true area. Moreover, since the p-value was achieved as 0.000, it was concluded that the clas-sification results significantly were better than by chance.
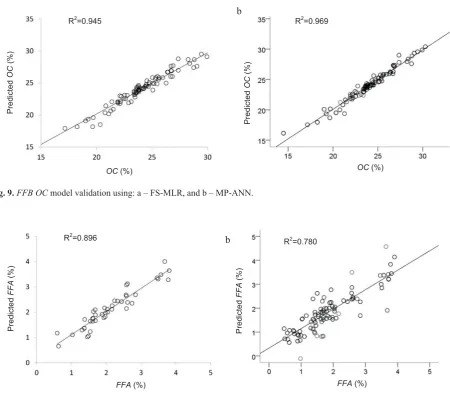
All colour features extracted from the object image were used as input variables or predictors in generating all mo-dels. For theOCandFFAmodels, the regressions were per-formed between results obtained from laboratory analysis and image features. These features, considered as predic-tors, were removed from calculation whenever they did not contribute significantly to the models. The prediction results ofFFB OCandFFAmodels are displayed in Figs 9 and 10, respectively.
The prediction accuracies of FFB features (ripeness, OCandFFA) of the models in this research provided ac-ceptable values. The best prediction accuracy (R2) of ripe-ness model is 93.5% with SEP of 0.065. ForOCandFFA as-sessments, model accurately predicts 96.41 % and 89.32%, respectively, while the SEP predictions are 0.044 and 0.068 for OC and FFA, respectively. Compared to the manual laboratory analysis, the models deliver faster results at a frac-tion of costs without damaging theFFBsamples. It should
Regression coefficients Fraction OC FFA
Object pixel -4.08 10-5 0 0
R 84289.845 10-7 0.083 -0.084
G 69454.892 10-7 0 0
B -60253.287 10-7 -9.86 10-2 0
r 0 -17.823 25.009
g 1438839.576 10-5 51.007 119.211
b -5052646.307 10-6 -518.973.10-1 -4.146
H 11710.244 10-7 12.61 10-2 0
S 0 3.955 10-2 -5.05 10-2
I -90579.498 10-7 0 6.484 10-2
RI 0 264.053 10-3 6.5 10-5
Intercept -1808338.367 10-6 7.185 -900.029 10-2
Predictor
Parameter estimates Hidden layer 1
H(1:1) H(1:2) H(1:3) H(1:4) H(1:5) H(1:6) H(1:7) H(1:8) H(1:9) H(1:10) H(1:11) H(1:12) Input
layer
(Bias) -0.405 -0.566 -0.506 -0.260 0.250 0.847 0.796 -0.528 1.218 0.661 -0.862 0.290 Object
pixel
-1.012 0.830 -0.602 -1.002 0.258 2.753 -0.279 -0.090 -0.161 -0.206 0.419 0.020
R 0.730 -0.976 1.045 -1.068 0.524 -1.879 -0.572 0.191 0.667 0.530 -0.077 0.498 G 0.864 -1.195 -0.621 0.640 0.049 -1.398 -0.141 -0.393 -0.646 -0.027 -0.374 0.130 B -0.847 1.760 -0.314 -0.570 -0.331 1.570 -0.096 0.146 -0.182 -0.003 0.415 0.303 r -0.685 -2.081 0.457 0.047 0.447 -1.090 -1.034 -0.440 0.783 0.112 0.194 -0.250 g 1.259 0.518 1.115 0.021 0.571 -1.287 -0.044 0.416 -0.089 -0.194 0.039 -0.628 b 0.509 -0.545 -1.146 0.921 -1.196 0.731 -0.192 -0.742 0.327 0.567 0.441 0.492 H -0.354 -2.212 -2.136 -0.222 0.288 1.780 1.197 0.465 0.441 0.373 -0.474 0.563 S 0.200 0.515 0.139 -0.097 -0.586 2.930 1.553 0.058 -0.123 0.178 0.466 -0.387 I 0.126 0.162 0.857 -0.144 -0.612 -0.174 0.749 0.759 -0.224 -0.553 -0.066 0.397 RI -0.163 0.849 -0.297 0.665 0.211 -1.301 -0.241 0.059 0.033 -0.237 -0.175 -0.310 T a b l e 2.MP-ANN analysis results for modellingFFBquality prediction, input layer
Predictor
Parameter estimates Output layer
F0 F1 F2 F3 F4 F5 F6 OC FFA
Hidden layer 1
(Bias) 0.582 -0.189 0.736 -0.289 0.222 -0.251 0.233 -0.520 0.323
H(1:1) 0.921 -1.488 0.282 -0.159 0.235 -0.055 0.102 -0.232 -0.263
H(1:2) 0.707 -0.929 0.415 -0.069 -0.056 0.060 -0.326 -0.035 -3.681
H(1:3) 0.703 -0.109 -1.117 0.676 -0.279 0.058 -0.200 -0.076 -2.555
H(1:4) 0.258 -0.418 0.336 -0.036 -0.485 0.105 0.291 -0.366 1.989
H(1:5) -0.797 -0.274 0.719 -0.025 0.720 0.012 -0.038 1.316 0.863
H(1:6) 0.446 -0.639 -0.040 -0.012 0.408 0.001 -0.208 0.007 -3.753
H(1:7) 0.673 0.261 -0.647 -0.374 0.043 0.143 -0.317 1.614 -2.273
H(1:8) -0.630 0.460 0.668 0.137 -0.960 0.033 0.272 -0.354 0.710
H(1:9) -0.389 -0.009 -0.159 0.366 -0.819 0.792 0.044 -0.252 0.479
H(1:10) -0.365 0.334 -0.512 0.926 0.339 -0.838 0.142 0.403 0.348
H(1:11) 0.213 -0.419 0.111 -0.203 0.276 -0.034 0.105 1.261 1.005
H(1:12) 0.419 -0.356 0.435 0.112 -0.689 0.330 -0.221 0.224 0.120
T a b l e 3.MP-ANN analysis results for modellingFFBquality prediction, output layer
Model FS-MLR Method MP-ANN Method
Calibration (R2)
SEC Validation
(R2) SEP
Calibration (R2)
SEC Validation
(R2) SEP
Ripeness 0.844 0.305 0.846 0.36 0.974 0.03 0.935 0.065
OC 0.945 0.381 0.938 0.456 0.969 0.018 0.964 0.044
FFA 0.896 0.067 0.893 0.068 0.78 0.168 0.645 0.317
Fig. 8.ROC analysis for ripeness fraction model using: a – FS-MLR, and b – MP-ANN. a
Fig. 9.FFB OCmodel validation using: a – FS-MLR, and b – MP-ANN.
a b
Fig. 10.FFB FFAmodel validation using: a – FS-MLR, and b – MP-ANN. a
R2=0.969
R2=0.896
R2=0.945
OC(%)
FFA(%)
OC(%)
Predicted
OC
(%)
Predicted
OC
(%)
Predicted
FFA
(%)
b
b R2
=0.780
FFA(%)
Predicted
FFA
(%)
be noted that the laboratory analyses were prone to error due to human factors, thus the results cannot be guaranteed 100% error free.
The novelty of this research is the machine vision in-spection system that had been further developed to be able to assess threeFFBproperties, namely ripeness fraction, oil content and free fatty acid level, using models developed by means of two statistical analysis: FS-MLR and MP-ANN methods. The system is more compact and the algorithm in the image processing program is simplified, resulting in reduction of time required for estimating theFFBsripeness, OCandFFA, as well as the whole grading time. Compared to other available models (Shariffet al., 2004; Junkwonet al., 2009; Razaliet al., 2011) and our previous work (Makky and Soni, 2013b), the developed machine gives better ac-curacy in validatingFFBsripeness,OCandFFA. Moreover, this automatic grading machine was tested using more samples ofFFBsand directly examines the whole bunch of FFB, therefore eliminating the need of taking samples of individual fruitlets. Hence, the machine provides faster, more practical and non-destructive examination results. Application of machine vision in this machine ensures the consistency of inspection results. The works also provides a new approach to non-destructive analysis for oil palmFFB while providing a system that might be useful in the agri-cultural sector or other sectors that require it.
In the tests, the placement ofFFBson the conveyor belt was not regulated, resulting in different bunch orientations. However, this showed no influence on the accuracy. The FFBswere fed by the operator onto machine, with its handle facing toward the inspection chamber. Motor and transmis-sion combination arrangement produced a constant belt speed of 110 mm s-1, with the software processing the image less than 5 s for examination of eachFFB. The machine examination capacity is more than 12 t ofFFBsper hour; which fairly satisfies mill grading capacity requirement. All FFBsamples used in the test showed no major bruise, and hence the grading process can be considered safe in hand-ling the bunch without damaging it. This work opens an op-portunity to further develop the automatic grading systems to be applied in agricultural sectors as well as in other sectors. More methods can be developed to increase the efficiency and effectiveness of this kind of system.
CONCLUSIONS
1. In this research, an automatic inspection machine for examining ripeness fraction, oil content and free fatty acid of oil palm fresh fruits bunch was developed and tested through a series of field tests. It is able to automatically examine 12 t of fresh fruit bunches per hour without causing injuries to the bunch.
2. Chemical analysis conducted in the laboratory show-ed that moderately ripe fresh fruit bunches in the fraction
range from 1 to 3 correspond to acceptable quality, as com-pared to fresh fruit bunches in higher fractions, based on their oil content and free fatty acid.
3. For the prediction of ripeness and oil content of fresh fruit bunch, the best models were created using the multi-layer-perceptron artificial neural network method, while for the free fatty acid assessment the best model was obtained by means of forward stepwise multiple linear regression. The best prediction accuracy of ripeness model is 93.5% with 0.065 standard error of prediction. For oil content and free fatty acid assessments, model accurately predicts 96.41 and 89.32%, respectively, while the standard errors of pre-diction are 0.044 and 0.068 for oil content and free fatty acid, respectively.
REFERENCES
AOCS,2004.Official methods and recommended practices of the American Oil Chemists Society. Sampling and analysis of commercial fats and oil. American Oil Chemists Society, Urbana, IL, USA.
APHA,2005. Standard Methods for the Examination of Water and Wastewater, APHA, AWWA, WEF, part 5220 B. American Public Health Association, Washington DC, USA. Arefi A., Motlagh A.M., and Teimourlou R.F., 2011.Wheat class
identification using computer vision system and artificial neural networks. Int. Agrophys., 25, 319-325.
Arenas-Ocampo M., Alamilla-Beltrán L., Vanegas-Espinoza P., Camacho-Díaz B., Campos-Mendiola R., Gutiérrez-López G., and Jiménez-Aparicio A., 2012.Fractal morphology of
Beta vulgarisL. cell suspension culture permeabilized with Triton X-100. Int. Agrophys., 26, 1-6.
Asadi V., Raoufat M., and Nassiri S., 2012.Fresh egg mass estima-tion using machine vision technique. Int. Agrophys., 26, 229-234.
Bobbio P.A., and Bobbio F.O., 2001.Chemical Food Processing (in Portuguese). Varela, Sao Paulo, Brazil.
Briseno-Tepepa B.R., Jiménez-Peréz J.L., Saavedra R., González-Ballesteros R., and Suaste E., Cruz-Orea A., 2008. Photo-pyroelectric microscopy of plant leaves. Int. J. Thermo-physics, 29(6), 2200-2205.
Gonzalez R.C. and Woods R.E., 2008.Digital Image Processing. Pearson Prentice Hall, Pearson Education, Inc. New Jersey, USA.
Gonzalez-Ballesteros R., Gonzalez M.C.O., Suaste-Gomez E., and Cruz-Orea A., 2006.Polivinilidene fluoride (PVDF) applied to photopyroelectric microscopy. Proc. 3rd Int. Conf. Electrical and Electronics Engineering, September 6-8, Veracruz, Mexico.
Hadi S., Ahmad D., and Akande F.B., 2009.Determination of the bruise indexes of oil palm fruits. J. Food Eng., 95, 322-326. Hernandez A.C., Cruz O.A., Ivanov R., Dominguez P.A., Carballo
C.A., and Moreno I., 2011.Optical properties of maize seeds. Int. Agrophys., 25, 223-227.
IOPRI,1997. Palm oil and palm oil mill waste management. Team of standardization for palm oil processing. Indonesian Oil Palm Research Institute (IOPRI) (in Indonesian). Directo-rate general of forestry, Indonesia.
Jaffar A., Jaafar R., Jamil N., Low C. Y., and Abdullah B., 2009. Photogrammetric grading of oil palm fresh fruit bunches. Int. J. Mechanical Mechatronics Eng., 9(10), 7-13. Jamil N., Mohamed A., and Abdullah S., 2009. Automated
grading of palm oil fresh fruit bunches (FFB) using neuro-fuzzy technique. Int. Conf. Soft Computing and Pattern Recognition, 245-249.
Junkwon P., Takigawa T., Okamoto H., Hasegawa H., Koike M., Sakai K., Siruntawineti J., Chaeychomsri W., Vanavichit A., Tittinuchanon P., and Bahalayodhin B., 2009. Hyper-spectral imaging for nondestructive determination of inter-nal qualities for oil palm (ElaeisguineensisJacq. var. tenera). Agric. Information Res., 18(3), 130-141.
Koenderink N.J.J.P., Broekstra J., and Top J.L., 2010.Bounded transparency for automated inspection in agriculture. Computers Electronics Agric., 72, 27-36.
Kondo N., 2010. Automation on fruit and vegetable grading system and food traceability. Trends in Food Sci. Technol., 21, 145-152.
Liu Y., Chen X., and Ouyang A., 2008.Nondestructive determi-nation of pear internal quality indices by visible and near-infrared spectrometry. LWT - Food Sci. Technol., 41, 1720-1725.
Makky M., Herodian S., and Subrata I.D.M., 2004.Design and Technical test of visual sensing system for palm oil harvesting robot. Proc. Int. Seminar on Advanced Agric. Eng. Farm Work Operation, August 25-26, Bogor, Indonesia. Makky M. and Soni P., 2013a.Towards sustainable green pro-duction: exploring automated grading for oil palm fresh fruit bunches (FFB) using machine vision and spectral analysis. Int. J. Advanced Sci. Eng. Information Technol., 3(1), 1-7. Makky M. and Soni P., 2013b.Development of an automatic grading machine for oil palm fresh fruit bunches (FFBs) based on machine vision. Computers Electronics Agric., 93, 129-139.
Makky M. and Soni P., 2014.In situ quality assessment of intact oil palm fresh fruit bunches using rapid portable non-contact and non-destructive approach. J. Food Eng., 120, 248-259. Matsushima U., Graf W., Zabler S., Manke I., Dawson M., Choinka G., Hilger A., and Herppich W., 2013.3D-analysis of plant microstructures: advantages and limitations of
synchrotron X-ray microtomography. Int. Agrophys., 27, 23-30.
Mireei S.A., Mohtasebi S.S., Massudi R., Rafiee S., and Arabanian A.S., 2010. Feasibility of near infrared spectroscopy for analysis of date fruits. Int. Agrophys., 24, 351-356. Naes T. and Mevik B.H., 2001.Understanding the collinearity
problem in regression and discriminant analysis. J. Chemometrics, 15(4), 413-426.
Nicolai B.M., Beullens K., Bobelyn E., Peirs A., Saeys W., Theron K.I., and Lammertyn J., 2007.Nondestructive measurement of fruit and vegetable quality by means of NIR spectro- scopy: A review. Postharvest Biol. Tech., 46, 99-118.
NSAI,2006.Crude Palm Oil. National Standardization Body of Indonesia (in Indonesian). SNI 01-2901-2006. Stipulation No. 107/KEP/BSN/05/2006, Indonesia.
Osawa C.C., Goncalves L.A.G., and Ragazzi S., 2007. Correla-tion between free fatty acids of vegetable oils evaluated by rapid tests and by the official method. J. Food Composition Analysis, 20, 523-528.
Razali M.H., Ismail W.I.W., Ramli A.R., Sulaiman N., and Harun M.H.B., 2011.Technique on simulation for real time oil palm fruits maturity prediction. African J. Agric. Res., 6(7), 1823-1830.
Roseleena J., Nursuriati J., Ahmed J., and Low C.Y., 2011. Assessment of palm oil fresh fruit bunches using photo-grammetric grading system. Int. Food Res. J., 18(3), 999-1005. Saad B., Ling C.W., Jab M.S., Lim B.P., Ali A.S.M., and Wai
W.T., 2006.Determination of free fatty acids in palm oil samples using non-aqueous flow injection titrimetric method. Food Chemistry, 102, 1407-1414.
Shaarani S.M.D., Cardenas-Blanco A., Amin M.H.G., Soon N.G., and Hall L.D., 2010.Monitoring Development and Ripeness of Oil Palm Fruit (Elaeis guneensis) by MRI and Bulk NMR. Int. J. Agric. Biol., 12(1), 101-105.
Shariff R., Nor A., Adnan R.M., Shattri M., Rohaya H., and Roop G., 2004. Correlation between oil content and dn values. University Putra Malaysia, GISdevelopment.net Siregar I.M., 1976.Assessment of ripeness and crop control in oil
palm. Proc. Malaysian Int. Agric. Oil Palm Conf., June14-17, Kuala Lumpur, Malaysia.
Zapotoczny P., 2012.Application of image texture analysis for varietal classification of barley. Int. Agrophys., 26, 81-90. Zdunek A., Adamiak A., Pieczywek P.M., and Kurenda A., 2014.