TECHNICAL NOTE
USING 2D LERCHS AND GROSSMANN ALGORITHM
TO DESIGN FINAL PIT LIMITS
OF SUNGUN COPPER DEPOSIT OF IRAN
M. Osanloo and M. Ataei
Dept. of Mining and Metallurgy, Amirkabir Univ. of Tech. Tehran, Iran, [email protected]
(Recived: December 4, 1998 - Accepted in Final Form: May 22, 2000)
The Sungun copper deposit is located in about 40km north west of Ahar city in the Abstract
east Azarbaigan province of Iran. The total geological ore deposit is estimated to be 740 million tons. In this study using all information from exploration and geotechnical studies of the area, fin al p it lim it s of Su n gu n co pp er d ep osit is de sign ed b y th e 2-D Le rchs & G ro ssma nn Algorithm. By this method, from 740 million tons of geological ore reserve, 411 million tons can be mined by open-pit method with overall stripping ratio of 2.14:1. Cut off grade is found to be 0.32% Cu. The average ore grade is found to be 0.665% Cu.
Open Pit, Final Pit Limits, Lerchs-Grossmann Algorithm, Economic Value Key Words
/jnAj nAo » o{ ¬B\½BMnlC ¬BTwA pA oµA ¬BTwo´{ »Mo ¤Bª{ ºoT«±¦¼ 4å nj ¬±¢¯±w u« nBv¯B @
²k¼ña
° » BzT @A RBîÀ A tBwA oM ³í§B « ½A nj /SwA ²k{ jn°CoM U ¬±¼¦¼« 74å nBv¯B ½A »wB®{ ¼«p ²o¼il ¥ @ »ÇeAoÇ ªw°o£ ° ^o§ ºkíM°j x°n ³M oµA ¬±¢¯±w u« nBv¯B »½B´¯ ²j°kd« ,³ ®« »ñ¼®ñU±Är RBí§B « An »¯kí« ²jB« U ¬±¼¦¼« 411 nBv¯B ½A »wB®{ ¼«p ²o¼il U ¬±¼¦¼« 74å pA x°n ½A pA ²jB TwA BM /SwA ²k{ kænj å.32 nBv¯B ke nB¼î /j±ª¯ ZAohTwA 2.14:1 ºnAjoM³¦ BM SLv¯ BM pBM°n ºnBñ¯kí« x°n w±U ¬A±U»« /SwA ²k{ ¼¼íU u« kænj å.665 »¯kí« ²jB« w±T« nB¼î ° u«
INTRODUCTION
O ne of the most important stages of open-pit mine design is to determine the final pit limits. After finding the final pit limits of mine, it is possible to determine the size and locat ion of processing plant, the location of waste dumps, etc. In the past, the final pit limits of mine were mainly de signe d by hand me t hods. All hand me thods of final pit limits begin wit h ve rtical sections [1].
These sect ions should include the mine ral block inventory and surface topography. The pit limit s are locate d on each section so the ore gr a de a lo n g t h e p it limit s lin e su p p o r t a
stripping ratio corresponding to the break even stripping ratio [2]. Hand method is less accurate and consumes more time, particularly in large ore deposit [3].
D ue to the tediousness of the procedure, a n u m b e r o f a lt e r n a t ive m e t h o ds ma in ly, compute r te chnique s, have bee n developed. One of this alternative methods is 2-D Lerchs & Grossmann Algorithm [4,5].
Figure 1.General location of Sungun copper mine of Iran.
between 38Ü40Åto 38Ü43Å(Figure 1).
EXPLORATION HISTORY
E xploration study at Sungun coppe r de posit st art ed in 1911 and continue d up to 1941. At the end of t his pe riod t he e xploration group cla ime d t ha t Sun gun h a s la r ge de po sit o f porphyry copper. In 1978 again exploration studies started in Sungun by exploration group of the Sarcheshmeh copper mines of Iran. But a few months later the exploration activity of this group was stopped. In 1989 several exploration expe rt s from geological organization of Iran began to complete previous studies. The results of this ne w e xplor atio n pr ogra m we re : ( 1) prepareing general map of Sungun in scale of 1: 20000, (2) prepareing geological maps in scale of 1: 5000 and 1:10000, ( 3) e xcavat ing more than 120 exploration boreholes, some of which
were in grid of 200Î200 m and some in grid of
100Î100m, (4) recovering of samples from each
bo re h ole wit h in te r val of 2m for che mical an alysis a nd ( 5) pe r fo rmin g 5 e xp lo ra t ion
tunnels with dimensions of 2Î2m [6].
MINERALIZATION ZONES
Sungun porphyry coppe r de posit , like many other porphyry deposits around the world, has three different zones. These are:
(1) The leached zone, the average thickness of which is 80m and copper grade is less than 0.1 perce ntage . The mate rial of leache d zone is considered to be waste.
(2) The supergene zone, the average thickness of which is 100m and cont ain high grade of copper. The copper grade is ranged between 0.8 to 2 percentage. Most minerals of this zone are
chalcopyrit e CuFe S), chalcocite ( Cu2S) and
covellite (CuS).
(3) The hypogene zone, the average thickness of which is 340m wit h coppe r grade range d between 0.01 to 2 percentage. Most minerals of this zone are chalcopyrite and pyrite with very low percentage of molybdenum.
SLOPE STABILITY
Considering physical and mechanical properties of rock mass, ground wat er re gime and mine area tectonic, the limits of Sungun copper mine are divided into 5 diffe rent port ions. These port ions are nort h east of mine, nort h we st , central and east, central and west, and south of mine. Table 1 shows the recommended pit slope fo r 5 p o r t io n s o f min e [7]. T h e p r im a r y ge ot echnical analysis of mine addresse d that circular and toppling failure will not happen, but plane and wedge failure may happen in high pit slope.
CALCULATION PROCEDURE
B a s e d o n
Number of block Calculation
Figure 2.Location of boreholes and exploration tunnels.
TABLE 1. Recommended Pit Slope for Different Portions of Sungun Mine [7].
recommended slope Portion
37.5Ü
northeast
37.5Ü
northwest
41.2Ü
central and east
41.2Ü
central and west
36.5Ü
south
exploration tunnels, from 647710 up to 649350 o n X -a xis a n d fr o m 4284275 u p t o p o in t 4285675 along y-axis and from level 1600 up to
2370m along Z -axis, have be en sele ct ed as a large block (1640 x 1400 x 770m).
Based upon the ge ot echnical study of the Sungun copper deposit , the final pit slope of
mine is suggest e d t o be 35Üand the ave rage
specific gravity is evaluated to be 2.5 [7]. With regard to loading system and drilling machine, be nch he ight is se le ct e d as 14m. The re fore block width is calcu la t e d by t he follo wing equation:
(1) B = _____hB
where B = block width, hB= bench he ight =
block height = 14m and a = slope angle.
Substitut ing the amount of hBand tan ain
formula 1 the block width will be 20m.
The distance between all geological sections was 50m, hence the third dimension of block is selected to be 50m. Therefore, the dimension of
e ach small block will be 14 Î 20 Î 50m and
weight of material per block is 35000 tons. Knowing t he size of large block and small blocks, the number of small blocks was found from:
(2) N = ________________ = 1262801640
*
1400*
77014
*
20*
50where N = number of small blocks.
U sing D ATA MINE program and inve rse distance weighting technique, the grade of each block is calculated. In the next step, by entering topographic conditions of each section, those group of blocks having more than 50% of their portion above topography level are omitted. By doing so, the total number of small blocks were reduced t o 76114 blocks. Table 2 shows the grade and blocks numbers of ore and waste of each section of Sungun copper deposit.
Estimating Economic Value of Each Block
To calculate the economic value of each block, the following equation is used:
(3) BEV
@
=@
TPB[
@
(
R.g___)
AMR@-@
(b+
c)@
]
G
where BE V = block e conomic value, TP B = to n pe r block ( 35000t on s), R = R e co ve ry coe fficient (90% ), g = average ore grade of each block, G = grade of concentrate (30% ), AMR = price of one ton concentrate at mine ($ 405.5 per ton), b = mining cost ($ per ton), c = concentrating cost ($ 2.9 per ton).
Substituting the above values in E quation 3 the block economic value is:
(4) BEV = 35000
[
@
(
____0.9g)
405.5-
(1+
2.9)]
30
(5)
where BEV = 35000 (12.165g
-
3.9)Since the blocks have all identical weight, the BEV is divided by 35000, therefore relation 5 is written as:
(6)
BEV= 12.165g
-
3.9To det ermine t he cut off grade, BE V must be equal to zero, so:
(7) gc= ______ = 0.323.9
12.165
where gc= cut off grade.
From 76114 blocks, only 21152 blocks have average grade of more than 0.32%, and thus the total ore reserve is 740,320,000 tons. At this
stage block economic value (mij) of each section
is calculated by E quation 6, whe re i re fers to the rows and j to the columns.
To calculat e mijtwo options we re unde r
consideration.
1 - Those blocks having grade less than 0.32% are considered as a waste and their values are minus one dollar.
2 - Those blocks having grade gre ate r t han 0.32% are considered as ore and their economic values are calculated.
F o r e xample in se ct io n 11 in r ow o ne a nd
column one and row 20 and column 12 the mij
h a ve b e e n ca lcu la t e d b y t h e fo llo win g procedure.
g11 = 0.003
Since g11 = 0.003<0.32 therefore m11 = -1
For g20 12 = 0.508>0.32, using Equation 6, the
block economic value of m20 12 is 2.28 dollar.
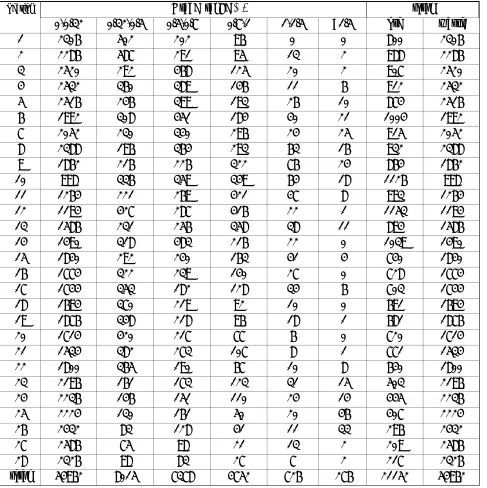
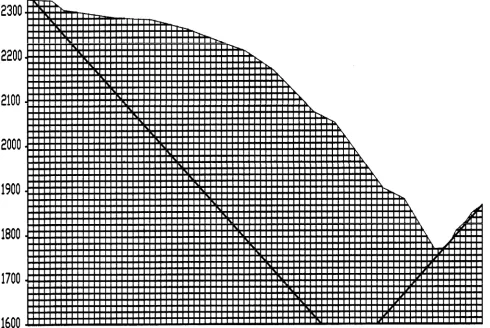
This process is continued for blocks of each section. It should be noted here that, section 11 of Sungun copper deposit produces more profit than any other section (Figure 3).
T h e n e xt st e p wa s t o ca lc u la t e t h e cumulative value for e ach column of blocks
(Mij). At this stage, row 0=0 was added to top
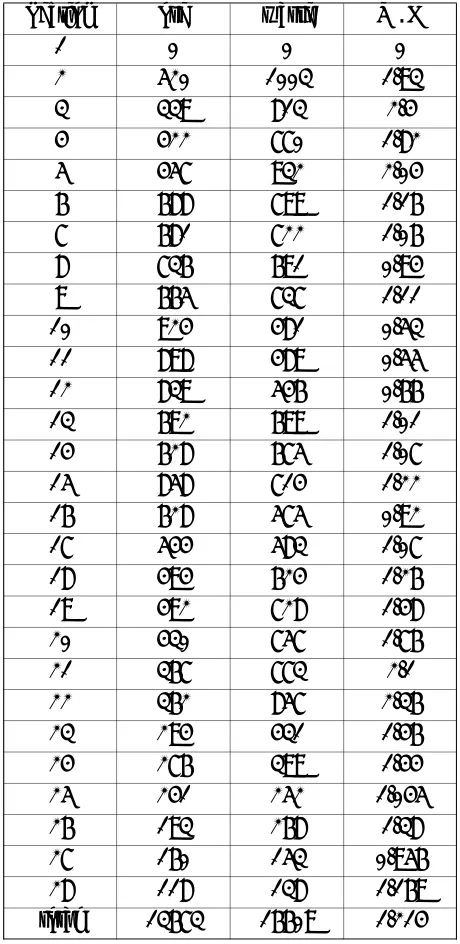
TABLE 2. Number of Blocks of Different Grade Range. total Grade range(%) Section waste ore >1.5 1-1.5 0.7-1 0.5-0.7 0.32-0.5 0-0.32 2306 800 0 0 96 202 502 2306 1 2286 988 2 13 95 291 587 2286 2 2520 907 2 20 125 468 292 2520 3 2532 912 6 11 146 389 360 2532 4 2516 874 10 26 193 399 246 2516 5 1992 1004 21 40 184 451 308 1992 6 2052 915 25 24 296 340 230 2052 7 2388 932 16 63 293 364 196 2388 8 1862 864 24 76 322 226 216 1862 9 998 1126 18 64 349 359 336 998 10 1264 993 8 47 421 269 221 1264 11 1194 1153 1 22 416 287 427 1194 12 1586 894 11 38 358 256 231 1586 13 1490 1039 0 22 216 483 318 1490 14 1840 740 4 41 163 240 292 1840 15 1774 728 0 27 140 239 322 1774 16 1744 703 6 34 128 182 353 1744 17 1694 691 0 10 92 219 370 1694 18 1876 681 1 18 96 218 348 1876 19 1714 720 0 6 77 217 420 1714 20 1534 771 1 8 107 273 382 1534 21 1800 640 8 10 67 190 365 1800 22 2196 503 15 31 123 173 161 2196 23 2236 445 14 24 110 151 146 2236 24 2224 407 46 20 50 161 130 2224 25 2432 296 33 11 41 128 83 2432 26 2586 209 2 13 21 98 75 2586 27 2326 217 2 7 27 83 98 2326 28 54962 21152 276 726 4752 7378 8015 54962 total
j=0) in Table Mij. To calculate cumulative value
for each column of blocks, beginning from the t o p a n d mo vin g do wnwa r d, t h e fo llo win g equation is used.
i
(8)
Mij =
õ
mkj j = 1, 2, 3, ...k=0
where Mijis the value calculated in extracting a
single column and mkj is the net value of block
(kj). Applying E quation 8 to find the value of
M31 of section 11, we will have:
3
(9) M31=
õ
mk1 = m01+
m11+
m21+
m31k=0
where from Table Mijof section 11 :
m11 = m21 = m31 = -1 and m01= 0. Therefore
M31= -3.
Figure 3.Final pit limits of section 11 of Sungun copper deposit of Iran.
cu m u la t ive va lu e o f e a ch se ct io n . T h is proce dure start e d from the extre me top left hand of the block to right across the section. To calcula t e t he value of e ach block ( Pij), t he following equation is used.
Þ
£
Pi-1, j-1
¼
¼
(10)
¼
¼
Pi,j-1 Pij= Mij+
max¼
¼
¼
¼
Pi+1, j-1ø
¥
whe re Pij = cumulative value of each block,
Pi-1, j-1 is the value of block directly above and to the left, Pi, j-1is the value of block on the left and Pi
+1, j-1 is the value of block directly below and to the left.
Of the three values, the block whose value is
adde d t o t h e block Mij and yie ld t h e mo st
posit ive sum is sele ct ed. An arrow is drown
fr om t he or iginal blo ck ( Pij) t o t hat blo ck pr oviding t he maximum va lu e . The sum is su bst itu te d int o t he o rigin al block for t he subsequent calculation.
This pr oce dure is co ntin ue d in th e first
column of Table Pij, then column 2 from top to
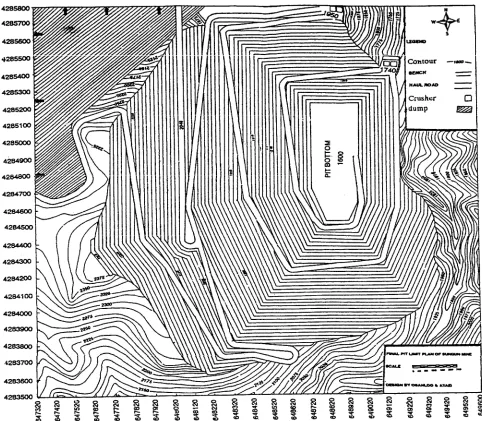
Figure 4.Final pit plan of Sungun copper mine.
Sungun coppe r mine and Table 3 shows the number of blocks of ore and waste and overall stripping ratio of each section.
MINE ACCESS
Roads are one of the most important aspects of final pit slope de signing in ope n-pit mine s. Their presence should be included early in the p la nn ing pr o ce ss sin ce t he r oa d ca n h ave significantly affect on the slope angle and the slope angles chosen have a significant affect on the reserve [4,9]. Their later design can cause a
la r ge a mo u n t o f u n p la n n e d wa st e o r t h e sterilization of some planned reserve [10,11]. O n t h e o t h e r ha nd, most o f t he cu rr e n t ly available computerized pit generating methods do not e asily accommodat e t he inclusion of roads [12]. In this study the addition of a road in plan was under consideration. Based upon the height of the bench and considering road grade to be 8 percent, the length of the road in plan is calculated by the following equation:
(11) L = _________(Nb
*
hB@
)TABLE 3. Blocks Number of Ore and Waste and Overall Stripping Ratio of Each Section.
W
.
Owaste ore Section 0 0 0 1 1.93 1003 520 2 2.4 813 339 3 1.82 770 422 4 2.04 932 457 5 1.16 799 688 6 1.06 722 681 7 0.94 691 736 8 1.11 737 665 9 0.53 481 924 10 0.55 489 898 11 0.66 546 839 12 1.01 699 692 13 1.07 675 628 14 1.22 714 858 15 0.92 575 628 16 1.07 583 544 17 1.26 624 494 18 1.48 728 492 19 1.76 757 430 20 2.1 773 367 21 2.36 857 362 22 1.46 431 294 23 1.44 399 276 24 1.045 252 241 25 1.38 268 193 26 0.956 153 160 27 1.169 138 118 28 1.214 16609 13673 total
And the actual length of the road was found from:
(12) La =
¡
````````
L2+
(PD)2To calcula t e t h e vo lume of t h e mat e rial contained in the road (must be removed), the following equation is used:
(13)
V = __1
*
___________*
Wt2
100
*
(PD )2Rg
TABLE 4. L , La and V in Sungun Copper Mine.
V(m3)
La(m) L(m) Mine Roads 3675000 1755.6 1750 level 1600 to level
1740
8268750 3371.5
3365 level 1740 to level
1950
22968750 4389
4375 level 1950 to level
2300
184800 2549
2245 level 1950 to level
2048
35097300 12065
12035 total
where L = the length of the road in plan, Nb=
Number of benches, hB = bench height = 14m,
Rg = road grade = 8%, La = actual length of
the road, PD = Pit depth, Wt = actual width of
the road = 30m and V = Volume of mat erial contained in the road or must be removed.
In Sungun copper mine, the pit bottom will be at the leve l of 1600 m, base d upon the pit bottom, two semi-portable crushers are going to be used. In early years of production, crushers will be inst alle d at t he level of 1950m and in later years of production, the two crushers are going t o move at the level 1740m. Two major dump locations are selected to be at the level of 2300m and in le vel of 2048m. With regard to geometry of two dump points and locations of crushe rs the actual le ngth of the roads ( La), length of the roads in plan and t he volume of material contained in the roads (V) were found by Equations 11, 12, 13 and shown in Table 4.
MINE YEARLY PRODUCTION The main objective of Sungun porphyry copper m in e p la n i s t o p r o d u ce 28 0,000 t o n s concentrate with grade of 30% and re cove ry coe fficie nt of 90% , yearly ore production of Sungun coppe r mine is 14 million t ons. F or mining 14 million tons ore per year 30 million tons waste must be removed.
RESULT
geotechnical studies of Sungun copper deposit a n d u sin g D A T A M I N E p r o gr a m , t h e geological proven reserve of Sungun deposit is found t o be 740,320,000 tons. U sing the 2-D Lerchs & G rossmann Algorithm, t he final pit limits are de termine d. Base d on this me thod from more than 740 million tons of geological ore reserve, 411 million tons will be mined by open-pit method. For mining 411 million tons ore, 879.5 million tons waste must be removed. O ve rall stripping ratio is 2.14: 1, and cut off grade is found 0.32% Cu.
CONCLUSION
1. U sing the 2-D Lerchs & G rossmann to find final pit limits of Sungun copper deposit, it is shown that 411 million tons ore will be mined inst ead of 341.39 million tons ore by hand method [6].
2. U sing t he 2-D L e rch s & G rossmann, 70 million tons more ore will be mined [8]. 3. In comparison to the hand method, the 2-D
Lerchs & Grossmann is less time consuming. 4. The Sungun copper deposit re quire more e xplorat ion st udie s in orde r t o de fine all categorie s of ge ological ore rese rve. This re qu ire s t o de t e r mine ne w e cono mic pit limits, the 2-D Lerchs & Grossmann method is fast er and a very helpful method to find the new pit limits at shorter time with higher
fullness.
REFERENCES
1. Crawford, J. T. and Hustrulid, W. A., "Open Pit Mine Planning & Design", New York, SME, 1979.
2. W r igh t , E . A., "O p e n P it M in e D e sign M o d e l", Clausthal-Zeller Fels,Trans. Tech. Publications, (1990). 3. Ke n n e d y, B. A., "Su r fa ce M in in g", 2n d E d it io n ,
Meryland, SME, 1990.
4. H u st r u lid , W . a n d Ku ch t a , M ., "O p e n P it M in e Planning and Design", Rotterdam, Balkema, 1995. 5. Lerchs, H. and Grossmann, I. F., "Optimum Design of
O pen-Pit Mines",Transactions Canadian Institute of Mining and Metallurgy, Vol. 6, (1965), 17-24.
6. I ra n I to k E n gine er ing & T echn o lo gica l Co mp an y (IIETC), "Feasibility Study of Sungun Copper Deposit of Iran", 1996.
7. Technical Exploration Company of Iran (TECI), "Slope Stability Analysis of Sungu n Copper Deposit of Iran", (1995).
8. Osanloo, M. and Ataei, M., "Design of Final Pit Limits of Su ngu n Copper Mine of Iran",the 7th Symposium on Mine Planning and Equipment Selection, Calgary, Canada, (1998), 70-74.
9. Zhng, S., "Multimetal Recoverable Reserve Estimation an d Its I mpa ct o n the Cove U ltimat e Pit D esign ", Mining Engineering, SME, Vol. 50, (July 1998), 73-79. 10. J o u r n e l, A. G . "T h e I n d ica t o r App r o a ch t o t h e
Estimation of Spatial Distribution", Proceeding of 17th APCOM Symposium, Golden, Co., (1982), 793-806 11. Verly, G . W. and Sullivan, J. A., "Mu ltigau ssian and

![TABLE 1. Recommended Pit Slope for Different Portionsof Sungun Mine [7].](https://thumb-us.123doks.com/thumbv2/123dok_us/245762.2019281/3.595.37.521.43.470/table-recommended-pit-slope-different-portionsof-sungun.webp)