Sequence Stratigraphy, Variable Sedimentations, Sea Level
Fluctuations and Net Effect on Reservoir Qualities: A Study of
Cores from Two Wells GX1 and GX2 in the Niger Delta Basin
*Otosigbo Gloria Ogochukwu
1, Nzekwe Kenneth Emeka
2, Onwe Ikechukwu Moses
31,3Department of Geology, Federal University, Ndufu-Alike, Ikwo, Ebonyi State, Nigeria 2Delta Terratek Laboratories, Lagos, Nigeria
GX1 and GX2 wells are located at the Western and South Eastern Miocene Niger Delta Basin respectively. Cored depth for GX1 was 113.5m while that of GX2 was 23.6m. GX1 well is situated within the coastal Swamp of the Niger Delta. It is made up of mostly tidal sands with multiple cycles of fining upwards sequences. These high frequency packages are as a result of local transgressions and regressions. Each parasequence represents regressive set in a prograding sea. High sedimentation and reduced accommodation following lowered sea level resulted in thick layers of sandstone. Reverse is also true. Tidal form structures predominated wave structures. GX2 well located in Shallow Offshore comprised fine sands, silts and shale alternations. Sedimentary wave and tide structures were observed. It is a progradational sequence that commenced with thick shale followed by thin alternations of shale and silt/sand. The fluctuations in sea level in GX2 well are more frequent than in GX1. This is quite significant with thick volumes of sandstones in GX1 cores and thin beds of shale, silts/sands in GX2 cores. Sandstone pinchout was seen in basal shale. The Stratigraphic modelling of both wells places GX2 well above the sequence boundary observed at the top of GX1.The pattern of sea level fluctuations and sedimentation in both tidal environment and shoreface resulted to sharp variations in measured core porosity and permeability. GX1 has average core porosity of 23% and average permeability of 7,000mD, and while GX2 has average core porosity of 29.3% and average permeability 1007mD.
Key words: Regressive, parasequences, prograding, high stand, sedimentation, fluctuations
INTRODUCTION
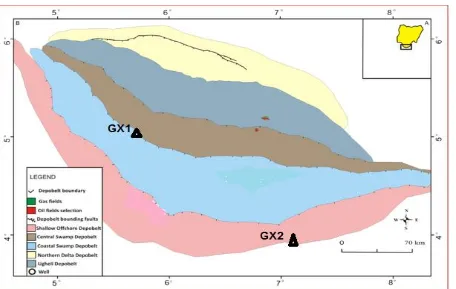
Niger Delta basin sedimentation has commenced in early Tertiary when clastic river input increased (Doust and Omatsola, 1989). The delta has since prograded over the subsiding continental-oceanic lithospheric transition zone extends into the oceanic plate of Gulf of Guinea (Adesida, 1997). Five depositional belts have been described in Miocene Niger Delta (Figure1). They are Northern Delta Depobelt, Coastal Swamp Depobelt, Central swamp depobelt, Ughelli depobelt and Shallow Offshore depobelt (Ezeh et al. 2016). Depobelt is defined as representative of successive phase of delta growth. Niger Delta comprises many sub-environments that have been identified by many researchers. Oyayan (2013) identified five sub-environments using of core samples, such as; Lower shoreface, middle shoreface, distributary channel, tidal channel and tidal flats. Obaje (2006) interpreted Post Oligocene Niger Delta as wave dominated with well
developed shoreface sands, beach ridge, tidal channels, mangrove and swamps. The basic Formations are marine Akata Shales through sand shale paralic interval of Agbada Formation to continental sands of Benin Formation. The delta experiences transgressions and regressions depending on the sea level condition, local subsidence, and sediments supply. The overall sequence of Niger Delta is a regressive sequence as a result of sea progradation. From the Coastal swamp depobelt to Offshore depobelts there are variable sedimentations and sea level fluctuations. This is evidenced in the cores studied from well in both depobelts
*Corresponding Author: Otosigbo Gloria Ogochukwu; Department of Geology, Federal University, Ndufu-Alike, Ikwo, Ebonyi State, Nigeria. Email: [email protected], Tel: +234-1-08037137658
Case Study
Vol. 5(2), pp. 258-268, May, 2019. © www.premierpublishers.org. ISSN: 3019-8261
International Journal of Geology and Mining
GX1 well is situated within the coastal Swamp of the Niger Delta depobelt (Figure 1) and is made up of mostly tidal sands. The lithology ranges from pebbly to fine sandstones, occasional shales, thin band of coal, and carbonaceous shale. It has multiple cycles of fining upwards sequences. GX2 well is located in Offshore depobelt and it comprises of shale beds, alternation of sandy shale/sand, heterolithics units (sand/shale/silts),
and fine sands. It has a coarsening upward cycle. Sedimentary structures that were observed are flaser beddings, lenticular beddings, laminations and sometimes bioturbations (Akagbeobi et al., 2018). This study intends to compare the style of sedimentation sea level variation and overall sedimentary deposits in both wells and the resultant effect on measured core porosity and permeability.
Fig 1: Location of GX1 and GX2 well within the Niger Delta Depobelts.
Geology and Stratigraphy
The Niger Delta is situated on the continental margins of the Gulf of Guinea and extends throughout the Niger Delta Province as defined by Klett et. al. (1997). It located in equatorial West Africa, between latitude 30 and 50N and longitude 50 and 80 E. It is bounded to the west by the Calabar flank, which is a subsurface continuation of Oban Massif, and bounded in the north by several older Cretaceous tectonic elements such as the Anambra basin, Abakaliki uplift and Afikpo syncline (Ejedawe, 1981).
Sedimentation in the Niger Delta started in the Paleocene/Eocene beyond the trough, at the basement horst at the northern flank of the present delta area (Weber and Daukoru, 1975). The Niger delta has prograded into the Gulf of Guinea at a steadily increasing rate in response to the evolving drainage area, basement subsidence, and eustatic sea level changes. The delta has advanced seaward over 200km and has broadened from a width of less than 300km to a width of about 500km (Whiteman, 1982) (fig 2).At the initial stage, the delta prograded over extensionally thinned and collapsed continental crust of the West Africa margin as far as the triple junction, filling
the basement graben-and-horst topography (Murat, 1972). According to Weber and Daukoru (1975), the progressive outbuilding of the Niger Delta as revealed by the landward position of present coastline relative to the Pliocene coastline is due to the post glacial rise in sea level. This resulted in the extension of continental Benin Formation offshore as far as the shelf break. From Eocene to the present, the delta has prograded southwest forming depobelts that represent the most active portion of the delta at each stage of its development (Doust and Omatsola, 1990). These depobelts form one of the largest regressive deltas in the world with an area of some 300,000 km2 (Kulke, 1995), a sediment volume of 500,000km3 (Hospers, 1965), and a sediment thickness of over 10km in the basin depocenter (Kaplan et. al., 1994) The early delta –building was river dominated, while the post Eocene delta environment is typical of a wave-dominated delta with well-developed beach ridges, bars, tidal channels, mangrove, and freshwater swamps (Stacher, 1995).
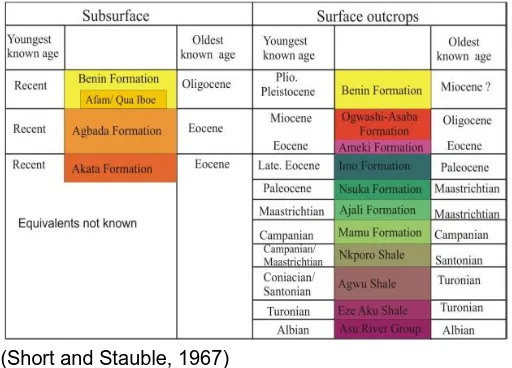
Formation is a delta top lithofacies consisting of massive continental sands and gravel. This graded downwards into, or overlies unconformably the delta front lithofacies, the Agbada Formation, which comprises mostly shoreface and channel sands with minor shales in the upper part, and an alternation of sands and shale in equal proportion in the
lower section (Reijers et al, 1996). Pro- delta marine shales belonging to the Akata formation occur deeper in the section, where associated sandstone units are generally lowstand turbidite fans deposited in deep marine setting.
Fig 2: Stratigraphic Cross Section A’A showing Formations and depobelt.(Ezeh et al 2016) Table 1: Stratigraphy of Niger Delta, Nigeria (Modified
after Akpoyovbike, 1978). The original modified after
(Short and Stauble, 1967)
The aim of this study is to show variable sub-environments in the Niger Delta through facies and facies association delineation, differential sedimentations by sea level fluctuations, sequential layering and the variable effects on the reservoir properties of the studied wells.
The Niger Delta is situated on the continental margins of the Gulf of Guinea. (Klett et. al., 1997). It located in equatorial West Africa, between latitude 50 and 8.50N and longitude 40 and 60 E. GX1 well is located within the coastal swamp depobelt along latitude 5o 54'N and longitude 5o 12‘. GX2 well is located within the shallow offshore along latitude 7o 08' N and between longitude 4o 02‘.
METHODS OF STUDY
The study carried out on cores from GX1 and GX2 wells include detailed sedimentological core descriptions carried out on the cores. GX1 was cored in 3 discontinuities as, A:
3405.6 - 3445.5 , B: 3330 – 3363.3 and C: 3232 – 3264.7 while the cored depth of GX2 ranged from 2416.7- 2440.3. The similar lithological characteristics were grouped into facies, facies associations and depositional environment. The facies log was built by Sedlog 2.1.4 software. The sequence stratigraphy of the established for the two wells. The cores were plugged at selected intervals in the both wells. A total of 81 plugs from GX1 and 20 plugs from GX2. The diameter of plugs are
1
12 inches, while the length is
at least times
1
12 of diameter. The plugs were sent to dean
stark for removal of oil with toluene and later with chloroform for at least 3 days. The cleaned plugs were dried to stable weights using conventional oven and weight recorded. Grain density was determined by using the dry weight previously obtained and measuring grain volume at constant temperature in a helium expansion porosimeter using Boyle’s law. Grain density was calculated:
⍴
𝑮= 𝑾
𝑮⁄
𝑽
𝑮Where,
⍴
𝑮 is grain density in gm/cm3, 𝑾
𝑮 is corrected dry weight in gm and𝑽
𝑮 is corrected grain volume incm3. Porosity was determined by utilizing the grain volume already obtained, then measuring pore volume with expanding helium in a hydrostatic test cell at net overburden stress also using Boyle’s law. All the samples were tested at ambient of 400psi. Porosity,
ᶲ
values were calculated as follows:ᶲ = 𝑉
𝑝⁄
(𝑉
𝑝+ 𝑉
𝐺)
∗ 100%
The value of porosity is expressed in percentage,
𝑉
𝑝 is corrected pore volume in cm3, 𝑉
using three pressure transducers calibrated to measure high, medium and low permeability. The transducer for low permeability was in 50psi, while high and medium was in inches of water. The apparatus used was dependent upon the pressure drop measured across the sample. Exit pressure was measured at the pressure transducers. Flow rate was measured directly by flowing soap film through a graduated burette. The principal is based on Darcy’s equation for laminar flow. The flow region has to be laminar i.e. less than 1cc per second. The time required for a soap film to flow through a given volume of 30cc was measured with a stop watch. The average of three measured consecutive flow rates was used to calculate the final reported permeability value. Permeability equation is given as:
𝐾
𝑎=
𝑄
𝑏𝜇𝑃
𝑏(𝐿 𝐴
⁄ )
(𝑃
𝑖+ 𝑃
𝑏)
2− (𝑃
𝑒+ 𝑃
𝑏)
2𝐾
𝑎is apparent permeability in millidarcys,𝑄
𝑏 is flow ratein cm3/s
, 𝜇
is viscosity of nitrogen in centipoises (0.176 cp was used),𝑃
𝑏 is the barometric pressure inatmospheres,
𝐿
is the length in cm3, 𝐴
is sample cross-sectional area in cm2 ,𝑃
𝑖 is inlet pressure converted from
the units read to units of atmospheres,
𝑃
𝑒 is the outletpressure converted from the units read to units of atmosphere.
RESULTS AND INTERPRETATION Facies Association-GX1
The description of GX1 well revealed the lithological characteristics as; fine to coarse pebbly sands, mixed sand, silts and shale (heterolithics), coal, etc. The sedimentary structures observed are planar cross bedding, herringbone cross bedding, wave ripple laminations, laminations, lenticular beddings, flaser beddings, way bedding, convoluted beddings, massive bedded, reactivation surface and scoured erosional surfaces. Other features associated with lithologies are basal lag deposits, load casts and siderite clasts. Bioturbations are Skolithos, Diplocraterion, and Thalossionoides trace fossils belonging to Skolithos ichnofacies assemblages.
Sedimentary Facies is defined as the sum of the characteristics of a sedimentary rock unit. Related facies close to each other that depicts a particular sedimentary environment are grouped into facies associations. Five facies associations were defined from GX1 from bottom to top as follows: Lower intertidal flats(Fine Sandstone Facies- FSF), Middle tidal flat deposits(Bioturbated Heterolithic Facies-BHF and Shale Facies-SF), subtidal
deposits(Planar Cross-bedded Sandstone-PCS and Herringbone Cross-bedded Sandstone-HCS), swamp deposits(Coal Facies-CF), Lower intertidal flat deposits(Cross Bedded Sandstone-CBS and Shale Facies-SF), Tidal channel deposits(Pebbly Sandstone-PS, Planar Cross bedded Sandstone-PCS and Laminated Heterolithics-LH) and middle tidal flats(Bioturbated Heterolithics-BH and Shale Facies-SF )(see Figure 6). Two facies association were repeated along the sequence. The summary of the lithological characteristics, facies, facies associations and interpretation are shown in table 2 below.
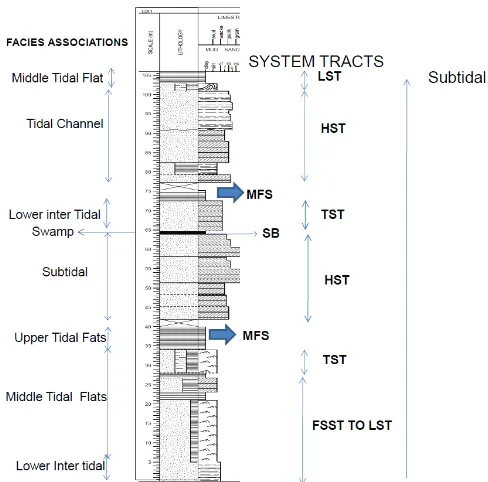
Figure 3: Lithofacies Log of GX1 showing Facies Association and System Tracts, MFS and uncored interval.
Figure 5: Cross Bedded Sandstone Facies from GX 1 showing, planar cross bedding, wave ripplecross bedding and Diplocraterion trace fossils.
Facies Association GX2
The description of GX2 well revealed the lithological characteristics as; consists mostly fine sands, mixed sand, silts, and shale. The sedimentary structures are parallel laminations, flaser bedding, lenticular bedding, wavy bedding, cross laminations, convolute bedding and ripple laminations. Other depositional structures are load casts, minor faults, synsedimentary micro faults. Bioturbations is mostly skolithos.
Five sedimentary facies were delineated from GX2 well in accordance with their lithological characteristics from bottom to top. They are Shale Facies-SF, Rippled
Heterolithics-RH, Ripple Laminated Sandstone-RLS, Cross Laminated Heterolithics-CLH, Parallel Laminated Sandstone-PLS and Symmetrical Rippled Heterolithics-SRH. These were grouped into four Facies association: Offshore, Offshore Transition, Shoreface and Foreshore deposits (see Figure 6). The summary of the facies, facies association and Interpretation are shown in Table 3.
Figure 6: Lithofacies Log of GX2 showing the Facies Association, System Tract. Yellow Triangle represent the position of the Sand wedge-Incised fill.
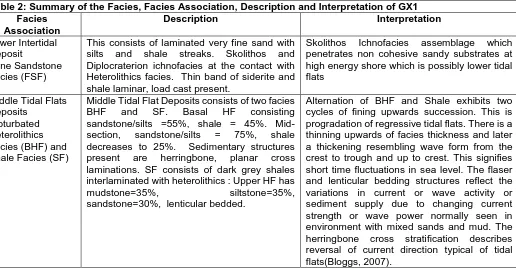
Table 2: Summary of the Facies, Facies Association, Description and Interpretation of GX1 Facies
Association
Description Interpretation
Lower Intertidal Deposit
-Fine Sandstone Facies (FSF)
This consists of laminated very fine sand with silts and shale streaks. Skolithos and Diplocraterion ichnofacies at the contact with Heterolithics facies. Thin band of siderite and shale laminar, load cast present.
Skolithos Ichnofacies assemblage which penetrates non cohesive sandy substrates at high energy shore which is possibly lower tidal flats
Middle Tidal Flats Deposits
Bioturbated Heterolithics Facies (BHF) and Shale Facies (SF)
Middle Tidal Flat Deposits consists of two facies BHF and SF. Basal HF consisting sandstone/silts =55%, shale = 45%. Mid-section, sandstone/silts = 75%, shale decreases to 25%. Sedimentary structures present are herringbone, planar cross laminations. SF consists of dark grey shales interlaminated with heterolithics : Upper HF has mudstone=35%, siltstone=35%, sandstone=30%, lenticular bedded.
Table 2 Continue: Summary of the Facies, Facies Association, Description and Interpretation of GX1
Facies Association Description Interpretation
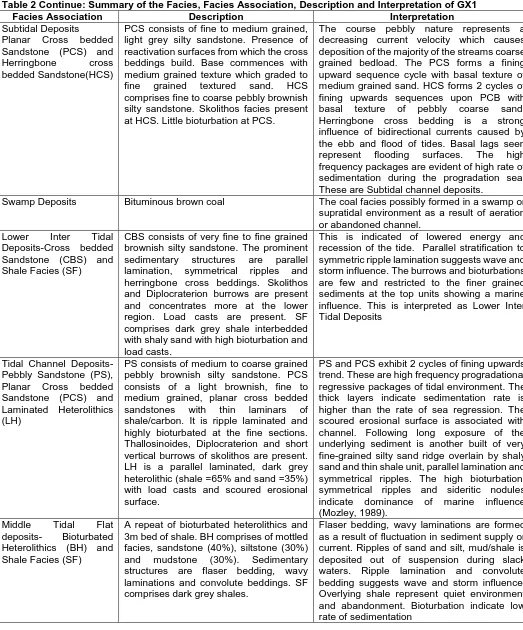
Subtidal Deposits
Planar Cross bedded Sandstone (PCS) and Herringbone cross bedded Sandstone(HCS)
PCS consists of fine to medium grained, light grey silty sandstone. Presence of reactivation surfaces from which the cross beddings build. Base commences with medium grained texture which graded to fine grained textured sand. HCS comprises fine to coarse pebbly brownish silty sandstone. Skolithos facies present at HCS. Little bioturbation at PCS.
The course pebbly nature represents a decreasing current velocity which causes deposition of the majority of the streams coarse grained bedload. The PCS forms a fining upward sequence cycle with basal texture of medium grained sand. HCS forms 2 cycles of fining upwards sequences upon PCB with basal texture of pebbly coarse sand. Herringbone cross bedding is a strong influence of bidirectional currents caused by the ebb and flood of tides. Basal lags seen represent flooding surfaces. The high frequency packages are evident of high rate of sedimentation during the progradation sea. These are Subtidal channel deposits.
Swamp Deposits Bituminous brown coal The coal facies possibly formed in a swamp or supratidal environment as a result of aeration or abandoned channel.
Lower Inter Tidal Deposits-Cross bedded Sandstone (CBS) and Shale Facies (SF)
CBS consists of very fine to fine grained brownish silty sandstone. The prominent sedimentary structures are parallel lamination, symmetrical ripples and herringbone cross beddings. Skolithos and Diplocraterion burrows are present and concentrates more at the lower region. Load casts are present. SF comprises dark grey shale interbedded with shaly sand with high bioturbation and load casts.
This is indicated of lowered energy and recession of the tide. Parallel stratification to symmetric ripple lamination suggests wave and storm influence. The burrows and bioturbations are few and restricted to the finer grained sediments at the top units showing a marine influence. This is interpreted as Lower Inter Tidal Deposits
Tidal Channel Deposits-Pebbly Sandstone (PS), Planar Cross bedded Sandstone (PCS) and Laminated Heterolithics (LH)
PS consists of medium to coarse grained pebbly brownish silty sandstone. PCS consists of a light brownish, fine to medium grained, planar cross bedded sandstones with thin laminars of shale/carbon. It is ripple laminated and highly bioturbated at the fine sections. Thallosinoides, Diplocraterion and short vertical burrows of skolithos are present. LH is a parallel laminated, dark grey heterolithic (shale =65% and sand =35%) with load casts and scoured erosional surface.
PS and PCS exhibit 2 cycles of fining upwards trend. These are high frequency progradational regressive packages of tidal environment. The thick layers indicate sedimentation rate is higher than the rate of sea regression. The scoured erosional surface is associated with channel. Following long exposure of the underlying sediment is another built of very fine-grained silty sand ridge overlain by shaly sand and thin shale unit, parallel lamination and symmetrical ripples. The high bioturbation, symmetrical ripples and sideritic nodules indicate dominance of marine influence (Mozley, 1989).
Middle Tidal Flat deposits- Bioturbated Heterolithics (BH) and Shale Facies (SF)
A repeat of bioturbated heterolithics and 3m bed of shale. BH comprises of mottled facies, sandstone (40%), siltstone (30%) and mudstone (30%). Sedimentary structures are flaser bedding, wavy laminations and convolute beddings. SF comprises dark grey shales.
Table 3: Summary of the Lithological characteristics, Facies, Facies Association and Interpretation of GX2
Facies Association Lithological Description Interpretation
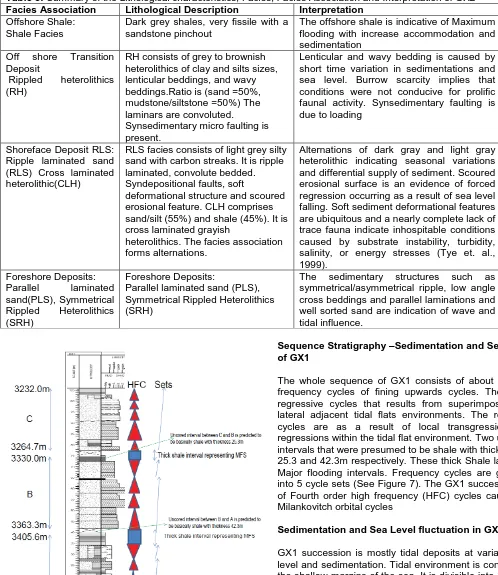
Offshore Shale: Shale Facies
Dark grey shales, very fissile with a sandstone pinchout
The offshore shale is indicative of Maximum flooding with increase accommodation and sedimentation
Off shore Transition Deposit
Rippled heterolithics (RH)
RH consists of grey to brownish heterolithics of clay and silts sizes, lenticular beddings, and wavy beddings.Ratio is (sand =50%, mudstone/siltstone =50%) The laminars are convoluted. Synsedimentary micro faulting is present.
Lenticular and wavy bedding is caused by short time variation in sedimentations and sea level. Burrow scarcity implies that conditions were not conducive for prolific faunal activity. Synsedimentary faulting is due to loading
Shoreface Deposit RLS: Ripple laminated sand (RLS) Cross laminated heterolithic(CLH)
RLS facies consists of light grey silty sand with carbon streaks. It is ripple laminated, convolute bedded. Syndepositional faults, soft
deformational structure and scoured erosional feature. CLH comprises sand/silt (55%) and shale (45%). It is cross laminated grayish
heterolithics. The facies association forms alternations.
Alternations of dark gray and light gray heterolithic indicating seasonal variations and differential supply of sediment. Scoured erosional surface is an evidence of forced regression occurring as a result of sea level falling. Soft sediment deformational features are ubiquitous and a nearly complete lack of trace fauna indicate inhospitable conditions caused by substrate instability, turbidity, salinity, or energy stresses (Tye et. al., 1999).
Foreshore Deposits: Parallel laminated sand(PLS), Symmetrical Rippled Heterolithics (SRH)
Foreshore Deposits:
Parallel laminated sand (PLS), Symmetrical Rippled Heterolithics (SRH)
The sedimentary structures such as symmetrical/asymmetrical ripple, low angle cross beddings and parallel laminations and well sorted sand are indication of wave and tidal influence.
Figure 7: Vertical Succession of GX 1 showing, depth, uncored interval, High frequency cycles and Set
Sequence Stratigraphy –Sedimentation and Sea Level of GX1
The whole sequence of GX1 consists of about 12 high frequency cycles of fining upwards cycles. These are regressive cycles that results from superimposition of lateral adjacent tidal flats environments. The repeated cycles are as a result of local transgression and regressions within the tidal flat environment. Two uncored intervals that were presumed to be shale with thickness of 25.3 and 42.3m respectively. These thick Shale layer are Major flooding intervals. Frequency cycles are grouped into 5 cycle sets (See Figure 7). The GX1 successions is of Fourth order high frequency (HFC) cycles caused by Milankovitch orbital cycles
Sedimentation and Sea Level fluctuation in GX1
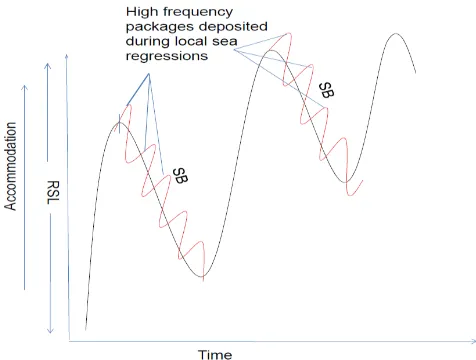
or evaporate. So, regression of the sea will bring the intertidal upon subtidal, and supratidal upon intertidal forming a fining upwards succession. There are 10 cycles of fining upwards cycle in a tidal flat setting. These regression causes deposition of lateral adjacent tidal flat environment to be superimposed generating characteristics succession of vertical facies. During tidal regression, progradation produces a generalised fining upwards successions. Each Succession represent high frequency cycle (HFC) occurring at local sea level reduction being controlled by tide (see Figure 8). A number of related cycles adjacent or superimposed of which there is an decreasing grain sizes or thinning of the beds forms a cycle set (Tucker, 2003). The cycle set is a representation of major sea regression that gave birth to the high frequency cycles (see Sinusoidal Curve) About 4 Sets of cycle were delineated in GX1.
GX1 System Tracts
From the base, Lower intertidal sands were followed by middle tidal flat deposits consisting of the bioturabated heterolithics and shale (see Table 2). The next is the shale(mud) of the upper tidal flat. Each is representing a fining upwards cycle. The trio forms a set. Sedimentation is low as portrayed by the evidence of bioturbation of Skolithos Ichnofacies assemblages. The first major flooding followed immediately after which the next high frequency cycles, where the sea level variations are within the subtidal zone. Three cycles of fining upwards succession were built in 3 series of local regression and transgression. During this period sedimentation is higher than the accommodation as the sea level fell and thick volumes of sands were deposited. Sedimentary facies like planar cross bedded sandstone and Herringbone cross bedded sandstone were deposited with features like bed loads were deposited. The subtidal deposits was by a major break that brought about exposure and plant growth resulting in 2 meter- coal of swamp origin. Transgression possibly brought about deposition of Lower intertidal deposits which was not well defined. Second phase of maximum flooding, was followed by another sea level fall birthing 3 HFC forming a set. Tidal channel deposit consisting of pebbly coarse sandstone with cross beddings and scoured erosional surface was followed by middle tidal flat deposit in a forced regression mode. Sedimentation exceeded accommodation. Thick deposit of tidal channels sands was deposited.
The vertical succession of GX1 sequence commenced with a Falling Stage System Track, FSST to Lowstand System Tract, LST consisting of Lower Intertidal and lower part of the Middle Tidal Flats deposits. Starvation of sediment input during the low tide or local regression Evidenced by bioturbation skolithos and diplocraterion. These deposits are made up of Fine Sandstone Facies, Bioturbated Heterolithics and Shale Facies from bottom to top. This represents a shift from deeper water to shallower water of the tidal environment. The Transgressive System
Tract, TST may be represented by Bioturbated Heterolithic Facies because transgression may have worked deeper water facies (Boggs,2006). Low sediment input during the rising tide or local transgression. This is evidenced by vertical burrows skolithos and diplocraterion. The Maximum Flooding Surface overlies the TST and consists of shale facies. Accommodation is increased at this period and the shelf is starved of the sediment. The Highstand System Tract is the sediment deposited when the tide is at highest level. Reactivation surfaces are evident in Subtidal deposits of HST. High influx of sediment during the highest tide had inbited faunal activity resulting in scarcity of bioturbation and burrows.
Within the tidal environment, this consists of the Subtidal deposits such as Planar Cross Bedded Sandstone and Herringbone Cross Bedded Sandstone. These are pebbly fine to coarse grained sandstone that formed 3 regressive cycles of fining upwards. Sequence Boundary (SB) bordered the HST and is a surface of subaerial exposure represented by the coal facies of swamp deposit (Figure 3). The sequence boundary is overlain by Lower inter tidal deposit of TST which would have been reworked (Boggs, 2006). Low sediment input during the rising tide or local transgression is proved by vertical burrows of skolithos and diplocraterion. The next MFS consists of the shale facies. The next HST comprises of the Tidal channel deposits se were deposited during regression of the sea on the tidal environments. Scoured erosional is evidence of the forced regression. Above the HST, the SB might have been missing as it is represented by the LST made up of middle tidal flat deposit. The sediments are Bioturbated heterolithic and Shale facies.
Figure 8: GX1 Accommodation relative to time and HFC during local sea regression within a major sea level regression.
GX2 Sequence Startigraphy Sedimentation and Sea Level Variation
a result of sea level fall or sea ward movement of shore line and it is known as forced regression. We have four facies association each depicting an environment in relation to its position to the shoreline. From the bottom, we have thick volume of offshore shale of 15meters thick, overlain by the rippled heterolithics of offshore transition. This is followed by ripple laminated sand and cross laminated heterolithics of Shoreface environment. The cap deposit is theForeshore deposits consisting of parallel laminated sand and symmetrical rippled heterolithics. . Scoured erosional surface is evidence of forced regression in this zone (see B in Figure). They form a vertical succession of coarsening upwards sequence. The presence of skolithos ichnofacies in the foreshore deposit is indicative of slow sedimentation or scarce sediment as the sea level fell.
Figure 9: Interplay of Seal level, sedimentation and Accommodation. VI represent the shoreface and offshore transition (modified after Nichols, 2009
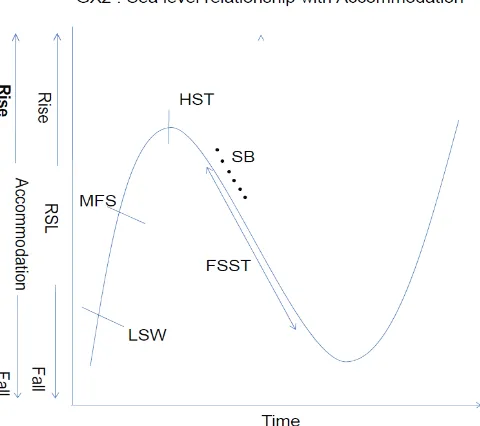
Figure 10: Seal Level Variation with Accommodation. The positions of the system tracts along a major rise and fall of sea level.
Down the bottom offshore shale is sand incised into the shale or extreme part of channel cutting into the shale. This is possibly part of a Low stand wedge (see Figure 11).
The bottom tracts started with the top of the shale that represent maximum flooding surface, where there is maximum incursion into the land. The shale is incised with Low Stand wedge of clean sandstone. The high System Track, HST is represented by the offshore transition and shoreface deposits. This is the period of highest sea level rise. This is followed by the Sequence Boundary (SB) represented by the unconformity (angular) showing a period of non deposition and probably erosion of the surface and tectonics. Falling Stage System Tract, FSST is represented by the fore shore deposits. FSST is represented by parallel laminated sand and symmetrical ripple laminated heterolithics
Figure 11: GX2, A- Incised fill within the thick shale layer, A and the white line is the position of minor faults, B-Sequence boundary marked by an unconformity, short burrows of Skolithos perpendicular to bedding plane.
Effects of Sedimentation Rate and sea level changes on Reservoir Property calculated.
The core porosity and permeability calculated for both well revealed that reservoir properties are variable for both wells even though both were mostly deposited during regression of the sea. The porosity values for the entire tidal environments close ranging from 22 to 26.2% but variable permeability. High Stand System Tract represented by the tidal channel deposits and subtidal deposits recorded the highest permeability value, 4805 and 4010mD respectively (see Table 4). Their porosities for both are equally high.
Table 4: Mean value result of 5 samples for each Facies Association measures at reservoir condition, 3600Psi: Porosity and permeability for GX1 well.
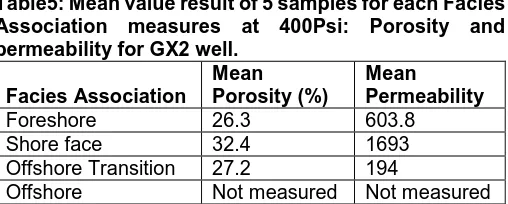
In GX2, there is a general high porosity values throughout the environment, but much lower permeability. The porosity value for GX2 ranges from 26.3 to 32% (Table 5).
Table5: Mean value result of 5 samples for each Facies Association measures at 400Psi: Porosity and permeability for GX2 well.
Facies Association
Mean Porosity (%)
Mean Permeability
Foreshore 26.3 603.8 Shore face 32.4 1693 Offshore Transition 27.2 194
Offshore Not measured Not measured
The Shoreface environment representing the upper Highstand System Tract (HST) has the highest porosity and permeability, 32.4% and 1693mD respectively. Falling Stage System Tract (FSST) sediment is the second best in porosity in both wells. In GX1, the FSST represented by the fine sandstone facies has a permeability of 1214mD. In GX2, the FSST has a permeability of 603.8mD.
SUMMARY AND CONCLUSION
In the Coastal Swamp Deposit and Shallow offshore of Niger Delta had experienced regression as a result of progradation of the shoreline. Delta environment globally is a complex environment being controlled by many processes. Both tides and wave processes played vital role in sedimentation of GX1 and GX2. These are
explainable by numerous waves and tidal structures such as cross beddings, wave ripple laminations, herringbone cross bedding, reactivation surfaces, flaser and lenticular bedding. Coastal swamp deposit which is interpreted as mostly tidal environment experienced progradation being represented by high frequency cycles of fining upwards vertical successions. GX2 vertical succession was deposited as the as sea level fell but it is represented by 2 cycles of coarsening upward vertical succession. HST in GX1 formed thick beds while in GX2, the beds are thinner. It can be deduced from both wells that in a progradational sequences, HST are the best reservoir. Bioturbations in both wells have not favoured the reservoir property. This is partly in accordance with Lemoine et al (1987) study that Clay-lined burrow walls would create numerous permeability barriers which significantly alter fluid flow patterns within rock facies. Although not all the burrows were lined. Other factor in the burrow could be the connectivity.
ACKNOWLEDGEMENT
My sincere gratitude to Delta Terratek Limited for permission to use their core laboratory and their support and assistance throughout the study.
REFERENCES
Adesida, A. A, Reijers T. J. A, and Nwajide C. S. (1997). Sequence stratigraphic framework of the Niger Delta.
Paper presented at the AAPG international conference and exhibition, Vienna, Austria
Akaegbobi I.M,, Ola-Buraimo A. O., Otosigbo G.O., Eluwa N. N., 2018. Textural Characteristics and Post Depositional Effects on the Reservoir Rock: A Case Study of Core Samples from Wells GX1 and GX2 Located on the Western Offshore of the Niger Delta, Nigeria. International Journal Geology and Mining Vol. 4(2), pp. 223-236,
Akpoyovbike, A. A. (1978). Tertiary lithostratigraphy of Niger Delta. The American Association of Petroleum Geologists Bulletin, 62(2): 295-306.
American Petroleum Institute, (1990). Core Analysis, 2nd Edition, Recommended Operating Practices RP40, Washington, DC. USA.
Boggs, S. Jr. (2006). Principles of stratigraphy and sedimentology. Pearson Education Inc. 4th edition. Pp.483
Evamy, D. D., J. Haremboure, P. Kemerling, Knaap, W. A., Morlly, F. A. and Rowlands, P. H. (1978). Hydrocarbon habitat of Tertiary Niger Delta. The American Association of Petroleum Geologists Bulletin, 62: 1-39.
Eze, S. C., Mode, A.W., Adejinmi, A. and Ozumba, B. M. (2016). Ichnological Characteristics and variability of Miocene deposits in the Cenozoic Niger Delta: Examples from cores in the Coastal Swamp and Offshore Depobelts.
Facies Association Mean Porosity(&) Mean Permeability(mD)
Middle Tidal Flat 24 721
Tidal channel 24.8 4805
Lower Inter tidal 23.1 1376
Swamp Not measured Not measured
Subtidal 24 4010
Upper Tidal Flat Not measured Not measured
Middle Tidal Flat 26.2 551.5
Hospers, J. (1965). Gravity field and structure of the Niger Delta, Nigeria, West Africa: Geological Society of American Bulletin, 76: 407-422
Kaplan, A., Lusser, C. U. and Norton, I. O. (1994). Tectonic map of the world, in Tuttle, M.L.W., Charpentier, R. R., Brownfield, M. E., 1999. The Niger Delta Province, Nigeria, Cameroon, and Equatorial Guinea, Africa.
USGS, open-file Report, 99-150
Knox, G. J. and Omatsola, E. M. (1989). Development of the Cenozoic Niger Delta interms of the Escalator Regression model and impact on hydrocarbon distribution.Proceedings KNGMG symposium Coastal Lowlands, Geology and Geotechnology,181-202. Kulke, H. (1995). Nigeria, in Kulke, H., Ed., Regional
Petroleum Geology of the World. Part II: Africa, America, Australia and Antarctica: Berlin, Gebruder Borntraeger, 143-172.
Lemoine, R. C., Moslow, T. F. and Lowry, P., 1987, Effects of Primary Sedimentary Processes on Reservoir Quality of "Deep Wilcox" (Eocene) Sandstones in Fordoche Field, Louisiana. AAPG Search and Discovery Article #91038©1987 AAPG Annual Convention, Los Angeles, California.
Nichols G., 2009: Sedimentology and Stratigraphy. Willey Blackwell 410pp
Mozley, P. S. (1989). Relation between depositional environment and the elemental composition of early diagenetic siderite. Geology, 17: 704-706.
Murat, R. C. (1972). Stratigraphy and Paleogeography of the Cretaceous and Lower Tertiary in Southern Nigeria in T. F. J Dessauvagie and A. J. Whiteman (Eds);
African Geology, Geology Department, Ibadan, Nigeria.
Obaje(2006). Obaje Obaje, N. G., 2009, Geology and Mineral Resources of Nigeria. Springer Verlag-Berlin Heidelberg 221pp.
Ola-Buraimo, A. O. (2013c). Biostratigraphy and paleoenvironment of the Coniacian Awgu Formation in Nzam-1 well, Anambra Basin, southeastern Nigeria.
International Journal of Scientific and Technology Research, 2(3): 112-122.
Ola-Buraimo, A. O. (2013d). Biostratigraphy and paleoenvironment of deposition of Bima and Gongila Formations in M-1 well, Bornu Basin, Northeastern Nigeria. International Journal of Scientific and Technology Research, 2(8): 320-328.
Ola-Buraimo, A. O. and Akaegbobi, I.M. (2013C). Palynological evidence of the oldest (Albian) sediment in the Anambra Basin, southeastern Nigeria. Journal of Biological and Chemical Research, 30(2): 387-408
Oyanyan, R.O., Soronnadi-Ononiwu, C.G., Omoboriowo, A.O., 2013. Depositional Environments of sam-bis oil field reservoir sands, Niger Delta, Nigeria. Adv. Appl. Sci. Res 3, 1624-1638
Readings, H. G. (1996). Sedimentary Environments, Processes, Facies and Stratigraphy. Blackwell, Oxford,
688p.
Reijers, T. J. A., Petters, S.W. & Nwajide, C. S. (1997). The Niger Delta basin in Reijers, T. J. A ed; Selected Chapters in Geology: Warri-Nigeria, SPDC Corp. Reprographic Services, 103-117.
Short, K. C. and Stauble, A. J. (1967). Outline of Geology of Niger Delta. TheAmerican Association of Petroleum Geologists Bulletin, 51: 761-779.
Stacher, P. (1995). Present understanding of the Niger Delta hydrocarbon habitat, in, Oti, M. N., Postma, G., eds., Geology of Deltas: Rotterdam, A. A. Balkema,
257-267.
Weber, K. J., and Dakouru, E. (1975). Petroleum Geology of Niger Delta; Proceedings of the Ninth World Petroleum Congress, v. 2. Geology: London, Applied Science Publishers, Ltd., 210-221.
Whiteman, A. J. (1982). Nigeria its Petroleum Geology, Resources and Potential: London, Graham and Trotman, 394 p
William H. (1996). Atlas of reservoir geology, procedures and guidelines. The Shell Petroleum Development Company of Nigeria Limited.
Accepted 22 May 2019
Citation: Otosigbo GO, Nzekwe KE, Onwe IM (2019). Sequence Stratigraphy, Variable Sedimentations, Sea Level Fluctuations and Net Effect on Reservoir Qualities: A Study of Cores from Two Wells GX1 and GX2 in the Niger Delta Basin. International Journal of Geology and Mining 5(2): 258-268.