189
Corresponding author
email address: [email protected]
Optimization of gas metal arcwelding parameters of SS304 austenitic
steel by Taguchi –Grey relational analysis
Saadat Ali Rizvi * and S. P. Tewari
Mechanical Engineering Department, Indian Institute of Technology (BHU), Varanasi, India
Article info: Abstract
This study investigated the optimization of three welding parameters (wire feed speed, arc voltage, and shielding gas flow rate) for SS 304H by using Taguchi based Grey relational analysis. In this research work, pure argon was used as shielding gas. Numbers of trials were performed as per L16 (4xx3)
orthogonal array design and the mechanical quality such ultimate tensile strength, microhardness, Toughness, and microstructure of SS304H optimized by Grey-based Taguchi analysis and result shows that the optimal parameters combination were as A4B4C3 i.e. flow rate at 23L/min, voltage at 25 V and welding speed at 350IPM and it was observed that wire feed speed had the most significant effect followed by voltage and gas flow rate. An optimal combined parameter of the welding operation was obtained via Grey relational analysis. By analyzing Grey relational grade matrix, the degree of influence for each controllable process factor onto individual quality targets can be found.
Received: 18/01/2017 Accepted: 09/10/2017 Online: 10/03/2018
Keywords:
SS304H,
Mechanical properties, Taguchi technique, Grey relational analysis, SEM.
1. Introduction
Welding is a fabrication process which is used to bond same or different materials that can be either ferrous or nonferrous metal, and most of the welding process utilize heat, pressure or both for fabrication of join. The gas metal arc welding is considered to be a key of arc welding processes [1]. The gas metal arc welding process provides a high quality of mechanical properties and metallurgical welded joints. SS304H is widely used in various industries such as petrochemical, automobile, thermal power plant, aerospace, paper, food process industries, kitchen applications due to its corrosion resistance and superior tensile strength [2-3]. Toughness and ductility of
190
[7] optimized the TIG welding process parameters for welding of dissimilar pipe joints via Taguchi method, and they mentioned in their conclusion that higher heat input results in lower tensile strength. Hakan et al. [8] examined the optimization of friction stir welding process parameters for an optimal parametric combination to yield favorable tensile strength and elongation using the Taguchi based GRA. Sharma et al. [9] optimized the turning parameters in turning operation of AISI 8620 steel using Taguchi and Grey-Taguchi analyses to obtain an acceptable surface roughness.
Ghosh et al. [10] optimized the gas metal arc welding process parameters on 316L steel by Grey relational based Taguchi method, and the current was found to be more significant parameter than gas flow rate influencing the strength of the welded joints. Datta et al. [11] applied Taguchi technique followed by GRA to solve multi-response optimization problem during the submerged arc welding. Sathiya et al. [12] optimized the weld bead characteristics of a super austenitic stainless steel (904L) by application of Grey-based Taguchi method, and they reported that Gray relational grade helps quantifying the integrated performance of bead-on-plate welding of the gas metal arc welding process. Rizvi et al. [13] optimized the process parameters that affect the weldability of IS2062, and in their result, they mentioned that welding current and voltage have significant effects whereas gas flow rate has an insignificant effect on tensile strength of the welded joint. Khalilpourazary et al. [14] applied Taguchi-based Grey technique for optimization of the process parameters during the turning of ST7 steel, and they mentioned that the optimum values of parameters can be achieved for a high degree of surface roughness.
2. Research Method
2.1. Experimental procedures
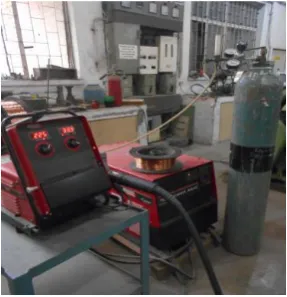
SS304H plates of dimension 260 mm × 70 mm × 5 mm were welded using Lincoln, USA gas metal arc welding machine, with Polarity Direct Current Electrode Negative [DCEN]. The chemical composition of base metal and filler wire is listed in Table 1. Filler wire of 2.0 mm diameter was used in this experimental work.
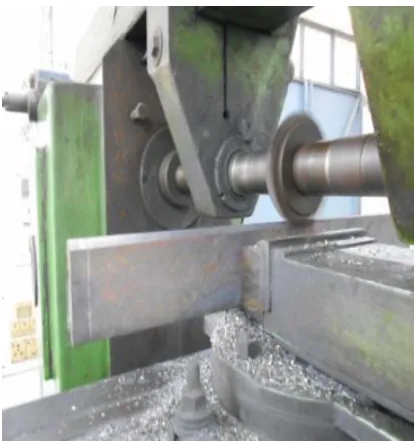
Welded plates were machined on horizontal milling machine for making V-groove.
Fig. 1. Graphical abstract.
Figure 1 shows the graphical abstract of the paper, whereas Figs. 2 and 3 show the actual experimental setup and the milling process to fabricate V-groove on the SS plate before the welding to get the proper penetration, respectively.
Table 1. Chemical composition of parent metal and filler wire.
Material C Cr Elements (wt%) Ni Si Mn P Fe
SS304H 0.08 18.20 8.5 0.45 1.55 0.03 Rem. Filler
wire ER
308 18.5 10 0.4 1.7 0.05 --- Rem.
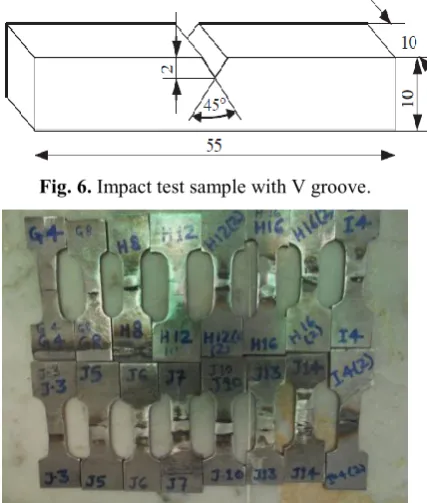
In the experiments, pure Argon (Ar) was used as shielding gas for spray transfer mode and was adopted during the gas metal arc welding, which produced consistent bead width and good appearance with a stable arc formation. After welding of 16 samples, tensile test specimens were prepared as per ASTM standard [15] by cutting and machining on a milling machine. The size and shape of each tensile test specimen are shown in Fig. 5.
191
Fig. 3. V-groove making on milling m/c.
2.2. Optimization of welding process via Grey-based Taguchi analysis
Figure 4 shows the proposed flow chat of the process adopting during the welding of this experimental work. Fig. 4 clearly shows which step is the first in the optimization of the process and which one is the last.
Fig. 4. Proposed Grey-based Taguchi method.
2.2.1. Experimental procedure
In the present research article, three-level gas metal arc welding process parameters i.e. welding current, wire feed speed, and gas flow rate were selected. Values of process parameters are shown in Table 2. Optimum welding process parameters, which considered the multiple performance characteristics, were acquired. The initial values of the welding
parameters were wire feed speed of 250 IPM, gas flow rate of 10 l/min, and arc voltage of 20 V. Welding experiments for determining the optimal welding parameters were carried out by setting the wire feed speed at 250, 300, 350, and 400 IPM, arc voltage at 20, 21, 22, and 23 V, and gas flow rate at 10, 15, 20, and 25 l/min.
Table 2. Welding process parameters and their levels.
Factors Parameters Unit Level I
Level II
Level III
Level IV A Wire
feed rate
IPM 250 300 350 400
B Arc
voltage
V 20 21 22 23
C Gas flow rate
l/min 10 15 20 25
The summary of experimental conditions is shown in Table 3. The experimental results after metal arc welding were estimated in terms of the following measured performance: (1) ultimate tensile strength (UTS), (2) absorbed energy (AE) of Charpy impact test results of the welded specimen, and (3) % age elongation. In order to attain supreme weldability, Taguchi’s experimental design was utilized for conducting experiments. For this, an L16 orthogonal array was used for the experiment. Tensile specimens (shown in Fig. 5) were prepared as per ASTME8/E8M – 11.Standard specimens adopted in the tensile experiments are tested by a universal testing machine at room temperatures.
Fig. 5. Tensile test diagram for gas metal arc welding as per ASTM [12].
192
Fig. 6. Impact test sample with V groove.
Fig. 7. Actual tensile test specimens.
3. Grey relational analysis
3.1. Data pre-processing
Let the original reference sequence and sequence for comparison are represented as xo(k) and xi(k), i=1, 2, ... .,m; k=1,2, . . ., n,
respectively, where m is the total number of the experiment to be considered, and n is the total number of observation data. Optimization of multiple responses can be simultaneously performed with Grey relation analysis to find out the optimal levels that consist of many outputs [15-18].With the meager information available, GRA can judge or evaluate the performances of a complex process that involves more than one output. In GRA, the raw data have to be pre-processed into a quantitative index for subsequent analysis [19–20]. Pre-processing raw data involves conversion or raw data into a decimal sequence that lies between 0.00 and 1.00, which is useful for comparison. The sequence can be normalized for the condition Higher-the-better as:
𝐱𝐢∗(𝐤) =
𝐱𝐢𝐨(𝐤)−𝐦𝐢𝐧𝐱𝐢𝐨(𝐤)
𝐦𝐚𝐱 𝐱𝐢𝐨(𝐤)−𝐦𝐢𝐧𝐱
𝐢𝐨(𝐤) (1)
Xi*(k) represents the data sequence after pre-processing, xio(k) represents the original sequence, largest value of xio(k) is max xio(k), and smallest value of xio(k) is min xio(k).
Normalizing the data for lower-the-better condition is given as:
𝐱
𝐢∗(𝐤) =
𝐦𝐚𝐱𝐱𝐢𝐨(𝐤)−𝐱𝐢𝐨(𝐤)𝐦𝐚𝐱𝐱𝐢𝐨(𝐤)−𝐦𝐢𝐧𝐱𝐢𝐨(𝐤) (2)
However, if there is “a specific target value” then the original sequence is normalized using:
𝐱
𝐢∗(𝐤) = 𝟏 −
|𝐱𝐢𝐨(𝐤)−𝐎𝐁|𝐦𝐚𝐱{𝐦𝐚𝐱.𝐱𝐢𝐨(𝐤)−𝐎𝐁,𝐎𝐁−𝐦𝐢𝐧.𝐱𝐢𝐨(𝐤)}
(3) where OB is the target value.Alternatively, the original sequence can be normalized using the simplest methodology that is the value of the original sequence that can be divided by the first value of the sequence,
𝐱
𝐢𝐨(𝟏)
.𝐱
𝐢∗(𝐤) =
𝐱𝐢𝐨(𝐤)𝐱𝐢𝐨(𝟏) (4)
where
𝐱
𝐢𝐨(𝐤)
is the original sequence,𝐱
𝐢∗(𝐤)
isthe sequence after the data pre-processing,
𝐦𝐚𝐱. 𝐱
𝐢𝐨(𝐤)
is the largest value of𝐱
𝐢𝐨(𝐤)
,𝐦𝐢𝐧
. 𝐱
𝐢𝐨(𝐤)
is the smallest value of𝐱
𝐢𝐨(𝐤)
.3.2. Grey relational coefficients and Grey relational grades
After completing data pre-processing, in order to express a relationship between actual and ideal normalized values, a Grey relational coefficient [21-23] is determined, as expressed in Eq. (5):
𝛇𝐢(𝐤) =
𝚫𝐦𝐢𝐧+𝛇.𝚫𝐦𝐢𝐧
𝚫𝐨𝐢(𝐤)+𝛇.𝚫𝐦𝐚𝐱
(5)
∆oi(k) represents the deviation sequence, which is calculated by:
∆oi (k)=|| Xo* (k)- Xi* (k) ||,
∆max. (k)=𝑚𝑎𝑥.∀𝑗𝑖Ɛ 𝑚𝑎𝑥∀ 𝑘|| Xo* (k)- Xi* (k) ||,
∆min. (k)=𝑚𝑎𝑥.∀𝑗𝑖Ɛ 𝑚𝑎𝑥∀ 𝑘|| Xo* (k)- Xi* (k) ||,ζ is the distinguishing coefficient and ζ = 0.5 is generally used.
A Grey relational grade is a weighted sum of the Grey relational coefficients, and is defined as follows:
ᵧ (
𝐱
𝟎∗,. 𝐱
𝐢∗)
=∑
𝒏𝛃
𝐤𝜸
𝑛(𝐱
𝟎∗(𝐤), 𝐱
𝐢∗(𝐤)
𝒌=𝟏193 Here the Grey relational grade ᵧ(
𝐱
𝟎∗,
. 𝐱
𝐢∗)
represents the level of correlation betweenthe reference and comparability sequences. If the two sequences are identical, then the value of the Grey relational grade equals to one. The Grey relational grade also indicates the degree of influence exerted by the comparability sequence on the reference sequence. The GRA is actually a measurement of the absolute value of data difference between the sequences and can be used to approximate the correlation between the sequences.
4. Results and discussion
4.1. Results
The tensile test specimens, prepared corresponding to L16 Taguchi orthogonal array experiments, were tested for tensile strengths and the results obtained are given in Table 3. The experimental results were processed further with the requirements of GRA. The grey relational coefficient, grey relational grade and the rank of each experiment were found from Table 4, and the results as well.
The GRG values offer a single representation of the three responses, and a higher value of GRG is chosen. From Table 4, it is found that the experiment number 5 has the highest Grey relational grade of 0.7371. Therefore, parameter setting of the experiment number 5 is likely to be optimal. With the help of Response graph from Fig.8 for mean grey relational grade the optimal welding parameters determined and
the optimal combination is A4B4C3 i.e. arc voltage at 23V, gas flow rate of 25l/min and wire feed rate at 350 ipm.
Fig. 8. Main effects plot for SN ratios.
Basically, the larger the S/N ratio, the better the corresponding performance characteristics, as shown in Fig. 8.
Grey relation grade values provided in Table 4 and a curve between grey relation grades and number of experiment is shown in Fig. 9, for all 16 experiments run as per L16 orthogonal arrays, and it is observed from Fig 9 that a change in the response happens when factors go from one level to another. It is also very clear from the figure that experiment no 16 has the highest grey relation grade value. Therefore, it is proved that all 16 run has optimal parameters setting for the best multi response characteristics.
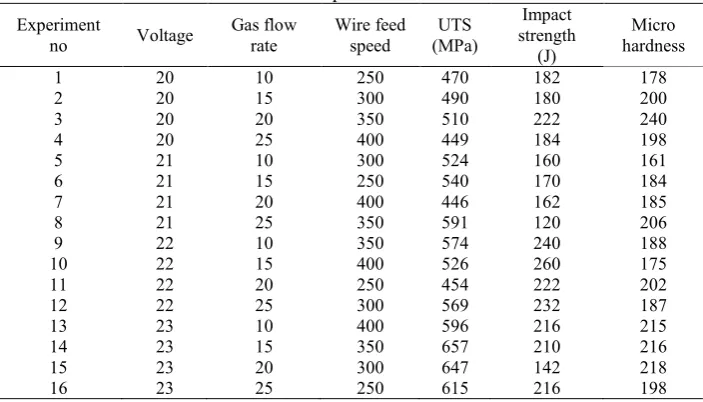
Table 3. Experimental data.
Experiment
no Voltage Gas flow rate Wire feed speed (MPa) UTS
Impact strength
(J)
Micro hardness
1 20 10 250 470 182 178
2 20 15 300 490 180 200
3 20 20 350 510 222 240
4 20 25 400 449 184 198
5 21 10 300 524 160 161
6 21 15 250 540 170 184
7 21 20 400 446 162 185
8 21 25 350 591 120 206
9 22 10 350 574 240 188
10 22 15 400 526 260 175
11 22 20 250 454 222 202
12 22 25 300 569 232 187
13 23 10 400 596 216 215
14 23 15 350 657 210 216
15 23 20 300 647 142 218
194
Table 4. Proposed data, GRC and GRG for SS304H.
Experiment No
Normalized Values Grey relation coefficient
UTS strength Impact hardness Micro UTS strength Impact hardness Micro relation Grey
grade Rank
1 0.1137 0.4428 0.2151 0.8147 0.5303 0.6992 0.6814 2
2 0.4454 0.4285 0.4936 0.5288 0.5385 0.5032 0.5235 11
3 0.0379 0.7285 1.0000 0.9295 0.4070 0.3333 0.5566 8
4 0.8009 0.4571 0.4683 0.3843 0.5224 0.5163 0.4743 13
5 0.3696 0.2857 0.0000 0.5749 0.6363 1.000 0.7371 1
6 0.3696 0.3571 0.2911 0.5749 0.5928 0.6639 0.6073 4
7 0.5829 0.3000 0.3037 0.4617 0.6250 0.6221 0.5696 7
8 0.9526 0.0000 0.5696 0.3442 1.0000 0.4674 0.6038 6
9 0.3033 0.8571 0.3417 0.6224 0.3684 0.5940 0.5282 10
10 0.6872 1.0000 0.1772 0.4211 0.3333 0.7383 0.4975 12
11 0.4786 0.7285 0.5189 0.5109 0.4070 0.4907 0.4695 14
12 1.0000 0.8000 0.3291 0.3333 0.3846 0.6030 0.4403 16
13 0.0142 0.6857 0.6835 0.9723 0.4216 0.4224 0.6056 5
14 0.0000 0.6428 0.6962 1.0000 0.4375 0.4179 0.6184 3
15 0.5924 0.1571 0.7215 0.4577 0.7609 0.4093 0.5526 9
16 0.7109 0.6857 0.4683 0.4129 0.4216 0.5163 0.4502 15
Fig. 9. Grey relation grade for multi response
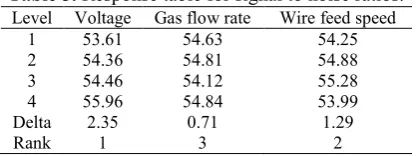
4. 2. Signals to noise ratios
Signal to noise ratio (S/N) is used to determine that which parameter of design of experiments significantly affect the quality characteristic.
Table 5. Response table for signal to noise ratios.
Level Voltage Gas flow rate Wire feed speed
1 53.61 54.63 54.25
2 54.36 54.81 54.88
3 54.46 54.12 55.28
4 55.96 54.84 53.99
Delta 2.35 0.71 1.29
Rank 1 3 2
In this case, for S/N ratio larger is better considered. Table 5 shows the signal to noise ratio.
4.3. ANOVA
ANOVA is developed by R.A. Fisher. It is defined as a collection of statistical models used to analyze the difference between group means and their associated procedures. The purpose of ANOVA experimentation is to reduce and control the variation of a process. It is also used to investigate which design parameters significantly affect the quality characteristic. Table 6 shows the ANOVA value. It is very clear from ANOVA that wire feed speed (65.82%) has the most significant effect followed by the voltage (24.16%) and gas flow rate (22.83). ANOVA table shows that the results are nearby related with Grey relation method.
4.4. Microstructural characterization
For microstructure examination of the welded joints, the specimens were cut from the joints and molded in PVC blocks. The cross-section surface of the specimens was ground and polished on double disk polishing machine with the different grades of emery papers from 200 to 1500 micron for 10 min each and then chemically etched with Glyceregia.- 15 mL HCl+10 mL glycerol + 5 mL nitric acid solution through swabbing for up to 2 min for optical observation. Microhardness was measured using a hardness tester with a constant load of 10kg for 10 s. Optical (Dewinter make, Italy) and No. of experiments
G
rey
relatio
n
gr
ad
195 scanning electron (SEM) microscopes were also
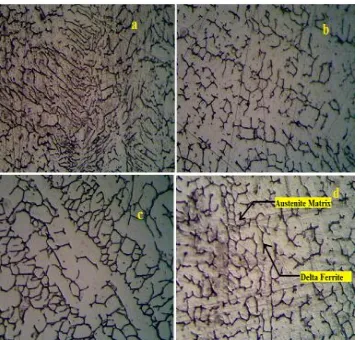
used. Some typical microstructures of the weldments are shown in Fig. 10(a-d). The microstructures of the welded joints consist predominantly of delta ferrite and austenite matrix. It was found from the results that changing the flow rate of shielding gas, causes some variations in the microstructure of the welded joints. Fig. 10(a-d) also shows the different grain patterns of the welded joints which is only due to the different welding parameters. Fig 10(a) shows coarse grain while Fig. 10(d) displays fine grains of the welded joint.
Fig. 10. Microstructure of weld metal (skeletal delta ferrite in austenite matrix) in samples (a) No. 1, (b) No. 2, (c) No. 3, and (d) No. 4.
(a) (b) (c)
Fig . 11. (a), (b) & (c) Fractography of a MIG welded joint after the tensile test at room temperature.
4.5. Fractography
Figure 11(a, b & c) shows SEM fractographic images of the tensile test specimen. The images clearly reveal numerous dimples indicating ductile fracture has occurred. It is also
observed that there are some spherical particles with small and large dimensions near the bottom of the dimples.
4.6. Energy dispersive spectrometer (EDS)
In order to determine microinclusions generated in the welded joints during the welding process, EDS analysis was conducted on the fractured specimen. Fig. 12 shows the results of the analysis indicating that inclusion generated in the weld metal contained Fe, C, Ti, Cr and Mn elements in amounts of 6% or more whereas C, Al, Fe, Si are less than 2%. The EDS results of the specimen imply that the inclusions are the oxides including MnO2, NiO2, CrO2, SiO2 and Al2O3. The size and amount of the oxides in the microstructures usually depend on the amount of CO2 present in shielding gas.On the contrary, the amount of Al, S, and Si elements are comparatively low. For commercial steels, the typical non-metallic inclusions are oxides, nitrides, and sulphides. Mn and S inclusions are effective in inducing accicluar Ferrite formation.
(a)
(b)
(c)
196
Table 6. ANOVA table for response and GRD.
Response Parameter Degree of freedom
Sum of
square Adj MS F P contribution %
UTS
Wire feed
speed 3 47219 15739.6 19.64 0.002 65.82
Voltage 3 4362 1454.1 1.81 0.245 6.1
gas flow
rate 3 15353 5117.8 6.39 0.027 21.4
Error 6 4807 801.2 6.7
total 15 71742
Impact Strength
Wire feed
speed 3 14664.7 4888.2 6.01 0.031 66.44
Voltage 3 932.8 310.9 0.38 0.770 4.22
gas flow
rate 3 1590.8 530.3 0.65 0.610 7.21
Error 6 4883.5 813.9 22.12
total 15 22071.7
Micro hardness
Wire feed
speed 1 2066.2 688.7 4.26 0.062 36.1
Voltage 1 1383.7 461.2 2.85 0.127 24.16
gas flow
rate 1 1307.2 435.7 2.7 0.139 22.83
Error 12 969.9 161.6 17
total 15 5726.9
5. Conclusions
The Grey relational analysis based on an orthogonal array of Taguchi technique is a way of optimizing the welding of SS304H. The analytical results are summarized as follows:
The best result was obtained for the sample
welded using the arc voltage of 25V, the flow rate of 25 l/min, and the wire feed speed of 350IPM. The worst result in tensile testing was obtained for the sample welded using the arc voltage of 20V, the gas flow rate of 20 l/min, and the wire feed speed of 400IPM.
Optimization of the process parameters wasdetermined by using Grey based Taguchi methodology; the optimum parametric combination was examined. The optimal factor setting became V4G4W3 (i.e. arc voltage = 23V, gas flow rate = 25l/min, and wire feed speed = 350IPM).
Mechanical properties of SS304H were
correlated with the metallurgical
characteristics.
Tensile test fractography analysis of SS304
showed a ductile fracture.
From ANOVA table for the response, it was
clear that wire feed speed had the most
significant effect followed by voltage and gas flow rate.
References
[1] Saadat Ali Rizvi, SP Tewari and
Wajahat Ali, Advanced Welding
Technology ,Katson publishers, New Delhi, INDIA, pp. 8-9,(2007).
[2] Lippold, J. C., and Koteki, D. J., Welding metallurgy and weldability of Stainless steels,2nd ed. john wiley & sons, New Jersey, pp. 40-41(2005).
[3] Baddoo N. R., ”Stainless steel in construction-A review of research,
applications, challenges and
opportunities’ of constructional steel research,Vol. 64, pp. 1199-06, (2008). [4] Tusek J., and Suban M., “Dependence of
melting rate in MIG/MAG welding on the type of shielding gas used”, Journal of Material Process Technology, Vol. 119 ,pp. 185-192,(2001).
197 Manufacturing, Vol. 15, No. 3
pp.447-454, (2014).
[6] A. K Srirangan, S.Paulraj, “Multi-response optimization of process parameters for TIG welding of Incoloy 800HT by Taguchi grey relational
analysis’’, Engineering Science and
Technology an International Journal, Vol 19, pp.811-817, (2016).
[7] R. Sathish, B., Naveen, P., Nijanthan, K., Arun Vasantha, Geethan, R., and Vaddi Seshagiri, “Weldability and process parameter optimization of dissimilar pipe
joints using GTAW”, International
Journal of Engineering Research and Applications. Vol. 2, No. 3, pp. 2525-2530, (2012).
[8] A. Hakan, A. Bayram, E. Ugur, Y. Kazancoglu, G. Onur, “Application of Grey relational analysis and Taguchi method for the parametric optimization of friction stir welding process”, Materials and Technology. Vol. 44, No. 4, pp. 205-211, (2010).
[9] S. K Sharma, Saadat Ali Rizvi, and R. P, Kori, “Optimization of Process Parameters in Turning of AISI 8620 Steel Using Taguchi and Grey Taguchi Analysis”, International Journal of Engineering Research and Applications, Vol. 4, No. 3, Version 6, pp. 51-57,(2014).
[10] Nabendu Ghosh, Pradip Kumar Pal,
Goutam Nandi, “Parametric
Optimization of MIG Welding on 316L Austenitic Stainless Steel by Grey-Based
Taguchi Method”, Procedia
Technology, Vol. 25, pp. 1038-1048, (2016).
[11] S. Datta, A. Bandyopadhyay, P. K. Pal, “Grey-based Taguchi method for optimization of bead geometry in submerged arc bead on-plate welding”. International Journal of Advanced Manufacturing Technology, Vol. 39, No. 11-12, pp. 1136-1143, (2008).
[12] P. Sathiya, S. Aravindan, R. Jeyapaul P.M. Ajith, and A. Noorul Haq,
“Optimizing the weld bead
characteristics of super austenitic stainless steel (904L) through grey-based
Taguchi method”, Multidiscipline
Modeling in Materials and Structures, Vol. 6, No. 2, pp. 206 - 213, (2010).
[13] Saadat Ali Rizvi, SP Tewari, Wajahat Ali, Application of Taguchi Technique to Optimize the process parameters of MIG wedging on IS 2062 steel, International Journal on Emerging Trends in Mechanical & Production Engineering, Vol. 2, No. 2,pp. 1-11, ( 2016).
[14] S. Khalilpourazary, P. M. Kashtiban and N. Payam, Optimizing turning operation of St37 steel using grey relational Analysis, Journal of Computational and Applied Research in Mechanical Engineering, Vol. 3, No. 2, pp. 134-144, (2014).
[15] ASTM E8/E8M − 11. Standard Test Methods for Tension Testing of Metallic Materials. ASM International; (2013). [16] R. Ramanujam, N. Muthukrishnan and
R. Raju, ”Optimization of cutting parameters for turning Al–SiC(10p) MMC using ANOVA and Grey
relational analysis” International
Journal of Precision Engineering and Manufacturing, Vol. 12, No. 4, pp. 651-656, (2011).
[17] S. Ranganathan and T. Senthilvelan,
“Multi-response optimization of
machining parameters in hot turning using Grey analysis”. International Journal of Advanced Manufacturing Technology, Vol. 56, No. 5, pp. 455-462, (2011).
[18] R. Vinayagamoorthy and A. M. Xavior, “Parametric optimization on multi-objective precision turning using Grey
relational analysis”. Procedia
Engineering. Vol. 97, pp. 299-307, (2014).
[19] B. M. Gopalsamy, B. Mondal, and S. Ghosh, “Optimization of machining parameters for hard machining: Grey relational theory approach and ANOVA” International. Journal of Advanced Manufacturing Technology, Vol. 45, pp. 1068-1086, (2009).
198
[21] K. R. Sivaraos, Milkey, A. R. Samsudin, A. K. Dubey, P. Kidd, “Comparison between Taguchi Method and Response Surface Methodology (RSM) in Modeling CO
2 Laser Machining” Jordan
Journal of Mechanical and Industrial Engineering, Vol. 8, No. 1, pp. 35-42, (2014).
[22] J. Deng, The essential methods of grey
systems, (Huazhong University Press, Wuhan) (1992).
[23] Saadat Ali Rizvi, SP Tewari, “Multi Objective Optimization by Application of Taguchi Based Grey Relational Analysis for GMA Welding of IS2062 Structural Steel”, Mechanics and Mechanical Engineering, Vol. 21, No. 3, pp. 717–729,(2017).
How to cite this paper:
Saadat Ali Rizvi and S. P. Tewari ,“ Optimization of Gas Metal ArcWelding Parameters of SS304 Austenitic Steel by Taguchi –Grey Relational Analysis”,
Journal of Computational and Applied Research in Mechanical Engineering, Vol. 7. No. 2, pp. 189-198
DOI: 10.22061/jcarme.2017.2215.1207