OPTIMIZING BIO-COAGULANTS FOR BREWERY WASTEWATER TREATMENT
USING RESPONSE SURFACE METHODOLOGY
B. I. Okolo
1,*P. C. Nnaji
2, E. O. Oke
3, K. F. Adekunle
4, C. S. Ume
5and O. D. Onukwuli
61,2,3,4
DEPARTMENT OF CHEMICAL ENGINEERING, MICHAEL OKPARA UNIVERSITY, UMUDIKE, ABIA STATE, NIGERIA
5
DEPARTMENT OF CHEMICAL ENGINEERING, FEDERAL UNIVERSITY NDUFU-ALIKEIKWO, EBONYI STATE. NIGERIA
6
DEPARTMENT OF CHEMICAL ENGINEERING, NNAMDI AZIKIWE UNIVERSITY, AWKA, ANAMBRA STATE, NIGERIA
Email addresses: 1[email protected], 2[email protected], 3[email protected],
4 [email protected], 5 [email protected], 6 [email protected]
ABSTRACT
Coag-flocculation process was used to treat brewery effluent stream with Detarium Microcarpum seed powder (DMSP) and oyster dried shell powder (ODSP) as coagulants. The proximate analyses of the coagulants were obtained using AOAC standard method. Percentage moisture, ash, fat, crude protein, crude fiber and carbohydrate content were determined for both coagulants. Jar test experiments were employed for the coag-flocculation process and response surface methodology (RSM) optimize the process. A box-Behnken design (BBD) of Design Expert 6.0.8, implementing RSM was used to evaluate the effects and interactions of three factors: coagulant dosage, pH and stirring time on the treatment efficiency. The optimal conditions obtained were coagulant dosage of 100.53mg/L, pH of 2.001 and stirring time of 24.47mins with 90.44% solid particle (SP) removal (desirability value of 1.0) and coagulant dosage of 104.19mg/L, pH of 3.34 and stirring time of 27.54 with 96.55% SP removal (desirability value of 1.0) for DMSP and ODSP, respectively. These agree reasonably with the experimental optimum for both coagulants. A determination
coefficient, R2, of 97 and 98%; F-value of 45.8056 and 55.3045; and prob.-value of 1.92E-07 and 2.39E-07 for DMSP
and ODSP respectively were used to evaluate the model adequacy.RSM has been demonstrated to be appropriate approach for the optimization of this process.
Keywords: Coag-flocculation, Detarium Microcarpum, oyster shell, optimization, response surface methodology
1. INTRODUCTION
The continuous industrial development in Nigeria has resulted in the generation of industrial wastewaters with chemical complexes and particulate components in effluent streams. These increasing trend and subsequent discharge of this effluent stream into our waters and water ways make the treatment of polluted water more difficult heretofore. These pollutants including solid particles are also generated by other human activities, climate change and other sources of pollution, apart from industrial wastewaters and are discharged into the environment. Particulate matter in water is attributed to suspended and colloidal matters such as clay, silts, finely divided organic and inorganic matter, plankton and other microorganism [1, 2, 3]. Coag-flocculation process has been successfully applied in the removal of these solid particles as well as some metals from industrial wastewater. This is achieved by the addition of coagulants to wastewater which causes destabilization of the colloidal dispersed particles and
subsequently agglomeration of the resulting individual colloidal particle [1, 4, 5].
Coag-flocculation process using inorganic coagulants like aluminum sulphate (alum) and ferric chloride has been well documented and the potentials of the use of natural organic derivatives like Detarium microcarpum seed powder (DMSP) and oyster dried shell powder (ODSP) has been established [1, 6]. The search for better alternative to conventional coagulants such as those of biological origin has become extremely vital, considering their environmental friendliness. These natural organic derivatives are non-toxic and biodegradable making their application to wastewater treatment a desirable possibility [1, 7, 8]. Okolo, et al [1, 9] reported the potential of Detarium microcarpum as an effective bio-coagulant for removal of turbidity from brewery effluent. It was observed that 96.07% suspended particle at optimum pH, dosage and settling time of 4.0, 100mg/L and 10 mins was removed using DMSP. Also, Ani et al [6] reported the performance of
Vol. 36, No. 4, October 2017, pp. 1104 – 1113 Copyright© Faculty of Engineering, University of Nigeria, Nsukka,
Print ISSN: 0331-8443, Electronic ISSN: 2467-8821
www.nijotech.com
Deterium microcarpum as bio-coagulant in the removal of turbidity from fibre cement effluent. It was observed that the varying dosage of the DM had no significant difference on the coag-flocculation performance at the same effluent (FCE) pH condition, but varying the pH conditions of FCE had significant difference on the coag-flocculation performance of DM.
Among other factors, temperature and retention time, effluent pH, effluent quality, concentration and type of coagulant, mixing speed and time influence the efficiency of coag-flocculation process [1, 10].The optimization of these factors may significantly increase the process efficiency. It is well established that the choice of coagulants, dosage and operational pH applied to a coag-flocculation process makes a significant contribution to the operational cost of the treatment plant [11]. Therefore, it is important to use the optimum conditions when carrying out coag-flocculation process so that wastage or unnecessary dosage of the associated chemicals may be prevented [12].
In conventional multifactor experiments, optimization is usually carried out by varying a single factor while keeping all other factors fixed at a specific set of conditions. It is not only time consuming, but also usually incapable of reaching the true optimum due to ignoring the interaction among variables [11]. To overcome this limitation the response surface methodology (RSM) has been proposed [13]. RSM comprises a body of methods exploring for optimum operating conditions through experimental methods. Typically, this involves doing several experiments using the results of one experiment to provide direction for what to do next. This next action could be to focus the experiment around a different set of conditions, or to collect more data in the current experimental region in order to fit a higher-order model or confirm what seem to have been found. This will determine the influences of individual factors and their interactions [14]. RSM an example of the statistical design of experiments is a collection of mathematical and statistical techniques that are useful for modeling and analyzing problems in which responses (or a response) of interest are influenced by several factors or variables with the objectives of optimizing the response(s). With RSM, the interaction between factors and responses can also be determined [12].
Montgomery [15] reported the effectiveness of BBD under RSM. However, it pointed out that BBD should not be used if combinations of extreme levels of the factors are of interest. Also, V. K. Sangal et, al [16] reported BBD under RSM as an easy and efficient optimization procedure. It further observed that the
optimal conditions using BBD were obtained with minimal simulation runs.
In this present work, the RSM was employed in designing the coag-flocculation experiments to optimize the process variables using Detarium Microcarpum seed powder (DMSP) and Oyster dried shell powder (ODSP) as coagulants for the treatment of brewery effluent streams. The paper therefore demonstrates the effect of optimum coagulant dosage, effluent pH and stirring time variation and their interaction on the coag-flocculation performance of DMSP and ODSP and further identifies the dominance and adequacy of the variables using statistical data [1].
2. MATERIALS AND METHODS
2.1 Collection and Methods of Analyses of Brewery Effluent Stream
The brewery effluent sample was collected from a brewery plant located in Enugu, Nigeria. The characterization and analyses of the effluent presented in Table 2 was determined at the National Regional Water Laboratory and Enugu State Water Corporation Laboratory both in Enugu, Nigeria using AWWA analytical methods. The pH, electrical conductivity and turbidity were determined using Mettler Toledo Delta 320 pH Meter, EI Digital Conductivity Meter (model number 161) and EI Digital Turbidity Meter (model no. 337), respectively.
2.2 Preparation of Coagulants Stock Solutions
2.2.1 Preparation of Detarium microcarpum Seed Powder and Oyster Dried Shell Powder
oyster dried shell coagulant (ODSC) using standard methods reported by Fernandez - Kim [18].
The conventional jar test procedure [19] was employed using 2 min of rapid mixing at 300rpm, followed by 5 - 30 min of slow mixing at 50rpm. The variables studied were coagulant dosage (X1), effluent pH (X2), and
stirring time (X3). The volume of wastewater used
throughout the study was 300mL. The solution was poured into 500mL cylinder after stirring and allowed to settle for 30 min. 20mL of the supernatant was pipetted to 2cm depth at 5 min intervals. The turbidity of the supernatants was measured and recorded. Turbidity (NTU) was converted to solid particles (SP), mg/L, using Equation (1), while the solid particle removal, SPR, was evaluated using Equation (2).
( ) ( ) ( ) Here T is Turbidity in NTU; (SPf) is the Conversion
factor to SSP = 2.35[1]
( ) SPR is the suspended solid particle removal in mg/L. No
is the Initial particle concentration and Nn is the
particle concentration at time, t. The range of the variables to be optimized was concentration of 100 to 500mg/L, effluent pH of 2 to 10 and stirring time of 5 – 30 mins. The range of values applies to both DMSP and ODSP. The variation of pH of the brewery effluent between 2 and 10 was achieved using sulphuric acid and sodium hydroxide.
A three-factor Box-Behnken Design (BBD) implementing RSM using Design Expert 6.0.8 portable was employed in designing the RSM jar test. Box-Behnken Design (BBD) is a design for quantitative factors with all factors in 3 levels. This design have each numeric factors been varied over 3 levels. BBD have fewer runs than 3 level factorials [20].A total of 27 runs were required for the experiment. This approach is to fit a quadratic polynomial model using equation (3).
∑
∑
∑ ∑ ( )
Where y is the response variable to be modeled; Xi, and
Xj are the independent variables which influence y, bo,
bi, bii and bij are the offset terms, the ith linear
coefficient, the quadratic coefficient and the ijth interaction coefficient, respectively.
Table 1: Experimental range and levels of BBD
Variables Range/ Level
-1 0 1
X1, Coagulant dose (mg/L) 100 300 500
X2, pH 2 6 10
X3, Stirring time (min) 5 15 30
3. RESULTS AND DISCUSSION
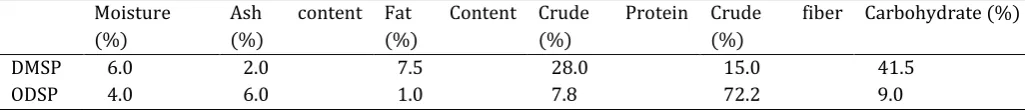
Tables 2 and 3 are the characterization results of both the brewery effluent and coagulant used. It was observed that brewery effluent has high level of BOD and the turbidity is high. This agrees reasonably with previously published work [1]. The high level of protein observed in DMSP and fibre in ODSP were in agreement with the previous reported works [1, 3, 6].
3.1 Statistical and optimization results of coag-flocculation using RSM.
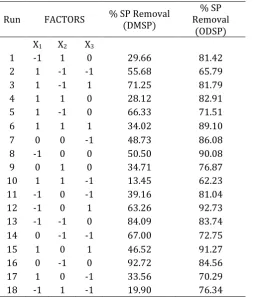
An effective system for any process can be established only after optimization of its process parameters. Response surface methodology (RSM) was used to optimize the parameter for solid particle removal in BRE using DMC and ODC. The range and level of factors used are presented in Table 1. A total of twenty-seven experiment was carried out and their results are presented in Tables 4.
3.2 Validation of the Model
The models obtained in this study were tested statistically using analysis of variance (ANOVA). Table 5 shows the ANOVA results for SP removal efficiency.
Table 2: Characterization of Brewery Effluent
Ph T(NTU) E.C TH Fe SO42- NO3- Cl- TSS BOD Temp
7.68 316.63 5290.0 41.0 0.178 46.224 0.136 80.826 30.406 640.0 27
T: turbidity; TH: total hardness (mg/LCaCo3); EC: electrical conductivity; BOD: biological oxygen demand, * Temp in oC, other parameters in mg/L
Table 3: Characterization of DetariumMicrocarpum Seed Powder (DMSP) and Oyster dried shell powder (ODSP)
Moisture (%)
Ash content (%)
Fat Content (%)
Crude Protein (%)
Crude fiber (%)
Carbohydrate (%)
DMSP 6.0 2.0 7.5 28.0 15.0 41.5
Table 4: BBD Results for SP removal using DMSP and ODSP
Run FACTORS % SP Removal (DMSP)
% SP Removal
(ODSP) X1 X2 X3
1 -1 1 0 29.66 81.42
2 1 -1 -1 55.68 65.79
3 1 -1 1 71.25 81.79
4 1 1 0 28.12 82.91
5 1 -1 0 66.33 71.51
6 1 1 1 34.02 89.10
7 0 0 -1 48.73 86.08
8 -1 0 0 50.50 90.08
9 0 1 0 34.71 76.87
10 1 1 -1 13.45 62.23
11 -1 0 -1 39.16 81.04
12 -1 0 1 63.26 92.73
13 -1 -1 0 84.09 83.74
14 0 -1 -1 67.00 72.75
15 1 0 1 46.52 91.27
16 0 -1 0 92.72 84.56
17 1 0 -1 33.56 70.29
18 -1 1 -1 19.90 76.34
Run FACTORS % SP Removal (DMSP)
% SP Removal
(ODSP)
19 -1 1 1 33.80 84.32
20 -1 -1 -1 74.33 69.23
21 -1 -1 1 90.42 88.02
22 0 0 1 61.24 91.02
23 1 0 0 42.40 82.66
24 0 -1 1 86.63 88.76
25 0 1 1 41.44 82.66
26 0 1 -1 23.41 71.95
27 0 0 0 58.18 83.22
The results of response (SP removal efficiency), was correlated with three factors (coagulant dosage, effluent pH and stirring time) using the second order polynomial. From the experimental data (Table 4), the following quadratic models were obtained for SP removal efficiency. The response variables represented as Y(SP removal efficiency), were obtained through experiment using BBD. Upon statistical analysis using the experimentally generated response on BBD implementing RSM the following equations were generated as shown in equations 4 and 5.
( )
( )
Where =Coagulant dosage, = pH, = stirring time respectively. The coefficient in front of cd, pH and s.t, represent the linear coefficient while coefficient in front of represent the interaction between factors and and 2 represent the quadratic effect respectively.
Table 5: ANOVA results for the study
(a)
Source DMSP ODSP
F-value Prob. Value F-value Prob. value
Model 34.7208 7.92E-9 55.3049 2.39E-7
X1 0.2775 0.6056 70.7914 7.55E-6
X2 186.4462 3.100E-10 7.7456 0.0194
X3 97.0334 3.39E-8 312.575 7.14E-9
X1X2 4.8537 0.0426 42.0128 7.06E-5
X1X3 0.0047 0.9461 6.1461 0.0326
X2X3 2.8273 0.1121 2.6741 0.1330
X12 0.7382 0.4029 0.7382 0.4029
X22 13.6381 0.0020 13.6381 0.0020
X32 3.1237 0.0962 3.1237 0.0962
(b)
Response R2 R2
adj AP SD CV PRESS
SP removal DMSP 0.9740 0.9528 23.4595 4.3754 7.8567 800.80
ODSP 0.9803 0.9626 28.0797 1.4113 1.7194 77.7508
The quadratic regression for SP removal efficiency show that the models were significant since the F-value of 34.7208 of variance and 55.305 for DMC and ODC, respectively, are high. In addition, P-value for the quadratic regression model is less than 0.05, indicating that the models were statistically significant.
From Table 5, pH has the highest F-value of 186.446 and the lowest p-value of 3.39E-10 for DMC, meaning that the pH has largest effect on the SP removal, and this was followed by stirring time and then, coagulant dosage. Coagulant dosage and stirring time has better interaction with p-value of 0.9461[18]. Similarly, stirring time has the highest F-value of 312.57 and the lowest p-value of 7.14E-9 for ODC meaning that the stirring time has largest effect on the SP removal, followed by coagulant dosage and pH while coagulant dosage and pH has the best interaction with p-value of 42.012. The p-value provides an indication of the significance of a model in relation with the F-value. If the p-value for the model is less than 0.05, the model is said to be statistically significant for a 95% confidence level, meaning that there is only 5% chance that the F-value is due to noise. If the p-F-value is above 0.1, the model is insignificant [15, 21].
The coefficients of determination (R2) of the model
were 0.9746 and 0.9803 for DMC and ODC respectively. These indicated a good fit between predicted values and experimental data points. In addition, it implies that 97.46%and 98.03% of the variations for SP removal is explained by the independent variables, and this also means that the models do not explain about 2.54% and 1.97% of variations, for DMSP and ODSP respectively. In this study, the predicted (R2) for both
DMSP and OYSP reasonably agree with the adjusted R2.
High value (closer to 1) demonstrates good accordance between the calculated and observed results. Also, it can be seen from the results that the experiments show a desirable and reasonable agreement with the closeness of adjusted [22]. The coefficient of determination indicates that there is high dependence and correlation between the observed and predicated values of the response [23]. Correlation coefficient needs to be at a minimum of 0.80 for a good fit of model [22].
The range in predicted response relative to its associated error can be measured by adequate precision. The Adequate Precision (AP) ratio should be higher than 4 for the predicted model to be used to navigate the space. For this study, AP for the model is 23.4595 and 28.0797 for DMSP and ODSP, respectively, which is an adequate signal for the model. It also suggested that the data obtained through predicted quadratic model is reliable, and can be used to navigate
the design space [24]. The coefficient of variation (CV) and standard deviation (SD) indicates the degree of precision. Low values of CV and SD show the adequacy with which the experiment was conducted. In this study, CV values are 7.8567 and 1.719 while SD values are 4.3754 for DMSP and ODSP, respectively.
Based on the analysis of variance (ANOVA) among the independent variables for SP removal in BRE using DMSP and ODSP as coagulant shown in Table 5 and Equations4-5, it can be seen that the removal of SP is affected by coagulant dosage more for DMSP and stirring time for ODSP. This is due to the coefficient of coagulant dosage and stirring time in Equations. 4 and 5 having positive signs, showing that the SP removal increases when the sample dosage increase for DMSP and when left to stir for longer time for ODSP. A positive value represents an effect that favors the optimization, while a negative value indicates an inverse relationship between the factors and the response [25]. For DMSP and ODSP in BRE, significant effect were obtained for linear terms of coagulant dosage ( ), pH ( ) and stirring time ( ) while the interaction effect is on and . The quadratic terms also indicates the presence of curvatures. This means that removal of SP increases for both DMSP and OYSP with increase in coagulant dosage; pH and stirring time up to maximum values beyond which the efficiencies decrease which further increase the three variables.
3.3 Test for Significant of Regression
A good estimated regression model explains the variation of the dependent variable in the sample. If the points of the residual plot approximate a straight line, then the normality assumption is satisfied. Normality indicates whether or not a set of data is normally distributed by plotting the data against the theoretical normal distribution in order to form an approximate straight line [15].
the data point are distributed randomly on the 45 degree line, indicating that the model provides an acceptable fit for the experimental data. The data also indicate an adequate agreement between experimental data and the output from the model [12].
Figures 2 and 3 show the 3-D surface and 2-D contour plots, respectively. The response surface and contour plots are the graphical representative of the model used to visualize the relationship between the response and experimental data. The curvilinear profile of the 3D
plots in Figures 2 and 3 are in accordance with the quadratic models. The corresponding contour lines showed considerable curvature, indicating strong interactions between the independent variables – coagulant dosage, effluent pH and stirring time in removing suspended particles [2]. The highest percentage SP removal of 92.72% and 92.73% for DMSP and ODSP respectively were recorded after 30 mins settling time.
(a)
(b)
Figure 1: Normalization plots: Normal plot of residual, residual vs runs and predicted vs actual (a) DMSP and (b) ODSP
Design-Expert® Software % Removal Color points by value of % Removal:
90.4305
19.9065
Externally Studentized Residuals
N o r m a l % P r o b a b il it y
Normal Plot of Residuals
-2.00 -1.00 0.00 1.00 2.00 3.00 1 5 10 20 30 50 70 80 90 95 99 Design-Expert® Software % Removal Color points by value of % Removal: 90.4305 19.9065 Run Number E x te r n a ll y S tu d e n ti z e d R e s id u a ls
Residuals vs. Run
-4.00 -2.00 0.00 2.00 4.00
1 6 11 16 21 26 Design-Expert® Software % Removal Color points by value of % Removal: 90.4305 19.9065 Actual P r e d ic te d
Predicted vs. Actual
0 20 40 60 80 100
0 20 40 60 80 100
Design-Expert® Software % Removal Color points by value of % Removal:
92.747
65.8029
Externally Studentized Residuals
N o r m a l % P r o b a b il it y
Normal Plot of Residuals
-2.00 -1.00 0.00 1.00 2.00 3.00 1 5 10 20 30 50 70 80 90 95 99 Design-Expert® Software % Removal Color points by value of % Removal: 92.747 65.8029 Run Number E x te r n a ll y S tu d e n ti z e d R e s id u a ls
Residuals vs. Run
-6.00 -4.00 -2.00 0.00 2.00 4.00 6.00
1 6 11 16 21 26
Design-Expert® Software % Removal Color points by value of % Removal: 92.747 65.8029 Actual P r e d ic te d
Predicted vs. Actual
65 70 75 80 85 90 95
65 70 75 80 85 90 95
Design-Expert® Software Factor Coding: Actual % Removal
90.4305
19.9065
X1 = A: Coagulant Dosage X2 = B: PH Actual Factor C: Time = 16.50
2.00 4.00 6.00 8.00 10.00 100.00 180.00 260.00 340.00 420.00 500.00 0 20 40 60 80 100 % R e m o v a l
A: Coagulant Dosage B: PH
Design-Expert® Software Factor Coding: Actual % Removal
90.4305
19.9065
X1 = A: Coagulant Dosage X2 = B: PH
Actual Factor C: Time = 16.50
100.00 180.00 260.00 340.00 420.00 500.00 2.00
4.00 6.00 8.00
10.00 % Removal
A: Coagulant Dosage
Figure2: Response surface and contour plots for the effect of dosage, settling time and pH for solid particle removal in BRE using DMSC.
Design-Expert® Software Factor Coding: Actual % Removal
Design points above predicted value
Design points below predicted value
90.4305
19.9065
X1 = A: Coagulant Dosage X2 = C: Time Actual Factor B: PH = 6.00
3.00 6.00 9.00 12.00 15.00 18.00 21.00 24.00 27.00 30.00 100.00 180.00 260.00 340.00 420.00 500.00 0 20 40 60 80 100 % R e m o v a l
A: Coagulant Dosage C: Time
Design-Expert® Software Factor Coding: Actual % Removal
Design Points
90.4305
19.9065
X1 = A: Coagulant Dosage X2 = C: Time Actual Factor B: PH = 6.00
100.00 180.00 260.00 340.00 420.00 500.00 3.00 6.00 9.00 12.00 15.00 18.00 21.00 24.00 27.00
30.00 % Removal
A: Coagulant Dosage
C : T im e 40 50 60 45.3283 45.3283 55.8199 58.7012 52.907 Design-Expert® Software Factor Coding: Actual % Removal
Design points above predicted value
Design points below predicted value 90.4305
19.9065
X1 = B: PH X2 = C: Time Actual Factor A: Coagulate Dosage = 300.00
3.00 6.00 9.00 12.00 15.00 18.00 21.00 24.00 27.00 30.00 2.00 4.00 6.00 8.00 10.00 0 20 40 60 80 100 % R e m o v a l B: PH C: Time Design-Expert® Software Factor Coding: Actual % Removal
Design Points
90.4305
19.9065
X1 = B: PH X2 = C: Time Actual Factor A: Coagulate Dosage = 300.00
2.00 4.00 6.00 8.00 10.00
3.00 6.00 9.00 12.00 15.00 18.00 21.00 24.00 27.00
30.00 % Removal
B: PH C : T im e 40 50 60 70 80 45.3283 54.9976 58.3152 52.7207 Design-Expert® Software Factor Coding: Actual % Removal
92.747
65.8029
X1 = A: Coagulant Dosage X2 = B: PH Actual Factor C: Time = 16.50
2.00 4.00 6.00 8.00 10.00 100.00 180.00 260.00 340.00 420.00 500.00 65 70 75 80 85 90 95 % R e m o v a l
A: Coagulant Dosage B: PH
Design-Expert® Software Factor Coding: Actual % Removal
92.747
65.8029
X1 = A: Coagulant Dosage X2 = B: PH Actual Factor C: Time = 16.50
100.00 180.00 260.00 340.00 420.00 500.00 2.00 4.00 6.00 8.00 10.00 % Removal
A: Coagulant Dosage
B : P H 80 85 90 83.9481 87.2605 83.2464 83.2464 Design-Expert® Software Factor Coding: Actual % Removal
Design points above predicted value
Design points below predicted value
92.747
65.8029
X1 = A: Coagulant Dosage X2 = C: Time Actual Factor B: PH = 6.00
3.00 6.00 9.00 12.00 15.00 18.00 21.00 24.00 27.00 30.00 100.00 180.00 260.00 340.00 420.00 500.00 65 70 75 80 85 90 95 % R e m o v a l
A: Coagulant Dosage C: Time
Design-Expert® Software Factor Coding: Actual % Removal
Design Points
92.747
65.8029
X1 = A: Coagulant Dosage X2 = C: Time Actual Factor B: PH = 6.00
100.00 180.00 260.00 340.00 420.00 500.00 3.00 6.00 9.00 12.00 15.00 18.00 21.00 24.00 27.00
30.00 % Removal
A: Coagulant Dosage
Figure 3: Response surface and contour plots for the effect of dosage, settling time and pH for solid particle removal in BRE using ODSC
From the equation term, X1*X2 is the most significant
interaction for DMSC and ODSC respectively. This means that the removal of SP increases with coagulant loading depending on a particular pH range and stirring time. 90.0% maximum removal was achieved at 100mg/L and stirring time of 25min at pH 2[27]. As shown in these plots, increased SP removal was observed with increasing coagulant dosage and pH values. However, an increase in both factors beyond the optimum region results in a decrease in the removal efficiency for the two coagulants [28]. Coagulant dosage higher than 100mg/L, the SP removal begin to decrease in all coagulation pH, this implies re-stabilization of the particles due to overloading [27]. From the plots, low pH value indicates improved coagulation and SP removal. The model predicted a maximum of 90.0% SP removal with dosage of 100mg/L and pH 2.
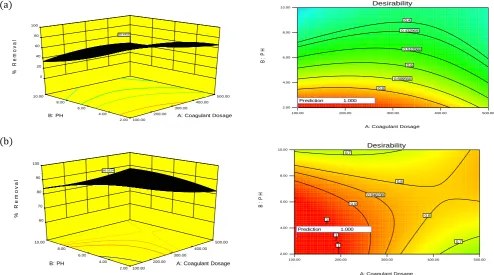
3.4 Optimization using the Desirability Functions The optimization process was done to find out the values of the optimal variables that would provide high removal efficiency of SP in BRE. The result of the optimization study has been illustrated in Figures 5 and 6 showing the surface, contour and ramp plot for
optimization of chosen factors within range and maximized response (SP removal).
A desirability function was used to explore the optimum conditions of three variables, which are coagulant dosage, pH and stirring time. In this study, the input variables were given specific ranged values, using the desirability function in the software under BBD to be optimized in order to maximize the response (SP removal) (Figure. 5).Using these conditions, the maximum achieved SP removal was 90.44% at pH of2.001, dosage of 100. 53mg,and stirring time of 24.47minswith desirability of 1.00for DMSP and 96.55% SP removal was attained at pH of3.34, dosage of104.19,and stirring time of 27.54minswith desirability 1.00 for ODSP.
4. CONCLUSION
Coag-flocculation process is common and necessary in brewery industrial effluent treatment. The characterization of DMSP and ODSP revealed the presence of reasonable percentage of protein and carbohydrate (28% and 41.5%) for DMSP and fiber (72.2%) for ODSP which are polymeric compounds in nature and thus, precursors for coagulation and flocculation process.
Design-Expert® Software Factor Coding: Actual % Removal
Design points above predicted value
Design points below predicted value
92.747
65.8029
X1 = A: Coagulant Dosage X2 = C: Time Actual Factor B: PH = 6.00
3.00 6.00 9.00 12.00 15.00 18.00 21.00 24.00 27.00 30.00
100.00 180.00
260.00 340.00
420.00 500.00 65
70 75 80 85 90 95
%
R
e
m
o
v
a
l
A: Coagulant Dosage C: Time
Design-Expert® Software Factor Coding: Actual % Removal
Design Points
92.747
65.8029
X1 = A: Coagulant Dosage X2 = C: Time Actual Factor B: PH = 6.00
100.00 180.00 260.00 340.00 420.00 500.00 3.00
6.00 9.00 12.00 15.00 18.00 21.00 24.00 27.00
30.00 % Removal
A: Coagulant Dosage
C
:
T
im
e
80 85 90
83.9481 87.2605
83.2464
75.7021 88.5925
Design-Expert® Software Factor Coding: Actual % Removal
Design points above predicted value Design points below predicted value
92.747
65.8029
X1 = B: PH X2 = C: Time
Actual Factor A: Coagulant Dosage = 300.00
3.00 6.00 9.00 12.00 15.00 18.00 21.00 24.00 27.00 30.00
2.00 4.00
6.00 8.00
10.00 65
70 75 80 85 90 95
%
R
e
m
o
v
a
l
B: PH C: Time
Design-Expert® Software Factor Coding: Actual % Removal
Design Points
92.747
65.8029
X1 = B: PH X2 = C: Time
Actual Factor A: Coagulant Dosage = 300.00
2.00 4.00 6.00 8.00 10.00
3.00 6.00 9.00 12.00 15.00 18.00 21.00 24.00 27.00
30.00 % Removal
B: PH
C
:
T
im
e
80 85
83.9481 87.2605
83.2464
(a)
(b)
Figure 4: Desirability fitted 3D surface and contour plots for optimization of pH and coagulant dosage for solid particle removal in BRE using (a) DMSC and (b) ODSC.
(a) (b)
Figure 5: Desirability ramp of optimized solid particle removal for (a) DMSP and (b) ODSP in BRE
This work has demonstrated the application of RSM in obtaining optimal conditions for this process with respect to solid particle removal. RSM using BBD was applied to evaluate effects of coagulant dosage, effluent pH and stirring time on the coag-flocculation effectiveness, and then determine the optimum conditions. The results showed that the three factors considered in this study played role on the removal of SP. The optimum conditions obtained for coagulant dosage, effluent pH and stirring time were 100mg/L, 2.0 and 25min for DMSP and 100mg/L, 4.0 and 30mins for ODSP. Under these optimal conditions, about
90.42% and 92.73% SP removal for DMSP and ODSP respectively were obtained. This demonstrates that RSM can be successfully applied for modeling and optimizing the coag-flocculation process and it is the economical way of obtaining the maximum dosage information in a short period of time and with the least number of experiments.
5. REFERENCES
[1] B. I Okolo, P. C. Nnaji, O. D Onukwuli, Nephelometric approach to study coagulation–flocculation of brewery effluent medium using Detarium microcarpum seed Design-Expert® Software
Factor Coding: Actual % Removal
90.4305
19.9065
X1 = A: Coagulant Dosage X2 = B: PH Actual Factor C: Time = 24.48
2.00 4.00 6.00 8.00 10.00
100.00 200.00
300.00 400.00
500.00 0
20 40 60 80 100
%
R
e
m
o
v
a
l
A: Coagulant Dosage B: PH
90.4456 90.4456
Design-Expert® Software Factor Coding: Actual Desirability
1.000
0.000
X1 = A: Coagulant Dosage X2 = B: PH Actual Factor C: Time = 24.48
100.00 200.00 300.00 400.00 500.00 2.00
4.00 6.00 8.00
10.00 Desirability
A: Coagulant Dosage
B
:
P
H
0.4
0.6
0.8
0.432969
0.510068
0.699556
Prediction 1.000
Design-Expert® Software Factor Coding: Actual % Removal
92.747
65.8029
X1 = A: Coagulant Dosage X2 = B: PH Actual Factor C: Time = 27.54
2.00 4.00 6.00 8.00 10.00
100.00 200.00
300.00 400.00
500.00 60
70 80 90 100
%
R
e
m
o
v
a
l
A: Coagulant Dosage B: PH
96.5514 96.5514
Design-Expert® Software Factor Coding: Actual Desirability
1.000
0.000
X1 = A: Coagulant Dosage X2 = B: PH Actual Factor C: Time = 27.54
100.00 200.00 300.00 400.00 500.00 2.00
4.00 6.00 8.00
10.00 Desirability
A: Coagulant Dosage
B
:
P
H
0.7 0.7
0.8 0.8
0.9
1 1 1 1
0.846238
Prediction 1.000
A:Coagulant Dosage = 100.53
100.00 500.00
B:PH = 2.00
2.00 10.00
C:Time = 24.48
3.00 30.00
% Removal = 90.4456
19.9065 90.4305
Desirability = 1.000
A:Coagulant Dosage = 100.53 100.00 500.00
B:PH = 2.00 2.00 10.00
C:Time = 24.48 3.00 30.00
% Removal = 90.4456 19.9065 90.4305
powder by response surface methodology, Journal of Environmental Chemical Engineering 4, 992–1001, 2016.
[2] R.C. Jagessar, L. Sooknundun, Determination of nitrate anion in waste water from nine selected areas of coastal guyana via a spectrophotometric method, IJRRAS 7 (2), 203–212. 2011.
[3] C. Nnaji Patrick, I. Okolo Bernard, M. Matthew Chukwudi, Ume Cyril Sunday, Chizoba Chinelo Agu, Kinetics and particle removal profile of pulverized snail shell—alum induced coag–flocculation of quarry effluent, Br. J. Appl. Sci. Technol. 5 (6), , 621–632, 2015.
[4] M. Piero, N. J. I. T. Armenante, Coagulation and
Flocculation Method1999,
http://cpe.njit.edu/dlnotes/che685/cls07-1.pdf.
[5] L. Ravina, Everything You Want to Know about Coagulation and Flocculation, 4th edition, Zeta-Meter Inc., Staunton, 1973.
[6] J. U. Ani, N. J. N. Nnaji, O. D. Onukwuli, C. O. B. Okoye, Nephelometric and functional parameters response of coagulation for the purification of industrial wastewater using Detariummicrocarpum, J. Hazard. Mater. 243, 59–66. 2012,
[7] P.W. Atkins, Physical Chemistry, 6th edition, Oxford University Press Oxford, 1998.
[8] R. Srinivasan, Simple, Efficient and Eco-Friendly Solution for Water and Wastewater Treatment, Black land Research Center, Texas Agrilife Research, Texas A&M University, Temple, Texas, 2013.
[9] Bernard IbezimOkolo, Patrick ChukwudiNnaji, Matthew Chukwudi Menkiti, Victor Ifeanyi Ugonabo, Okechukwu Dominic Onukwuli, Application of Single Angle Turbidimetry on Coag-Flocculation Effect of Detariummicrocarpum Seed in Brewery Effluent, Materials Sciences and Applications, 5, 2014, 416-429
[10] J.J. Ma, G.B. Li, G.R. Chen, G.O. Xu, G.Q. Cai, Enhanced coagulation of surface waters with high organic content by permanganate per oxidation, Water Sci. Technol.: Water Supply 1, 2001, 51–61.
[11] Elibol, M., Response surface methodological approach for inclusion of per-fluorocarbon inactinorhodin fermentation medium. Process Biochemistry, 38, 2002, 667-673.
[12] M. Zainal-Abideen, A. Aris, F. Yusof, Z. Abdul-Majid, A. Selamat, Optimizing the coagulation process in a drinking water treatment plant – comparison between traditional and statistical experimental design jar tests, Water Science and Technology 65.3, 2012.
[13] Brasil, J. L., Martins, L.C., Ev, R.R., Dupont, J., Dias, S.L.P., Sales, J.A.A., Airoldi, C., Lima, E.C., Factorial design for optimization of flow injection pre-concentration procedure for copper (II) determination in natural waters, using 2-aminomethylpyridine grafted silica gel as adsorbent and spectrophotometric detection. International Journal of Environmental Analytical Chemistry, 15, 2005, 475-491.
[14] ImenFendri, Lamia Khannous, AsmaTimoumi, NejiGharsallah, RadhouaneGdoura, Optimization of coagulation–flocculation process for printing ink industrial wastewater treatment using response surface methodology, Afr. J. Biotechnol, 12 (30), 2013, 4819–4826.
[15] Montgomery, D. C., Design and analysis of experiments. 6th ed. Hoboken NJ: John Wiley & Sons. Inc., 2005.
[16] Vikas K. Sangal, Vineet Kumar, Indra Mani Mishrab, Optimization of structural and operational variables for the energy efficiency of a divided wall distillation column, Computers and Chemical Engineering 40, 2012, 33– 40
[17] AOAC, Official Method of Analysis 14th Edition,
Association of Official Analytical Chemist, Gaitherburg, 1993.
[18] Bas, D., Bayaci, I.H., Modeling and optimization I: Usability of response surface methodology. Journal of Food Engineering (78), 836-845. 2007.
[19] AWWA, Standard Methods for the Examination of Water and Wastewater Effluent, American Water Works Association, New York, 2012.
[20] Russell V. Lenth, Response-Surface Methods in R, Using rsm; Journal of Statistical Software, Volume 32, Issue 7, 2009, 1- 17
[21] Trinh, T. K., Kang, L. S., Response surface methodology approach to optimize the coagulation/flocculation process in drinking water treatment. Chem. Eng. Res. Design; 89, , 1126-1130, 2011.
[22] Abu, Amr, S. S. Aziz, H. A., Bashir, M. J. K., Application of surface response methodology (RSM) for optimization of semi-aerobic landfill leachate treatment using ozone. Appl. Water2014.
[23] Sharma, P., Singh, L., Dilbaghi, N., Optimization of process variables for decolorization of Disperse Yellow 211 by Bacillus subtiles using Box-Behnken design. J. Hazard. Mater. 164, 2009, 1024-1029.
[24] Kousha, M., Daneshvar, E., Dopeikar, H., Taghavi, D., Bhatnagar, A., Box-Behnken design optimization of Acid Black I dye bio-sorption by different brown macroalgae, Chem. Eng. J.179, 158-168, 2012.
[25] Mourabet, M., EL-Rhlassi, A., EL-Boujaady, H., Bannam-Ziatni, M., Taitai, A., Use of response surface methodology for optimization of fluoride adsorption in an aqueous solution by Brushite, Arabian Journal of Chemistry.
[26] Antony, J. Design of Experiments for Engineer and Scientists, Butter worth Heinemann, 2003.
[27] Yang, T., and Qiu, K., Preparation of activated carbons from walnut shells via vacuum chemical activation and their application for methylene blue removal. Chem. Eng. J. 165(1), 209-217, 2010.