http://ejplantbreeding.com
317
Genetic variability and character association for biometrical traits in
Blackgram (
Vigna mungo
(L.)
Hepper
)
P. Gowsalya, D. Kumaresan*, D. Packiaraj and J.R. KannanBapu,Department of Pulses
Centre for Plant Breeding and Genetics,
Tamil Nadu Agricultural University, Coimbatore 641 003
*e-mail: dkumaresan1@rediffmail.com
(Received: February 2016, Accepted: September 2016)
Abstract
In the present investigation, eleven quantitative characters were evaluated in eighty genotypes of blackgram during
Rabi 2014-15 seasons to assess the genetic variability and character association. The genotypes differed significantly for all the characters studied. The highest GCV recorded for number of branches per plant, seed yield per plant, number of clusters per plant, branch length, number of pods per plant and plant height. High heritability was recorded for branch length, number of branches, plant height, clusters per plant, seed yield per plant, number of pods per plant and pod length. The highest genetic advance as percent of mean was recorded for number of branches, seed yield per plant, cluster per plant, branch length, pods per plant and plant height. High heritability coupled with high genetic advance was observed for branch length, number of branches, plant height, clusters per plant, seed yield per plant and number of pods per plant. Seed yield per plant was positively and significantly correlated with pods per plant, clusters per plant, number of seeds per pod, plant height, branch length, 100 seed weight, number of branches and pod length at both phenotypic and genotypic level. The characters pods per plant, number of seeds per pod and 100 seed weight exerted high positive direct association with seed yield. Number of pods per plant showed highly positive indirect effect on seed yield via number of clusters per plant, number of branches, plant height and branch length. Hence, selection based on number of pods per plant, number of seeds per pod and hundred seed weight would result in improving the seed yield of blackgram.
Key words: Variability, heritability, genetic advance, correlation, blackgram
Introduction
Blackgram (Vigna mungo(L). Hepper, 2n=22), known as urdbean, is an important grain legumes for its nutritional quality and the suitability to cropping system.The major portion of blackgram is utilized in making dal, curries, soup, sweets and snacks. The food values of urdbean lie in its high and easily digestible protein. Its seeds contain approximately 25-28% protein, 1.0 -1.5% oil, 3.5 – 4.5% fiber, 4.5 – 5.5% ash and 62 – 65% carbohydrates on dry weight basis. Like other pulses, it also enriches the soil fertility, improves the soil structure and used as green fodder for cattle.Though, India is the world’s largest producer of blackgram, it imports a large amount to meet the growing domestic needs. But the productivity in India is low as compared with world’s average. Blackgram is grown in varying agro-ecological conditions and cropping systems with diverse cultural practices, so it needs appropriate plant type for each growing situation. The breeding progress has been slow and uneven because several desirable traits need to be combined for developing appropriate plant type for a particular growing region and cropping system. Development of high yielding varieties of crops requires information on nature and
magnitude of genetic variability present in the available population, which is a pre-requisite to adopt an effective breeding programme.
http://ejplantbreeding.com
318
determine the characteristics contributing to seedyield in blackgram
Materials and Methods
The experimental material comprised of 80 blackgram genotypes which were raised in a Randomized Block Design with three replications at New area of Millets Breeding Station, Department of Pulses, Centre for Plant Breeding and genetics, Tamil Nadu Agricultural University, Coimbatore during
Rabi 2014-15 season. In each replication, genotype was sown in a single row of four meter length with spacing of 30 x 10 cm. The package of practices recommended in the crop production guide was followed. Eleven quantitative traits viz., days to 50% flowering, days to maturity, plant height, number of branches, branch length, pod length, number of seeds per pod, number of pods per plant, number of clusters per plant, 100 seed weight and seed yield per plant were recorded for five randomly selected plants in each of the accessions per replication. The statistical analysis and variance due to different sources was worked out according to Panse and Sukhatme (1967). Phenotypic and genotypic coefficients of variation were calculated based on the method advocated by Burton (1952). Heritability and genetic advance as per cent of mean were estimated as per formula given by Johnson et al.
(1955).The phenotypic and genotypic correlation coefficients were calculated from phenotypic and genotypic variances and covariances and path coefficients analyses were worked out as suggested by Dewey and Lu (1959).
Results and Discussion
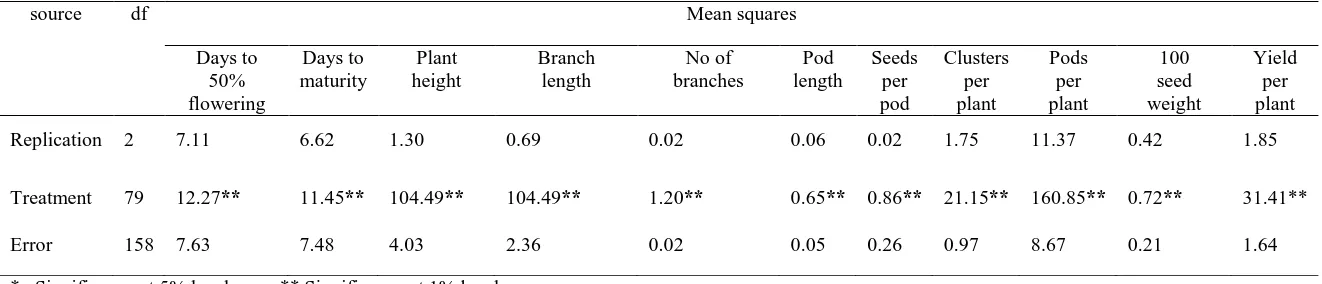
The analysis of variance was carried out for eleven quantitative characters and the results are presented in Table 1. The variance due to treatment was significant for all eleven characters studied. This gives the evidence of magnitude of variability among genotypes were differed significantly for all characters studied. The estimates of phenotypic coefficient of variation were higher than the corresponding genotypic coefficient of variation for all the characters which indicating that the environment factors influencing the characters studied (Table 2). This findings are in accordance with the study done by Umadevi and Ganesan (2005), Pervin et al., (2007), Sowmini and Jayamani (2013), Ramya et al., (2014) and Vinoth and Jayamani (2014). The highest PCV recorded for number of branches per plant (30.24) followed by seed yield per plant (27.04), clusters per plant (22.94), branch length (20.64) and pods per plant (20.59) suggesting that sufficient phenotypic variability was present for these traits. The results are in agreement with
findings of Vijaya Kumar et al. (2015) for number of branches per plant and seed yield per plant.The highest GCV recorded for number of branches per plant (29.18) followed by seed yield per plant (25.04) and number of clusters per plant (21.44), branch length (19.96), number of pods per plant (19.03) and plant height (16.90) indicating the presence of variation for these characters and improvement could be possible through selection of these characters. Similar results are reported by Vijaya Kumar et al. (2015), Panigrahi et al. (2014) for number of branches per plant, number of clusters per plant, number of pods per plant and yield per plant.
http://ejplantbreeding.com
319
length (16.70), 100 seed weight (10.26) and numberof seeds per pod (10.05). However, estimation of heritability along with genetic gain is more useful in predicting the resultant effect from selecting the best individual. In the present study, high heritability coupled with high genetic advance was observed for branch length, number of branches, plant height, clusters per plant, seed yield per plant and number of pods per plant. This indicates that most likely the heritability is due to additive gene effects and hence selection may be effective for these characters. It may be suggested that for additive effects pedigree or modified pedigree method of selection is followed.
The genotypic and phenotypic correlation coefficients among different characters of blackgram genotypes are presented in Table 3. In the present study, seed yield per plant was positively and significantly correlated with number of pods per plant, clusters per plant, number of seeds per pod, plant height, branch length, 100 seed weight, number of branches and pod length at both phenotypic and genotypic level. Similar results have been reported by Gupta et al.(2003) and Shivade et al.(2011). Positive association for pods per plant, seeds per pod and 100 seed weight was reported by Kingshlin and Vanniarajan (2000), Umadevi and Ganesan (2005), Konda et al. (2008). Hence, the seed yield can be improved if the characters namely number of pods per plant, clusters per plant; seeds per pod, plant height and 100 seed weight were given importance
during selection process. Days to 50% flowering and
days to maturity showed non-significant and positive correlation with seed yield.
Plant height exhibited high positive and significant association with 100 seed weight, clusters per plant, number of pods per plant, number of seeds per pod, pod length, number of branches and branch length. A strong positive and significant association exists between days to 50% flowering and days to maturity. A strong inter correlation was studied among clusters per plant with pods per plant, number of seeds per pod with clusters per plant and number of pods per plant. Hence, increasing the plant height would increases the number of branches and branch length which results in more number of clusters, pods and seeds per pod owing to strong positive and significant inter-correlation among them. Hence these characters can be improved through single selection programme.
Pod length showed negative correlation with days to 50% flowering, days to maturity and number of branches. Seeds per pod showed negative and non significant association with days to 50% flowering and days to maturity. Negative association among yield components may be due to negative linkages
and that needs to be broken through recombinant breeding.
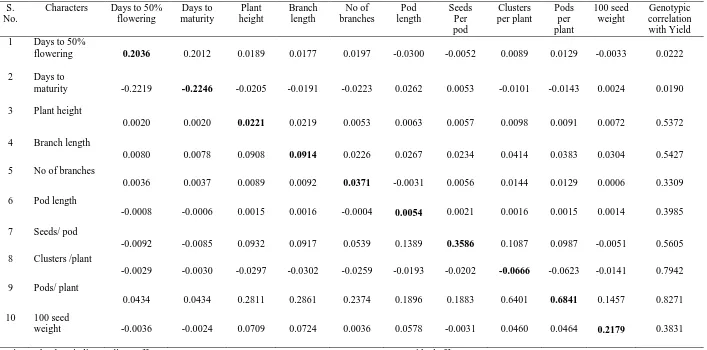
When more number of variables was considered in correlation, the association becomes more complex and does not have meaningful interpretation. Hence, genotypic correlation partitioned into direct and indirect effects to specify the cause and their relative importance (Table 4), the characters namely number of pods per plant, number of seeds per pod and 100 seed weight exerted high positive direct association with seed yield. Therefore selection on these characters will be useful in increasing the seed yield of blackgram. Similar results were reported by Chauhan et al. (2007) and Lal and Singh (2014). Days to maturity and number of cluster per plant exerted direct negative effect on seed yield. This result was similar with Panigrahi et al. (2014). The negative direct effect indicated that these characters had low association and selection based on these characters would not be effective. Number of pods per plant showed high positive indirect effect on seed yield via number of clusters per plant, number of branches, plant height and branch length. Seed yield is highly complex trait, thus indirect selection based on major component traits may increase the efficiency of breeder. The estimate of residual effect was moderate with 0.3557 which indicated the inadequacy of the characters chosen for the study. This indicates that some other characters have been left in the present study, for better understanding of the causal factors responsible for achieving high yield.
The study revealed that number of pods per plant had high direct contribution on seed yield. It was positively and significantly correlated with seed yield per plant. Selection of more number of pods per plant with more number of seeds per pod and hundred seed weight would result in improving the seed yield of blackgram
.
References
Burton, G.W. 1952. Quantitative inheritance in grasses. Proc. 6th Grassland Congr., I : 356- 363.
Chauhan, M., Mishra,A. and Singh,A.K. 2007. Correlation and path analysis in urd bean.Legume Res.,30(3):
205-208.
http://ejplantbreeding.com
320
Gupta, P.,Semwal, B.D. and Gupta,D. 2003. Correlationand path analysis in black gram (Vigna mungo L.
Hepper). Progressive Agric.,3 (1and2): 63-65. Johnson, H. W., Robinson,H.F. and Comstock,R.E. 1955.
Estimates of genetic and environmental variability in soybeans. Agron. J., 47(7): 314-318.
Kingshlin, M. and Vanniarajan,C. 2000. Association of yield attributes and component analysis among the quantitative characters of rice fallow urdbean genotypes. Crop Res.,19(1): 102-105.
Konda, C.,.Salimath,P.M and Mishra,M.N. 2008. Correlation and path coefficient analysis in blackgram [Vigna mungo (L.)Hepper]. Legume Res.,31(3): 202-205.
Lal, M. and Singh,D. 2014. Utilization of genetic diversity and its association characters in mungbean [Vigna radiata (L.)Wilczek].Legume Res.,37(6):
679-681.
Panigrahi, K.K., Mohanty,A. and Baisakh,B. 2014. Genetic divergence, variability and character association in landraces of blackgram (Vignamungo L. Hepper) from Odisha J.Crop and Weed, 10(2) : 155-165.
Panse V.G and Sukhatme,P.V. 1961. Statistical methods for agricultural workers. 2nd Ed. ICAR., New Delhi.Pervin, M., Polash,M.F.,Rahman, S.M. and Deb, A.C.2007. Study of Genetic Variability and
G* E Interaction of Some Quantitative Traits in Blackgram [Vigna mungo (L.) Hepper]. J. Biol. Sci.,7(1): 169-175.
Ramya, B., Nallathambi,G.,Ram,S.G. 2014. Genetic Variability, Heritability and Genetic advance in Induced Mutagenesis Blackgram (VignaMungo L. Hepper). Plant Archives, 14(1):139-141. Shivade, H., Rewale,A.P. and Patil,S.B. 2011. Correlation
and path analysis for yield and yield components in black gram [Vigna mungo (L.) Hepper].
Legume Res.,34(3): 178-183.
Sowmini, K. and Jayamani,P. 2013. Genetic variability studies for yield and its component traits in RIL population of blackgram (Vigna mungo (L.) Hepper). Electron. J. Plant Breed., 4(1): 1050-1055.
Umadevi, M. and Ganesan,K. N. 2005. Correlation and path analysis for yield and yield components in blackgram (Vigna mungo (L.) Hepper).
Ann.Agric. Res.,20: 447-458.
Vijaya Kumar, G., Vanaja,M., Babu Abrahum, Anitha,Y.,Jyothi Lakshmi,N. and Maheswari,M. 2015. Variability, heritability, genetic advance for quantitative traits in blackgram (Vigna Mungo L. Hepper). Int J. Curr.Sci. 17: E 37-42.
Vinoth, R. and Jayamani,P. 2014. Genetic Variability Studies for Yield and Its Component Traits in Inter Sub Specific RIL Population of Blackgram(Vigna mungo(
http://ejplantbreeding.com
321
Table 1. Analysis of variance for quantitative characters of blackgramsource df Mean squares
Days to 50% flowering
Days to maturity
Plant height
Branch length
No of branches
Pod length
Seeds per pod
Clusters per plant
Pods per plant
100 seed weight
Yield per plant
Replication 2 7.11 6.62 1.30 0.69 0.02 0.06 0.02 1.75 11.37 0.42 1.85
Treatment 79 12.27** 11.45** 104.49** 104.49** 1.20** 0.65** 0.86** 21.15** 160.85** 0.72** 31.41**
Error 158 7.63 7.48 4.03 2.36 0.02 0.05 0.26 0.97 8.67 0.21 1.64
http://ejplantbreeding.com
322
Table 2. Mean, range, phenotypic (PCV) and genotypic (GCV) coefficient of variation, heritability (broad sense) andgenetic advance for quantitative characters in blackgram
SI.No Characters Mean Range PV GV EV PCV
%
GCV %
ECV% h2 (%) GA GA%
1
Days to 50%
flowering 36.92 30.0-39.7 9.17 1.54 7.63 8.20 3.36 7.48 16.8 1.05 2.85
2 Days to maturity 66.28 61.7-69.0 8.80 1.32 7.48 4.42 1.71 4.08 15.0 0.91 1.37
3
Plant height 34.22 20.1-54.2 37.52 33.48 4.03 17.89 16.90 5.87 89.2 11.26 32.8
4 Branch length 23.58 13.2-37.7 36.40 34.04 2.36 20.64 19.96 5.26 93.4 11.62 39.76
5
No of branches 2.19 1.0-3.3 0.42 0.39 0.02 30.24 29.18 7.95 93.0 1.24 57.99
6 Pod length 4.88 3.6-7.9 0.25 0.20 0.05 10.37 9.17 4.84 78.1 0.81 16.70
7 Seeds/ pod 6.09 5.0-7.3 0.46 0.20 0.26 11.17 7.38 8.39 43.6 0.61 10.05
8 Clusters /plant 14.25 7.3-19.3 7.70 6.72 0.97 22.94 21.44 8.15 87.3 4.99 41.28
9 Pods/ plant 37.42 22-55.7 59.39 50.72 8.67 20.59 19.03 7.86 85.4 13.55 36.23
10 100 Seed weight 5.46 4.2-6.7 0.38 0.16 0.21 11.39 7.53 8.54 43.7 0.56 10.26
http://ejplantbreeding.com
323
Table 3. Genotypic and Phenotypic correlation coefficients among the eleven characters of blackgramS.No Characters Days to 50% flowering Days to maturity Plant height Branch length No of branches
Pod length Seeds/ pod Clusters/ plant Pods/ plant 100 seed weight Seed yield / plant 1 Days to 50%
flowering G P 1.0000 1.0000 1.0046** 0.9880** 0.1496 0.0928 0.1574 0.0870 0.2609** 0.0967 -0.2275** -0.1474 -0.0408 -0.0256 0.1520 0.0439 0.2139 0.0634 0.0516 -0.0164 0.1546 0.0222 2 Days to
maturity G P 1.0000 1.0000 0.1532 0.0913 0.1618 0.0852 0.2848** 0.0993 -0.1618 -0.1167 -0.0079 -0.0237 0.1625 0.0450 0.2180** 0.0635 0.0191 -0.0109 0.1515 0.0190 3 Plant height G
P 1.0000 1.0000 1.0040** 0.9929** 0.2702** 0.2408** 0.3412** 0.2873** 0.3303** 0.2600** 0.5018** 0.4465** 0.4702** 0.4110** 0.5578** 0.3254** 0.6033** 0.5372** 4 Branch
length G P 1.0000 1.0000 0.2663** 0.2477** 0.3383** 0.2918** 0.3341** 0.2556** 0.4979** 0.4530** 0.4657** 0.4183** 0.5517** 0.3324** 0.5998** 0.5427**
5 No of branches G P 1.0000 1.0000 -0.0897 -0.0833 0.2293** 0.0164 0.4276** 0.1502 0.4056** 0.3882** 0.0408 0.3470** 0.3877** 0.3309** 6 Pod length G
P 1.0000 1.0000 0.3662** 0.3872** 0.3527** 0.2900** 0.3257** 0.2772** 0.3944** 0.2653** 0.3977** 0.3985** 7 Seeds /pod G
P 1.0000 1.0000 0.4985** 0.3031** 0.4671** 0.2753** 0.0392 -0.0142 0.7161** 0.5605**
8 Clusters/ plant G P 1.0000 1.0000 0.9503** 0.9357** 0.0773 0.2112 0.8480** 0.7942** 9 Pods/ plant G
P 1.0000 1.0000 0.0647 0.2129 0.8738** 0.8271** 10 100 seed
weight G P 1.0000 1.0000 0.4027** 0.3831** 11 Seed yield /
plant
G P
1.0000 1.0000
http://ejplantbreeding.com
324
Table 4. Direct and indirect effect of ten quantitative characters on seed yield in blackgramS. No.
Characters Days to 50% flowering
Days to maturity
Plant height
Branch length
No of branches
Pod length
Seeds Per pod
Clusters per plant
Pods per plant
100 seed weight
Genotypic correlation with Yield 1 Days to 50%
flowering 0.2036 0.2012 0.0189 0.0177 0.0197 -0.0300 -0.0052 0.0089 0.0129 -0.0033 0.0222
2 Days to
maturity -0.2219 -0.2246 -0.0205 -0.0191 -0.0223 0.0262 0.0053 -0.0101 -0.0143 0.0024 0.0190
3 Plant height
0.0020 0.0020 0.0221 0.0219 0.0053 0.0063 0.0057 0.0098 0.0091 0.0072 0.5372
4 Branch length
0.0080 0.0078 0.0908 0.0914 0.0226 0.0267 0.0234 0.0414 0.0383 0.0304 0.5427
5 No of branches
0.0036 0.0037 0.0089 0.0092 0.0371 -0.0031 0.0056 0.0144 0.0129 0.0006 0.3309
6 Pod length
-0.0008 -0.0006 0.0015 0.0016 -0.0004 0.0054 0.0021 0.0016 0.0015 0.0014 0.3985
7 Seeds/ pod
-0.0092 -0.0085 0.0932 0.0917 0.0539 0.1389 0.3586 0.1087 0.0987 -0.0051 0.5605
8 Clusters /plant
-0.0029 -0.0030 -0.0297 -0.0302 -0.0259 -0.0193 -0.0202 -0.0666 -0.0623 -0.0141 0.7942
9 Pods/ plant
0.0434 0.0434 0.2811 0.2861 0.2374 0.1896 0.1883 0.6401 0.6841 0.1457 0.8271
10 100 seed
weight -0.0036 -0.0024 0.0709 0.0724 0.0036 0.0578 -0.0031 0.0460 0.0464 0.2179 0.3831