Inzinerine Ekonomika-Engineering Economics, 2019, 30(2), 128–139
Spatial Aspect in Bank Branch Performance Management
Martin Boďa, Emilia Zimkova
Matej Bel University in Banska Bystrica
Tajovskeho 10, 975 90 Banska Bystrica, Slovakia E-mail. martin.boda@umb.sk, emilia.zimkova@umb.sk
http://dx.doi.org/10.5755/j01.ee.30.2.19210
In spite of the fact that both profitability and technical efficiency of bank branches are greatly influenced by the local environment in which they are located and operate, local environmental factors are scarcely incorporated in performance assessments undertaken by banks themselves. The paper stresses that localization of bank branches (i.e. their spatial aspect standing for all local socio-economic environmental influences) is a significant factor that should be part of their performance assessment and demonstrates this for a commercial bank that runs a large retail branch network all over Slovakia. Through a case study of this Slovak bank, the paper aims to highlight the importance of the spatial aspect in explaining efficiency and economic results of bank branches, and to sketch a set of analytical procedures that may be adopted by commercial banks in internal performance assessment. Insights of geostatistics are employed in investigating the relationship between technical efficiency and profitability exhibited by the bank's branches and studying how this relationship is affected by the spatial aspect. Whereas technical efficiency stands for the voluminal dimension of a branch's performance, the profitability captures the monetary effects of the achieved performance position of a branch. It is found that for the bank's branches technical efficiency and profitability are closely related, and it is shown how this finding is relevant for bank branch performance management. A practical outcome of the analysis is that technical efficiency can be adopted by commercial banks in their internal rating systems of branch performance as a fully informative measure allowing them to assess managerial skills at a branch level. Technical efficiency scores may thus be utilized as a means of monetary stimulation of the best performing branches or in developing corrective policy strategies to manage the worst performing ones. Nonetheless, what is required is that the spatial aspect is sufficiently appreciated.
Keywords: Bank Branch Performance; Spatial Analysis; Technical Efficiency; Employee Profitability; Data Envelopment Analysis.
Introduction
Although the traditional model of distributing retail banking services is maintained through operating a branch network, it has been challenged in the recent decade during which new standards of banking services were established and provision of banking services moved from robust and maladroit branches in favour of lean service outlets and towards online banking. This shift in thinking necessitates enforcement of new yardsticks of performance required of bank branches. Currently, bank branches are reviewed on a regular basis whether they comply with criteria based on profitability, volume and quality of services they service. Information about their meeting or failing these criteria is then a valuable input to managerial decision-making at the bank level.
The focus of the paper is the first two highlighted criteria, i.e. volume and profitability of banking services. The first criterion of performance embodying size of banking services is represented by technical efficiency and is measured by an efficiency score computed in a framework of data envelopment analysis (DEA). On the other hand, the second criterion of performance understood as profitability of banking services is represented by an elementary ratio indicator that integrates all necessary information about profitability into one value. As follows from the surveys
complied by Berger & Humphrey (1997), Berger (2007), Fethi & Pasiouras (2011) and Paradi & Zhu (2013), these two performance criteria are substantial for bank operations and many studies analyze the relationship between technical efficiency and profitability of banking services (e.g. Camanho & Dyson, 1999; Portela & Thanassoulis, 2007). The present paper examines this relationship for a large commercial bank with a long tradition in Slovakia which, in the past years, has converted its extensive branch network into a system of branches ranging from large regional establishments to small local outlets reacting thus to the competitive pressures for higher efficiency and profitability. This anonymous bank operates a relatively dense network of branches that are scattered all over Slovakia and are classified internally by the bank itself into four categories with respect to their size and functions. Since there are strong economic disparities evincing themselves in local conditions, the spatial position of bank branches in the geographical territory of Slovakia may affect business activity and performance of individual branches. The influence of particular local conditions upon the activities of a bank branch is termed here as the spatial aspect.
under they full control. This commission gave rise to the paper and the research presented arose as between academia and banking practice. The anticipated output is a solid and sound framework that lets into branch assessment only those factors that are under the control of branch managers. For instance, environmental factors must inevitably be dropped from the framework. That being said, it is in turn necessary to inquire about the actual effect of environmental factors upon branch performance, and this furnishes the paper with its motivation. Bank branches that are located close to one another are necessarily exposed around to the same variety of environmental factors, out of which economic factors are clearly of the utmost importance. One might naturally wonder if – as a result of the locally-shared and spatially-varied environmental exposition – performance of branches situated in economically stronger localities/areas will tend to be more correlated and their performance will differ from performance of branches placed in economically less developed or disadvantaged localities/areas. This spatial aspect of operations represented by a set of all local socio-economic environmental influences upon branch performance and shown in spatial autocorrelation of bank branch performance characteristics can be captured at least in two manners. One such representation is directly through positional coordinates of branches, whereas the other representation is suggested by the degree of economic development of localities or regions/districts in which branches operate. The paper centres its attention on the former way of capturing the spatial aspect. Incidentally, using the terminology of regression analysis, the spatial aspect can be thought of as a confounding variable that influences profitability and technical efficiency (as well as other performance characteristics) of bank branches.
The aim of the paper is through a case study to stress out the importance of the spatial aspect in explaining efficiency and economic results of bank branches, and to sketch a set of analytical procedures that may be adopted by commercial banks in internal performance assessment. On one hand, these procedures are not restricted to the area of banking, but are readily useful wherever decision-making units are dispersed over a territory with significantly manifested environmental differences. Examples of such areas of use are health care provision, fishing, forestry, postal services, catering, accommodation or recreational services. On the other hand, the methodological procedures implemented here should incite a discussion into what best practices in studying performance of spatially dispersed units (and not necessarily bank branches) should be commonly employed an how the task should be handled.
With a focus upon the concerned Slovak commercial bank, the paper thus studies spatial influences upon bank branch operations and investigates, (1) whether there is a relationship between the technical efficiency and profitability of the bank's branches, (2) how the spatial aspect of the bank's branches (i.e. their spatial localization) impacts upon their technical efficiency and profitability, and (3) how this spatial aspect affects the relationship present between the technical efficiency and profitability of the bank's branches. The spatial aspect is treated on the branch level through the analytical instruments of geo statistics, being represented by geographical coordinates mapping exact positions of the bank's branches. Once the bank's senior managers had
articulated their insights on retail production, a production model (specified by enumeration of inputs and outputs) of the bank's branches could be developed. Simultaneously, technical efficiency and profitability were identified as building blocks of the new framework for bank branch assessment. Therefore, the adopted production model of the bank's branch operations combines the production approach describing the essence of banking operations and combines it with the intermediation approach. Technical efficiency is then measured by the non-oriented slacks-based measure (SBM) and estimated by data envelopment analysis. In contrast, profitability is expressed as a simple ratio indicator constructed as the profit generated on average by one branch employee. This indicator thus connects the profit-generating ambition of a branch to the chief input it utilizes, labour force. The novelty of the paper is no less than two-fold. One is that the spatial aspect is taken into account in exploring the links that manifest themselves in two complementary facets of bank banking production: technical size-based criterion and profit monetary criterion. As only those inputs and outputs that are controllable by branch managers are considered in the bank branch production model, technical efficiency gauges managerial aptitudes displayed by branch managers. In contrast, profitability of branches may be viewed as a metric capturing both the ability of branch employees to earn a profit for the bank in the course of day-to-day banking operations and the attractiveness of the environment in which branches are located. The other novelty is more general and goes beyond the needs of banking practice per se as it consists in outlining a basic methodological framework useful for assessing a presence of the spatial in performance indicators of geographically scattered units.
The paper is a nontrivial extension of an earlier effort made by the authors (Boďa et al., 2016) that instigated an interest in the spatial aspect and employed choropleth maps and correspondence analysis to that effect. To the best knowledge of the authors, there are no other or similar case studies or research works that concentrate on including spatiality explicitly in a performance assessment or intend to develop best practices in the methodology of performance assessment of spatially dispersed units, here bank branches.
It is ascertained that technical efficiency scores may be useful in developing new practices or policies in the arena of internal rating and incentive schemes at a branch level or in formulating corrective strategies for non-performing branches. As such, technical efficiency seems a very reliable indicator useful in identifying capabilities of branch managers to manage.
Motivation and Literature Review
In consequence of the recent economic crisis the traditional economic model of commercial banking had to be modified and these changes have been being implemented in the course of the past few years. The financial crisis of 2007– 08 gave a new outlook upon goals of commercial banks, which became more modest in comparison to the pre-crisis period. Whilst prior to 2009 shareholders demanded of commercial banks a double digit rate of return (frequently around 20 % p.a.), in the first years of the economic crisis expectations had to be adjusted to a sustainable level of investment return during the entire business cycle (e.g. Choudhry, 2012, p. 764). The changing ultimate goal of commercial banks stipulated conversion of operational process, and robust corporate banking with investment banking have been superseded by dynamic retail banking benefiting from cheap borrowing of financial funds whose costs were close to 0. Albeit the financial crisis is a natural landmark for the most recent changes, shifts towards retail banking have been taking place in the bank concerned since 1990 as Slovak economic and political life embarked on their reconstruction period.
The changing perspective of banking business is fully recognized by the senior managers of the large Slovak commercial bank concerned who initiated research centred on the bank's branches with the intention to learn performance-enhancing lessons from accounting information and internal analyses of the bank. The research should be helpful in identification and reorganization of technically and allocatively inefficient branches, in planning new sales and advice outlets in the bank's retail network, and should help the bank's branches be more technically efficient or profitable without substantial disparities. The information on how spatial and geographical position impacts upon technical efficiency of bank branches is inevitable for improving internal business processes and internal organization of commercial banks, and is one of key inputs to internal decision-making. According to a study of PricewaterhouseCooopers (2011, p. 19) as many as 57 percent of bank customers find physical location of their branch in the neighbourhood of their home as the most decisive factor for selecting their bank whereas for instance only 37 percent focus on price policy of the bank. Since physical location of bank branches is still ranked to the key factors for selecting a financial institution, the aim of the research is thus to find out whether the spatial aspect is influential or marginal in effects upon technical efficiency and profitability of the bank's branches.
A valuable overview study of efficiency research in banking is Fethi & Pasiouras (2010) who note that little research attention is given to cost and profit efficiency of bank branches. In addition, Paradi & Zhu (2013) make a survey of papers that study performance of bank branches. Their survey reveals that little interest is paid in literature to capture managerial experience and skills as well as managerial influences in bank branch performance assessment. Technical efficiency and profitability are examined as two essential performance indicators of branch production by Camanho & Dyson (1999), Portela & Thanassoulis (2007), Tsolas (2010) and Paradi et al. (2011). These studies treat technical efficiency as an outcome of economic optimization of input
and output volumes in bank branch production and view profitability as the ultimate goal of banking enterprise. The pivot of their attention is the mutual relationship between these performance dimensions in an attempt to optimize both these facets of production process undertaken by bank branches.
Certainly, it is not only the dimensions of technical efficiency and profitability that could be utilized for the benefit of a comprehensive performance assessment, but also other dimensions of performance are perfectly apposite and there is no need to resort merely to efficiency measurement based on DEA. To elaborate, for example, one dimension may be represented by corporate sustainability and DEA may be replaced by a suitably-defined composite indicator approach as was considered by Kocmanova et al. (2017). Another alternative to DEA is the HGN model proposed by Hyranek et al. (2018) and other examples of performance dimensions to be accounted for are intellectual capital (e.g. Urban et al., 2017) or market performance (e.g. Yoo & Seo, 2017). Of course, the choice must be fully customized to the needs and depth of the performance assessment and will vary on a case-by-case basis.
In spite of the fact that spatial analysis is given full appreciation in economic analyses (see e.g. Mate-Sanchez et al., 2012; Buckley, 2004), in the field of banking it can be encountered only rarely and is mostly owing to some recent work except perhaps the early study of Boufonou (1995). Jagric et al. (2015) analyze macro and micro topological aspects in the history of European banking, whilst Nanda & Nicholas (2014) study territorial occurrence of bank bankruptcies during the Great Depression in the USA. Hollander & Verriest (2016) then investigate how geographical distance of bank customers in the USA influences conditions for granting a loan. As might be anticipated, they find that more distant loan contracts are more restrictively reviewed and required to provide a stricter loan guarantee. Balfour et al. (2015) center their performance assessment directly upon mini branches located in grocery stores. Spatiality is emphasized as a significant determinant for assessing performance in bank branch networks by Vance (2000) and Başar et al. (2015) who claim importance of branches in commercial banking despite the changing environment. Yet, branches must be continuously analyzed and assessed in reference to demographic trends and changes in customer behaviour.
A study worthy of notice in connecting technical efficiency and profitability of bank branches with regard to their spatial pattern is Boďa et al. (2016), a predecessor of the present paper originated by the same authors. Operating in the same circumstances of a Slovak commercial bank and its branch network, Boďa et al. (2016) studied these issues using choropleth maps and correspondence analysis, and were the first to demonstrate that technical efficiency should be considered in developing a scheme of monetary stimuli of the best performing branches.
Setting of the Bank's Branch Performance
Assessment and Data
production profile of a single branch. For this reason the paper directs attention to the relationship between three elemental factors of branch production: technical efficiency, profitability and the spatial aspect. This section describes how technical efficiency and profitability are handled at a branch level in the conditions of the bank and provides an explanation how the spatial factor presents itself and is modelled. It also reasons why spatial characteristics may be of influential environmental effects whose importance is heightened by notable economic disparities manifested across Slovakia.
Beginning with the third variable of interest, the spatial aspect is dictated on the atomic level of branches by their actual position in the geographic latitude-longitude coordinate system. This construal represents the most concise degree of detailedness with which information on local environmental influences may be treated and through which the relationship between the technical efficiency and profitability of the bank's branches may be approached.
The production model stipulates that bank branches act as providers of banking services and sellers of banking products (no matter whether these come straight from the bank itself or are on behalf of other parties). The posited model presumes that a branch employs multiple inputs in providing multiple outputs. This production is accomplished with some relation between inputs and outputs (i.e. under certain mixing proportions of inputs and outputs), and the proportions between input volumes used and output volumes produced are evaluated through technical efficiency. Under (full) technical efficiency maximum outputs are being produced at the utilization of minimum quantities of inputs so no improvement in an input or output is possible without affecting negatively all other variables. The inputs and outputs chosen for the bank's branches are utterly desired by the bank's senior managers to be controllable by individual branch managers. Inevitably, this desideratum entails that a performance assessment of branches is rather a performance assessment of branch managers. Apropos, a very similar requirement on the production process can also be found elsewhere (e.g. LaPlante & Paradi, 2015, p. 34). The outlook on banking institutions as financial intermediaries that is also fairly common in the literature (e.g. Sufian & Habibullah, 2010; Sufian & Kamarudin, 2014) is not appropriate in the present case as it is bank branches, and not banking institutions as such, that are subject to performance assessment. Of course, some parallel treatments and outlooks are still possible as in Giokas (2008). Interestingly, it appears that for Slovak banks a performance assessment of their branches is undertaken rarely. An exception is e.g. Kočišova (2012).
It is not within the remit of branch managers to select the site and equipment for their branches or to outsource support services. Nonetheless, their competences suffice to hire and manage labour force. Built on this premise, the production model singles out two types of labour force as the only two inputs and identifies deposits taken, loans granted and mutual fund shares intermediated as the only three outputs. Whereas deposits and loans are associated with the production approach under which banks are mere producers of banking services, the presence of mutual fund shares is on account of the intermediation function of bank branches. The bank sells mutual fund shares in behalf of its sister company engaged in financial asset management. Insomuch as loans kept by bank branches may (and do) comprise an undesirable component
of classified loans, these loans are subtracted and only unclassified loans in net are considered instead. Labour force is broken down into two inputs: managerial labour force and ordinary labour force. This separation recognizes that labour force serves different functions in a branch. Managers perform managerial functions, and ordinary branch employees (such as bank clerks, sellers or administrative employees) offer services to customers or accomplish support alongside administrative tasks. The former represent managerial labour force, whereas the latter typify ordinary labour force. These two inputs are measured in yearly-average number of employees expressed as full-time equivalents. The three output variables are all monetary and are stated as year-end balances in thousands of euros.
It is somewhat true that the production model as outlined in the preceding paragraph somewhat differs from the best practice selections of production variables that can be encountered in the studies overviewed by Fethi & Pasiouras (2010) or Paradi & Zhu (2013). Although some discourse may be held that in many an instance these selections are careless, the fact remains that any performance assessment should be tailored to the needs of each particular case as is done now. This is also stressed by Gimzauskiene & Kloviene (2011) who seek to establish an institutional theory of performance measurement or by Gimzauskiene et al. (2016) who – whilst focusing on municipalities – emphasize that any performance assessment should be tailored to peculiarities and inclusive of all possible limitations of the situation in hand.
Branch technical efficiency governed by the adopted two-input three-output production model was measured by the non-oriented SBM applying the assumption of variable returns to scale. The non-orientedness tallies with the ability of branch managers to control and manage both sides of branch retail production. The advantage of the SBM model over commonly used radial DEA models is that it undertakes measurement of strong technical efficiency (i.e. in the sense of Pareto and Koopmans). Variable returns to scale are favoured since it is scarcely to be expected that links between inputs and outputs in bank branch production are ideally proportional. The validity of this choice can be easily justified by the procedure for identification of returns to scale working in an SBM framework proposed by Boďa (2015). The details are not reported here for their marginal relevancy, but this procedure indicates that most of the bank's branches have their operations at variable returns to scale. Also the details on the SBM methodology are skipped here and left unpresented for they are generally known or can be found e.g. in Tone (2001).
of profitability is computed for individual bank branches and is constructed as a ratio of the profit generated by the sale of banking services (net interest income plus fee income plus income from intermediation of mutual fund shares) and the number of employees who contributed to this profit. Employee profitability connects the input side of bank retail production with its output side. Nonetheless, the input side is expressed in physical units (full-time equivalents of employees) as opposed to the output side which is measured in monetary units (€).
Dated back to the fiscal year 2014 and still relevant at present, the data set on the bank's branches comprises a total of 183 branches and excludes from the existing branch network “Type IV” branches that fulfil functions of small outlets with ancillary (perhaps more societal) functions. The reason for this exclusion is their very specific function. Also the bank itself applies different metrics whilst reviewing Type IV branches than it does for other branches. Managerial and ordinary labour force are measured by full-time equivalents of employee numbers and stated as yearly averages. Total deposits, total (unclassified) loans and mutual fund shares intermediated are measured in thousand € reported as of 31 Dec 2014, and so are the three income items (i.e. net interest income, fee income and income from intermediation of mutual fund shares). Although the data mirror the fact that branches are categorized into different groups by size and functions, their graphical display gives no indication of any anomaly or outlier.
For the 183 bank's branches, SBM technical efficiency scores were estimated and employee profitability was calculated. The estimation of technical efficiency scores proceeded under the fairly logical premise that there is each distinct branch type is epitomized by a specific production process. This treatment is supported not only by the hierarchical structure of competences going down from Type I branches to Type IV branches, but also by varying sizes of branches belonging to different branch types. Only data observations for Type I branches were used to estimate technical efficiency scores for 19 branches of this type, and such a separate estimation was accomplished for 48 Type II branches and 116 Type III branches.
A caveat must be placed on the fact that the data sample was not constituted as a random draw, which prohibits any attempt at statistical inference. Program R (R Core Team, 2013) with the assistance of several R packages was employed in conducting the analysis and all the computations and in preparing the graphical presentations organized in the paper.
Instruments Adopted for Spatial Pattern
Exploration
The spatial aspect presenting itself in the local environment of the bank's branches across the territory of Slovakia is captured by, and modelled by dint of, latitude and longitude coordinates that pinpoint the branches' exact positions on the map. These coordinates then identify positions of the branches in bidimensional Euclidean space and may be easily drawn in bidimensional plots with (preferably) perpendicular axes bearing latitude and longitude coordinates, respectively. In a similar vein, they represent – individually or jointly – the spatial aspect that affects the performance of the branches.
Coupling values of technical efficiency and profitability, or of any suchlike performance indicators, with latitude and longitude coordinates, it is possible immediately to match the performance level of the branches against their spatial position conveniently in scattegraphs in two possible ways:
1. Branches may be plotted using Cartesian coordinates where the horizontal axis stands for latitude and the vertical axis for longitude. The plotting symbols may differ in terms of size or colour so as to indicate different levels of technical efficiency and profitability. Such an approach is applied later in Figure 1.
2. Branches may be displayed in a plot with Cartesian coordinates in which the horizontal axis stands for latitude or longitude and the vertical axis represents technical efficiency or profitability. This visualization is applied later in Figure 3. Both these forms of visualizations may be, and actually are, handy in studying the spatial pattern underlying technical efficiency and profitability of the branches. Correlation analysis may be further utilized to support impressions for reading visual displays in the scattergraphs. Strength of the pattern may be assessed by traditional Pearson correlation coefficients or their robust counterparts obtained e.g. as those derived from the minimum volume ellipsoid (MVE) covariance matrix estimator (see e.g. Maronna et al., 2006, pp. 189–190).
Isolation of the spatial aspect from technical efficiency and profitability may be readily undertaken in the manner of regression analysis. This is an approach common for relating explanatory variables to profitability or applied in isolating contextual variables from technical efficiency scores in DEA (e.g. Coelli et al., 2005, p. 194; Bogetoft and Otto, 2011, pp. 186-196). Since the profit index measuring profitability is theoretically unrestricted on the real axis, in regressing branch profitabilities on latitude and longitude coordinates, a classical (perhaps non-linear) regression model may be employed. Its parameters may be estimated by (non-linear) ordinary least squares or by a similar resistant method. Here, the model for isolating spatiality from profitability was considered in the form of equation (4) and fitted by the M-estimator. A different situation arises with DEA efficiency scores that are restricted to the interval [0,1] which may hamper statistical usefulness of standard regression. Tobit (censored) regression is advocated for DEA efficiency scores (e.g. Hoff, 2007) and employed in efficiency studies in banking (e.g. Batir et al., 2017; Doan et al., 2018) or elsewhere (e.g. Turner et al., 2004; Sağlam, 2018). A tobit regression model is conventionally estimated by maximum likelihood (ML) as is done in estimating the specification considered in equation (3) isolating spatiality from technical efficiency. Whereas Greene (2003, pp. 764-768) is a useful exposition of tobit regression, Maronna et al. (2006, pp. 98-103) explains M-estimation in regression models. Finally, Hastie et al. (2001, pp. 206-208) guides through modern model selection.
It must be said and underlined that extant studies do not consider latitude and longitude coordinates (or any form of a spatial representation) in modelling environmental effects, and qualifying these spatial coordinates for explanatory or contextual variables is novel and an original component of the procedure.
addition to standard requirements put on the goodness-of-fit, the residuals resulting from the fitted model must display no spatial autocorrelation, which may be checked by Moran's I or Geary's C (see e.g. Bivand et al., 2008, pp. 258–260).
Whilst Moran's I functions as a global measure of spatial autocorrelation, Geary's C is suitable for detecting local spatial autocorrelation. Consider spatial data x1,..., xn
with average value av(x) and variance var(x) whose spatial relationship is captured through weights matrix W = (wij)nn,
wherein wij is a spatial weight indexing location of datum i
relative to j. Moran's I is constructed by manipulating the definitional formula of the Pearson correlation coefficient and is defined as
I = (∑i∑jwij(xi – av(x))(xj – av(x)))/(var(x)∑i∑jwij) (1)
and takes values between –1 and 1. A value greater than its expectation E(I) = –1/(n – 1) points to the existence of spatial autocorrelation and clusters of similar observations. In testing significance of Moran's I, a Z statistic is used that under the null of no spatial autocorrelation is asymptotically normal. Geary's C ratio varies from 0 to 2 and is defined as C = (∑i∑jwij(xi – xj )2)/(2var(x)∑i∑jwij). (2)
Geary's C may be made comparable to Moran's I by converting C# = 1 – C, in which case positive values indicate positive autocorrelation. After this conversion, a test of significance based on checking whether C# is actually positive (and hence greater than its expectation E(C#) = 0) by means of an asymptotically normal Z statistic may be done.
Technical Efficiency and Profitability of the
Bank's Branches With the Spatial Aspect
There is variability apparent both in the estimated technical efficiencies and the calculated profitabilities for the bank's individual branches that is well manifested spatially throughout the region of Slovakia. The way how the spatial aspect is reflected in these performance characteristics is studied in this section at the atomic level of branches. In this respect, the scattergraphs presented in Figure 1 reveal that the
bank's branches with a comparatively higher level of technical efficiency or profitability tend to spatially concentrate and form clusters. This is evident especially in the case of technical efficiency when the best performing branches are concentrated in the western part of Slovakia. A similar tendency is found with profitability, but the visual scatter is more heterogeneous. Nevertheless, both scattergraphs are indicative of a presence of spatial autocorrelation and their comparison by mutual superimposition suggests some association between (the classes of) the technical efficiency and profitability of the bank's branches. Branches (and areas of branches) that tend to perform well poorly in one criterion tend to show bad performance concerning the other criterion. An identical judgment would be drawn if a continuous scale were chosen for Figure 1. The impression about the presence of association/correlation between technical efficiency and profitability of branches might be also gained by plotting technical efficiency scores against profitability measures, but this would be at the cost of overlooking the spatial dependence manifest in these indicators. Obviously, for technical efficiency this dependence goes alongside longitude coordinates (on the horizontal axis) and becomes stronger with a pattern of heteroskedasticity when going in a western direction. In the case of profitability this dependence is not displayed and in either case latitude coordinates (on the vertical axis) are not an explanatory spatial factor. For profitability, spatial autocorrelation appears to be a matter of local clustered influences than a matter with a systematic pattern.
Whilst exploring the presence of possible links between the technical efficiency and profitability of the bank's branches, it is possible to utilize, perhaps for the purpose of comparison, both representations of the performance criteria so that the spatial aspect is explicitly accounted for. This inquiry pursued here on the level of branches is grounded in traditional or spatial correlation analysis using the original cardinal measurement of technical efficiency scores and profitability values. This section exposits the methodology and presents the results.
Figure 1. Technical Efficiency and Profitability of Branches for Quartile Categories
The scattergraph in Figure 2 depicts the relationship that exists between technical efficiency and profitability of branches. The scattergraph is equipped with a resistant fit of the regression line (estimated using the M-estimator by iterated re-weighted least squares). The relationship between the two indicators of branch performance can obviously be satisfactorily deemed as linear (and this explains the fit of linear regression), albeit with a flavour of heteroskedasticity. This might be anticipated as higher
"outliers" or "influential observations". These observations are caused by branches which attain full technical efficiency but they do not show excellence in profitability (and this is a sheer heteroskedastic pattern). Regardless of the presence of some anomalous observations, it is attested that employee profitability tends to be higher for higher technical efficiency. The correlation coefficient that measures the strength of notional linear association between technical efficiency and employee profitability of the bank's branches and that answers to the scattergraph in Figure2 has a value of 0.683. This value is estimated by correlating the M-estimate of regression line with actually observed data points by means of the MVE estimator. However strong is this indications of linear relationship, it happens to ignore the fact that branch technical efficiency and profitability are influenced by the regional environment as well as the particular physical locations in which branches operate. This ignorance comes to be at odds with the empirical observation that closer objects are more similar and more related to one another.
In order to obtain more insightful and meaningful correlation coefficients, the spatial aspect must be recognized as a confounder and treated in a way similar as in regression analysis. This net correlation may be constructed and measured in analogy to partial correlation (see e.g. Wonnacott & Wonnacott, 1981, p. 179) by first removing spatial effects from both indicators by the regression method and then by correlating the resulting residuals. Such a procedure is also recommended for trended time series data (see e.g. Kennedy, 2008, p. 26) and is suggested here by the fact that the distribution of technical efficiency and profitability across the branches seems to follow trends suggested by spatial coordinates that determine branch positions. These trends are observable in Figure 3 which depicts how technical efficiency and profitability of individual branches depends on the latitude and longitude coordinates. Towards this end, the exact physical position of the bank’s branches is captured by degrees of latitude and longitude. Some curvilinear relationship is revealed especially for profitability.
Figure 2. Technical Efficiency and Profitability
Figure 3. Coordinate Dependence of Technical Efficiency and Profitability
In order to account properly for the spatial trends in the technical efficiency and employee profitability of the bank's branches, both these performance indicators may be explained with the use of latitude and longitude coordinates. Therefore a search for the best model was initialized in a regression context, but with two factors taken under advisement therewith. On one hand, as suggested by the scattergraphs in Figure 3, the spatial trends may be non-linear (possibly quadratic) and in addition to original latitude and longitude coordinates their second powers were considered as well. On the other hand, the SBM technical efficiency score is limited to the unit interval [0,1] in contrast to the employee profitability indicator that can take in theory an arbitrary (positive or negative) value. Technical efficiency scores outside this interval are not-observable and
not possible. In consequence, standard regression techniques are applicable in purging profitability values of the spatial trend and tobit regression is adequate for detrending technical efficiency scores. Performing exhaustive automatic model selection in the space of tobit regression models (for technical efficiency scores) and standard regression models (for profitability values) with the explanatory variables latitude and longitude coordinates raised at most to the second power. Working on the basis of the Schwarz information criterion and under the ad hoc assumption of normality, it was obtained uniformly for technical efficiency and profitability that longitude (i.e. the geographical position of a branch in the east-west direction) itself has sufficient explanatory potential. In each case, as the explanatory variables only the longitude coordinate and 48.0 48.5 49.0
0 .2 0 .4 0 .6 0 .8 1 .0
Degree of latitude
T e ch n ica l e ff ici e n cy sco re Districtual level Technical efficiency vs. latitude
17 18 19 20 21 22
0 .2 0 .4 0 .6 0 .8 1 .0
Degree of longitude
T e ch n ica l e ff ici e n cy sco re Districtual level Technical efficiency vs. longitude
48.0 48.5 49.0
100
150
200
250
300
Degree of latitude
Pro fit In d e x (1 0 0 0 € p e r e mp lo ye e ) Districtual level Profitability vs. latitude
17 18 19 20 21 22
100
150
200
250
300
Degree of longitude
Pro fit In d e x (1 0 0 0 € p e r e mp lo ye e ) Districtual level Profitability vs. longitude
48.0 48.5 49.0 49.5
0 .2 0 .4 0 .6 0 .8 1 .0
Degree of latitude
T e ch n ica l e ff ici e n cy sco re Branch level Technical efficiency vs. latitude
17 18 19 20 21 22
0 .2 0 .4 0 .6 0 .8 1 .0
Degree of longitude
T e ch n ica l e ff ici e n cy sco re Branch level Technical efficiency vs. longitude
48.0 48.5 49.0 49.5
50
150
250
350
Degree of latitude
Pro fit In d e x (1 0 0 0 € p e r e mp lo ye e ) Branch level Profitability vs. latitude
17 18 19 20 21 22
50
150
250
350
Degree of longitude
its square were chosen. Denoting the longitude coordinate of a branch i by i and its technical efficiency score as TEi, the model found as sufficiently information descriptive for TEi followed the tobit specification
i = 0 + 1i + 2i2 + i,
TEi = 1/i if i ≥ 1, TEi = 1 if i < 1, (3) in which i is the value of the corresponding latent variable, 0, 1, 2 are unknown regression constants and i is an iid
normal disturbance term with zero mean and positive scale σ. By taking reciprocals, technical efficiency scores are transformed from the interval [0,1] to the interval [1,) and this simplifies censoring to the left end only. Denoting in this setting the profitability value as Pi, a standard linear-in-parameters regression model was specified for it in the form
Pi = 0 + 1i + 2i2 + i, (4) where the meaning and properties of 0, 1, 2 and i are retained. The tobit regressions were estimated by the ML method and the regressions for profitability were fitted, as before, by the M-estimator. The fitted models are reported in Table 1. This table does not reproduce the full output on significance testing as statistical inference is not justified here, which sprouts from the fact that the data are not drawn as a random sample. The (asymptotic) significance statistics (displayed as "z value" or "t value") indicate that the estimated values are in most cases far from being zero, though. Small values of coefficient of determination (R-squared) are a result of the heteroskedastic pattern revealed in the scattergraphs in Figure 3.
Correlating the residuals of these detrending regressions in order to obtain the desired measure of net correlation between branch technical efficiency and profitability is appropriate only if the residuals of technical
efficiency scores and profitability values are not spatially autocorrelated and thus if the detrending was effective. As is emphasized by Bivand et al. (2008, pp. 258-260) detrending is a prerequisite for spatial autocorrelation examination. Moran's I and Geary's C were used to check the residuals for absence of spatial autocorrelation but with different spatial weights chosen so that a possibly distorting effect of choosing diverse weights was neutralized.
Table 1
Fitted Models of Coordinate Dependence of Branch Technical Efficiency and Profitability
Coefficient Technical efficiency Profitability
estimate z value estimate t value
intercept (0) -64.36 -3.913 1302.31 2.711
longitude (1) 6.64 3.890 -113.50 -2.274
longitude2 (
2) -0.16 -3.705 2.73 2.119
scale (σ) 34.97 NA
log(scale) (lg(σ)) 0.20 3.464
Other statistics 183 observations,
25 left-censored
183 observations,
adjusted R2 = 0.126
Nevertheless, the settings considered were distance-based neighbours identified by means of the k-nearest neighbours algorithm and the spatial weights were defined by means of binary codes (1 for a neighbour, and 0 otherwise) and then row standardized to sum to unity. Although sensitivity analysis was conducted up to the k = 10 nearest neighbours of branches, only the nearest neighbours, the two-nearest neighbours as well as the three-nearest neighbours of branches are for illustration purposes displayed in Figure 4. Higher-order neighbours could not be readably demonstrated.
Figure 4. Linkages between Neighbouring Branches up to the three Nearest Neighbours
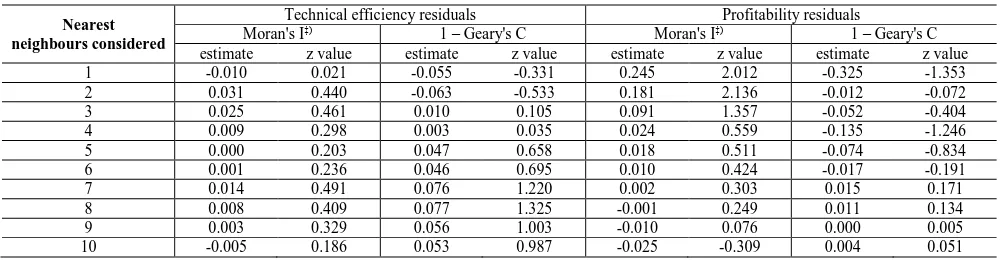
For each of the 10 row-standardized spatial weights matrices and for the residuals of each regression the values of Moran's I and Geary's C were computed and they are reported in Table 2. The output is without calculated probability values as the data are not a random draw, in which case the Z value for significance testing should be asymptotically normally distributed. The estimated values of Geary's C are rendered comparable to the values of Moran's I by calculating their complement to unity. The estimates of Moran's I and transformed Geary's C close to zero (jointly with low magnitudes of Z values) indicate that the detrending removed the spatial pattern from technical efficiency and profitability of the bank's branches and that the residuals do not manifest spatial autocorrelations.
are located in "good" areas have the same opportunity to excel in terms of both performance criteria as those that are located in "disadvantaged" areas. Irrespective of the
localization, good performers in technical efficiency also tend to be good performers in profitability, and vice versa.
Table 2
Spatial Autocorrelation Measures for the Residuals of the Fitted Models up to the 10 Nearest Neighbours
Nearest neighbours considered
Technical efficiency residuals Profitability residuals
Moran's I‡) 1 – Geary's C Moran's I‡) 1 – Geary's C
estimate z value estimate z value estimate z value estimate z value
1 -0.010 0.021 -0.055 -0.331 0.245 2.012 -0.325 -1.353
2 0.031 0.440 -0.063 -0.533 0.181 2.136 -0.012 -0.072
3 0.025 0.461 0.010 0.105 0.091 1.357 -0.052 -0.404
4 0.009 0.298 0.003 0.035 0.024 0.559 -0.135 -1.246
5 0.000 0.203 0.047 0.658 0.018 0.511 -0.074 -0.834
6 0.001 0.236 0.046 0.695 0.010 0.424 -0.017 -0.191
7 0.014 0.491 0.076 1.220 0.002 0.303 0.015 0.171
8 0.008 0.409 0.077 1.325 -0.001 0.249 0.011 0.134
9 0.003 0.329 0.056 1.003 -0.010 0.076 0.000 0.005
10 -0.005 0.186 0.053 0.987 -0.025 -0.309 0.004 0.051
Notes: ‡) The expected value is -0.005.
Conclusion and Discussion
The value added of the paper rests in the accentuation of modelling the spatial aspect explicitly in bank branch performance assessment and in a proposal of analytical procedures suitable for accounting for the spatial factor in the system of internal performance assessment on the branch level. This is obviously needed for it seems that no universally valid best practices have been developed for bank branch performance assessment and the prevalent practice fails to consider local environmental influences explicitly. Whilst the authors hope to instigate a discussion in this respect, the fact that the considerations are directed to bank branches is in no way limiting since these ideas are applicable whenever decision-making units are spatially scattered over a larger territory.
In the paper a model of branch production is specified and customized to the needs of the bank in question and branch performance is approached through the prism of two basic dimensions, viz. technical efficiency and employee profitability. Through a particular selection of the input-output set of branch production guided by the desideratum that production variables are fully controllable by branch managers, the former performance indicator actually stands for managerial capabilities and skills of individual bank branch managers. On the other hand, the latter not only points to desirability of the local economic environment of branches, but is an unmediated indicator of employee capabilities to attract customers for loans at the branch level, who are the principal source of revenue for bank branches. The entertained model of bank branch production is built upon the premise that branch managers endeavour to optimize the resources which they use to achieve a maximum production of banking services, and that this optimization is done in the first stage of decision-making in physical quantities. They have competencies only to manage input labour force to secure a maximum provision of loans and deposits as well as a maximum intermediation of mutual fund shares. The endorsed view on bank branch production accords with common practice that relies more on volume-based metrics (such as total deposits made or total loans granted) than on price metrics (such as profits
The conducted analysis shed some light upon how the spatial aspect works for the bank's branch network and was instrumental in formulating the conclusions regarding (1) the effect of spatiality on branch technical efficiency and profitability, (2) the existence of relationship between the two branch performance criteria, (3) the effect of spatiality on this relationship.
Ad 1. Unsurprisingly, the spatial aspect does influence the level of technical efficiency and employee profitability of the bank's branches. There appear to be differences in technical efficiency and profitability across the territory of Slovakia as technically efficient and profitable branches are clustered rather in the western part of Slovakia, which is apropos more developed as opposed to its eastern part. Being more regular for technical efficiency than for profitability, this general tendency evinces itself clearly and suggests that performance of the bank's branches follows trends alongside the longitude coordinate (naturally decreasing towards the east). The fact that this quadratic longitude coordinate dependence manifested e.g. Figure 3 or established by the Schwarz information criterion minimizing regression models reported in Table 1 is accompanied by a heteroskedastic pattern indicates that this regularity is not universal but it is affected by other factors as well. The attained level of technical efficiency of branches is still a matter of managerial skills and the level of profitability made is in all likelihood dictated also by particular economic conditions in which branches operate. Ad 2. A positive relationship between technical efficiency and profitability is discovered for the bank's branches, and thus branches with higher technical efficiency are prone to display higher profitability. The resistant correlation coefficient about 0.7 shows that this relationship is quite strong. Furthermore, the visualizations reveal that a linear approximation serves well, yet with signs of a heteroskedastic pattern manifested inter alia by unusual observations of branches. These instances are particularly cases when branches display full technical efficiency but their profitability defies the general tendency to increase with technical efficiency. This may be due to the property of the DEA estimation method to overestimate the true level of technical efficiency and label as technically efficient also branches that in fact do not display technical efficiency.
Ad 3. What is called in the paper by the spatial aspect does not affect branch operations negatively and exerts sort of a neutral effect upon performance of the bank's branches. As might be anticipated, branch performance in both technical efficiency and profitability goes in line with economic development of regions, but those managers who are capable of managing their branches technically efficient and through their technical efficiency to attain acceptable or good employee profitability keep these managerial skills of theirs in whatever local environment. Hence, it does not depend on whether they operate a branch placed in a disadvantaged geographical position or a branch located in
an economically attractive environment. What is of importance is their engagement in this management process and their managerial skills.
It is convenient for the bank's internal purposes in the area of planning and managing its branch network that operating procedures in individual branches are homogenized so that technically efficient branches may be highly profitable as well. This would imply high correlation (or some strong curvilinear relationship) between technical efficiency and profitability of branches regardless of the economic power of regions, districts or local areas. Contrariwise, somewhat lower values of this correlation signal that in a given region there are branches with different corporate culture. Some of them, probably thanks to their local branch manager, can outperform the other branches operating in the same region for which they should serve as a benchmark. The identified differences between branches on the regional level is the main result of the analysis and should be followed by a set of measures aiming at reducing technical inefficiency and profitability improvement for less successful branches. In districts with a less developed economic environment where there is high correlation between average branch technical efficiency and profitability, the appropriate course of action lies in gradual reducing the number of branches – provided that only economic criteria are taken under advisement.
All things considered, technical efficiency and profitability of a branch are to a great extent dependent on the branch's geographical position and districtual or regional affiliation, but this position does not impact negatively on the mutual relationship that underlies these two performance characteristics. Much depends on the managerial skills of the branch manager who can manage its branch for good performance even in a disadvantaged environment. A secondary consequence is that technical efficiency can be safely be integrated in internal rating systems of branch performance assessment since it gives a reliable picture of managerial skills and expertise displayed by branch managers. Technical efficiency scores are thus certainly useful measures upon which internal incentive schemes or corrective policy strategies can be based. The best performing branches may be encouraged by monetary stimuli, whereas the worst performers may be pressed to improve their performance.
Of course, it must be admitted that the proposal of analytical procedures made in the paper is initial and that it surely deserves refinement. Currently all socio-economic local influences are reduced to one common spatial factor, which may not be true and perhaps at the introductory stage of a performance assessment the analysis should check whether spatial coordinates are unanimously a good representation of the local socio-economic environment. In addition, more advanced modelling approaches to isolating the spatial aspect that outreach classical or tobit regression may be accommodated
Acknowledgement
References
Balfour, R., Joo, S. J., Whited, H. H. I. H., & Lin, J. W. (2007). Assessing the comparative performance of banking branches.
Benchmarking - an international journal, 22(5), 963–972. https://doi.org/10.1108/BIJ-04-2013-0048
Basar, A., Kabak, O., Topcu, I., & Bozkaya, B. (2015) Location analysis in banking: a new methodology and application for a Turkish bank. In H. A. Eiselt & V. Marianov (Eds.), Applications of location analysis (pp. 25–54). New York: Springer. https://doi.org/10.1007/978-3-319-20282-2_2
Batir, T. E., Volkman, D. A., & Gungor, B. (2017). Determinants of bank efficiency in Turkey: Participation banks versus conventional banks. Borsa Istanbul Review, 17(2), 86–96. https://doi.org/10.1016/j.bir.2017.02.003
Berger, A. N. (2007). International comparisons of banking efficiency. Financial Markets, Institutions & Instruments, 16(3), 119– 144. https://doi.org/10.1111/j.1468-0416.2007.00121.x
Berger, A. N., & Humphrey, D. B. (1997). Efficiency of financial institutions: international survey and directions for future research. European Journal of Operational Research, 98(2), 175–212. https://doi.org/10.1016/S0377-2217(96)00342-6 Bivand, R. S., Pebesma, E. J., & Gomez-Rubio, V. (2008). Applied spatial data analysis with R. New York: Springer.
Boďa, M. (2015). A slacks-based measure DEA methodology for identification of returns to scale in the Slovak banking sector.
Acta Universitatis Agriculturae et Silviculturae Mendelianae Brunensis, 63(6), 1847–1858. https://doi.org/10.1111
8/actaun201563061847
Boďa, M., Farkasovsky, V., & Zimkova, E. (2016). Technical efficiency and profitability in retail production of bank branches. 15th International Conference on Finance and Banking. Prague, the Czech Republic, 1–13.
Bogetoft, P., & Otto, L. (2011). Benchmarking with DEA, SFA, and R. New York: Springer. https://doi.org/10.1007/978-1-4419-7961-2
Boufonou, P. V. (1995). Evaluating bank branch location and performance - a case study. European Journal ofOperational
Research, 87(2), 389–402. https://doi.org/10.1016/0377-2217(92)00080-5
Buckley, P. J. (2004). Cartography and international business. International Business Review, 13(2), 239–255. https://doi.org/10.1016/j.ibusrev.2003.08.002
Camanho, A. S., & Dyson, R. G. (1999). Efficiency, size, benchmarks and targets for bank branches: an application of data envelopment analysis. Journal of the Operational Research Society, 50(9), 903–915. https://doi.org/10.1057/ palgrave.jors.2600792
Choudhry, M. (2012). The principles of banking. Singapore: Wiley. https://doi.org/10.1002/9781118826799
Coelli, T. J., Prasada Rao, D. S., O'Donnell, C. J., & Battese, G. E. (2005). An introduction to efficiency and productivity analysis. New York: Springer
Doan, A. T., Lin, K. L., & Doong, S. C. (2018). What drives bank efficiency? The interaction of bank income diversification and ownership. International Review of Economics & Finance, 55, 203–219. https://doi.org/10.1016/j.iref.2017.07.019
Fethi, M. D., & Pasiouras, F. (2010). Assessing bank efficiency and performance with operational research and artificial intelligence techniques: a survey. European Journal of Operational Research, 204(2), 189–198. https://doi.org/10.10 16/j.ejor.2009.08.003
Gimzauskiene, E., & Kloviene, R. (2011). Performance measurement system: Towards an institutional theory. Inzinerine
Ekonomika - Engineering Economics, 22(4), 338–344. https://doi.org/10.5755/j01.ee.22.4.709
Gimzauskiene, E., Kloviene, R., Stravinskiene, J., & Misiunas, D. (2016). Measuring performance: Case of Lithuanian municipalities. Inzinerine Ekonomika - Engineering Economics, 27(2), 213–220. https://doi.org/10.5755/j01.ee.27.2.14333 Giokas, D. I. (2008) Assessing the efficiency in operations of a large Greek bank branch network adopting different economic
behaviors. In Economic Modelling, 25(3), 559–574. https://doi.org/10.1016/j.econmod.2007.10.007 Greene, W. (2003). Economeric analysis. Upper Saddle River: Pearson.
Hastie, T., Tibshirani, R., & Friedman, J. (2001). The elements of statistical learning: data mining, inference, and prediction. New York: Springer. https://doi.org/10.1007/978-0-387-21606-5
Hollander, S., & Verriest, A. (2016). Bridging the gap: the design of bank loan contracts and distance. Journal of Financial
Economics, 119(2), 399–419. https://doi.org/10.1016/j.jfineco.2015.09.006
Hyranek, E., Grell, M., Nagy, L., & Durinova, I. (2018). The economic-mathematical nature of the HGN model concept as a tool for measuring performance of enterprises. Ekonomicky casopis, 66(3), 309–325.
Jagric, T., Bojnec, S., & Jagric, V. (2015). Optimized spiral spherical self-organizing map approach to sector analysis - the case of banking. Expert Systems with Applications, 42(13), 5531–5540. https://doi.org/10.1016/j.eswa.2015.03.002
Kocmanova, A., Pavlakova Docekalova, M., & Simanaviciene, Z. (2017). Corporate sustainability measurement and assessment of Czech manufacturing companies using a composite indicator. Inzinerine Ekonomika - EngineeringEconomics, 28(1), 88– 100. https://doi.org/10.5755/j01.ee.28.1.15323
Kocisova, K. (2012) Application of DEA models at the analysis of bank branches technical efficiency. In Ekonomicky časopis, 60(20), 169–186.
LaPlante, A. E., & Paradi, J. C. (2015). Evaluation of bank branch growth potential using data envelopment analysis. Omega, 52, 33-41. https://doi.org/10.1016/j.omega.2014.10.009
Mate-Sanchez, M., Hernandez, F. A. L., & Lacambra, J. M. (2012). Analyzing long-term average adjustment of financial ratios with spatial interactions. Economic Modelling, 29(4), 1370–1376. https://doi.org/10.1016/j.econmod.2012.03.001
Maronna, R. A., Martin, R. D., & Yohai, V. J. (2006) Robust statistics: theory and methods. Chichester: Wiley. https://doi.org/10.1002/0470010940
Nanda, R., & Nicholas, T. (2014). Did bank distress stifle innovation during the Great Depression? Journal of Financial
Economics, 114(2), 273–292. https://doi.org/10.1016/j.jfineco.2014.07.006
Paradi, J. C., Rouatt, S., & Zhu, H. (2011). Two-stage evaluation of bank branch efficiency using data envelopment analysis.
Omega, 39(1), 99–109. https://doi.org/10.1016/j.omega.2010.04.002
Paradi, J. C., & Zhu, H. (2013). A survey on bank branch efficiency and performance research with data envelopment analysis.
Omega, 41(1), 61–79. https://doi.org/10.1016/j.omega.2011.08.010
Portela, M. C. A. S., & Thanassoulis, E. (2007). Comparative efficiency analysis of Portuguese bank branches. EuropeanJournal
of Operational Research, 177(2), 850–866. https://doi.org/10.1016/j.ejor.2006.01.007
Pricewaterhouse Coopers. (2011). Getting to know you: building a customer-centric business model for retail banks. Available from internet: https://www.pwc.com/us/en/financial-services/publications/viewpoints/assets/viewpoint-retail-bank-custo mer- centric- business-model.pdf.
R Core Team. (2013). R: a language and environment for statistical computing. Vienna: R Foundation for Statistical Computing, Saglam, U. (2018). A two-stage performance assessment of utility-scale wind farms in Texas using data envelopment analysis
and Tobit models. Journal of Cleaner Production, 201, 580–598. https://doi.org/10.1016/j.jclepro.2018.08.034
Statistical Office of the Slovak Republic. (2015). Sprava o hospodarskom vyvoji v krajoch SR za rok 2014. [Report on economic development in the regions of the Slovak Republic for the year 2014, in Slovak]. Available from internet: http://www7.statistics.sk/PortalTraffic/fileServlet?Dokument =dc40016e-55a1-4a8f-9ff9-6622eac9fe83.
Sufian, F., & Habibullah, M. S. (2010). Does foreign banks entry fosters bank efficiency? Empirical evidence from Malaysia.
Inzinerine Ekonomika - Engineering Economics, 21(5), 464–474.
Sufian, F., & Kamarudin, F. (2014). Efficiency and returns to scale in the Bangladesh banking sector: Empirical evidence from the slack-based DEA method. Inzinerine Ekonomika - Engineering Economics, 25(5), 548–557. https://doi.org/10.575 5/j01.ee.25.5.5035
Tone, K. (2001) A slacks-based measure of efficiency in data envelopment analysis. European Journal of Operational Research, 130(3), 498–509. https://doi.org/10.1016/S0377-2217(99)00407-5
Tsolas, I. E. (2010). Modeling bank branch profitability and effectiveness by means of DEA. International Journal of Productivity
and Performance Management, 59 (5), 432–451. https://doi.org/10.1108/17410401011052878
Turner, H., Windle, R., & Dresner, M. (2004). North American containerport productivity: 1984–1997. TransportationResearch
Part E, 40(4), 339–356. https://doi.org/10.1016/j.tre.2003.06.001
Urban, B., & Joubert, G. C. D. S. (2017). Multidimensional and comparative study on intellectual capital and organisational performance. Journal of Business Economics and Management, 18(1), 84–99. https://doi.org/10.3846/16111699. 2016.1255990
Vance, H. (2000). Opportunity index development for bank branch networks. A thesis submitted at Graduate Department of Mechanical and Industrial Engineering University of Toronto. Available from internet: https://tspace.library. utoronto.ca/bitstream/1807/14392/1/MQ54116.pdf.
Wonnacott, T. H., & Wonnacott, R. J. (1981). Regression: a second course in statistics. New York: Wiley.
Yoo, S. H., & Seo, Y. W. (2017). Effect of supply chain structure and power dynamics on R&D and market performances. Journal
of Business Economics and Management, 18(3), 487–504. https://doi.org/10.3846/16111699.2017.1326979