Vol.9 (2019) No. 4
ISSN: 2088-5334
A Comparative Study between Collaborative Filtering Techniques and
Generate Personalized Story Recommendations for the Vixio
Application
Albert Darmawan
#1, Ida Bagus Kerthyayana Manuaba
*2Computer Science Department, School of Computer Science, Bina Nusantara University, Jakarta Selatan, 10270, Indonesia #
E-mail: #[email protected]; *[email protected]
Abstract— Interactive fiction (or text-based game) is a game that consists of texts which are used to bring interactivity to a story.
Interactive fiction shows the potential to improve reading behaviour and engage the player with reading materials. In continuing to explore more benefits in reading, creating, and sharing interactive fiction, a web application called Vixio is developed as a platform, where users can develop and distribute interactive fiction. To engage and to feed the users with more interactive stories, a recommender system is applied to provide recommendations of stories that would be suitable to the reader’s interest. This paper is focused on developing a recommender system which can generate personalized story recommendations for the Vixio web application. This paper also discusses determining which techniques are better to be implemented inside the recommender system by conducting a comparative study between five collaborative filtering techniques, which are: Three Matrix Factorizations (SVD, SVD++, and NMF), Slope One, and Co-clustering. To compare each technique with one another, 5-fold cross-validation and response time were measured. Based on these two evaluations, it is shown that there is no technique which has a superior accuracy over the others. However, Slope One algorithm is eminent in terms of fit time and mean response time.
Keywords— collaborative filtering; matrix factorization; slope one; co-clustering; vixio – interactive fiction platform.
I. INTRODUCTION
In 2017, there was an effort to use interactive fiction to improve reading behavior, specifically in Indonesia [1], [2]. According to Manuaba [1], interactive fiction shows potential to influence Indonesian youth to improve their reading behavior and engage with the reading materials. To continue this study, a robust and modern interactive fiction platform for creating and playing interactive fiction is necessary.
Currently, there are some existing interactive fiction platforms. One of them is textadventures.co.uk, a platform for the community to create and play interactive fiction [3]. The platform contains an open source visual editor to create interactive fiction called Quest [4]. However, several improvements are required to enhance the existing platforms in the development and distribution process of interactive fiction stories. To address these issues, the development of a robust and modern interactive fiction platform called Vixio is proposed. This platform is aimed to advance user experience in the development and distribution of interactive fiction stories.
Vixio is a web application where users can develop and distribute interactive fiction. Interactive fiction is a video
game genre that primarily consists of text, which is used to bring interactivity to a story [5]. To ensure that users can easily access relevant content, a robust recommender system which generates personalized story recommendations is necessary. A recommender system is a computer system which is capable of producing recommendations of items that each user prefers [6].
There is a lot of research today exploring the usage of a recommender system; some of theexamples is from Yun et. al.[7] that had developed an algorithm for a hybrid collaborative filtering recommendation system using opinion mining for purchase review using AWS data. Also there were also another research on hybrid recommendation system for MovieLens Data[8] and model recommendation system for finding similarities literature for publications[9]. These research have been successfully showed the art of recommender system in providing relevant information that important for the user in different real-life scenarios.
This research aims to implement a recommender system with a collaborative filtering technique to generate personalized story recommendations that can be used by
Vixio web services. Throughout the development process, a
This paper includes a review of existing recommender systems, the collaborative filtering and evaluation techniques employed, the implementation testing and results, and the discussion and conclusion of the study. This paper is started by discussing the background and the art of the works in the
Introduction part following by Existing Recommender System part and Collaborative Filtering Technique part that
support this research. The Evaluation Techniques part is presented after, followed by Design and Implementation part, which leading to Discussion and Conclusion parts.
II. MATERIAL AND METHODS
A. Existing Recommender System
Nowadays, a wide range of technology companies has been implementing sophisticated recommender systems to their products. Recommendations of music in Spotify and Pandora, movie suggestions in Netflix and YouTube, or even search recommendations in Google Search are some examples of recommender systems that are currently popular in the market.
Recommender systems are computer systems which are capable of producing recommendations of items that each user might like [6]. It is crucial as it increases the user experience and business value of a product. For example, a study indicates that Netflix gains more than $1B per year by implementing various recommender systems to their product [10].
Netflix is an internet entertainment company founded by Reed Hastings and Marc Randolph in 1997 [11]. During the first ten years, the company’s main business activity was offering online movie rentals [11]. In this time period, Netflix’s recommender system was simply predicting rating stars of a DVD that a person rented [10]. Nowadays, Netflix offers internet streaming worldwide, with approximately 140 million hours of daily movie viewership [11]. Due to data abundance, the recommender system of Netflix has become more complex.
Fig. 1 Development Workflow of Recommender System [10]
We could simplify the form of recommendation system through a problem formalization: Given a two-dimensional matrix of user ratings, where cell at uth row and ith column indicates a rating of item I for user u, find the missing cell values using a predictive model.
A recommender system generates the recommendation using many data sources from explicit data sets such as item ratings to implicit data sets such as user behaviors [12]. Due to data variety and complexity, there are many algorithms and machine learning approaches which can be used to produce a robust recommender system as in Figure 2 below.
Fig. 2 User Rating Matrix [6]
Generally, all available solutions are classified into three main categories [6],which are:
• Collaborative filtering. Collaborative filtering is a recommender system approach where item recommendations are generated by considering a certain user’s behavior and comparing it with other users’ behaviors that have some similarities.
• Content-based filtering. This filtering works by suggesting items that have similar contents based on previous user preferences. To determine the similarities value, an array of item features are previously defined.
• Hybrid approach. As the name implies, a hybrid approach is a combination of collaborative and content-based filtering. By combining these two approaches, the system considers both other users’ behaviors and item features.
B. Collaborative Filtering Techniques
In building a recommender system, we have utilized an approach called collaborative filtering techniques, which as mentioned previously, works by generating item recommendations that consider a certain user’s behavior and compares it with other users’ similar behaviors[6].
There are several collaborative filtering techniques available. To determine the most suitable technique for a Vixio recommender system, a comparative study of five collaborative filtering techniques was conducted, which are Three Matrix Factorizations (SVD, SVD++, and NMF), Slope One, and Co-clustering.
C. Matrix Factorization
Matrix factorization is an algorithm that decomposes a matrix into smaller matrices, making it easier to perform complex matrix operations [11]. Even so, it still requires a high computational cost, especially in an enormous matrix. Several systems have used the matrix factorization concept to develop robust collaborative filtering algorithms, mainly due to its capabilities to reveal latent features within the matrix [13]. There are some algorithms which are derived from matrix factorization. Below are the three types of matrix factorization techniques that have been implemented in this comparative study:
• Singular Value Decomposition (SVD)
• Singular Value Decomposition with implicit ratings (SVD++)
D. Slope One
Slope One is one of the collaborative filtering techniques which utilizes user ratings to make a prediction [14][15]. The implementation is relatively simple since the developer only needs to use the formula below to generate rating predictions:
̂ | |∑∈ , (1)
where r̂ ui is the rating prediction of item i given by user u,
μu is the mean of ratings given by user u, Ri(u) is a set of
item which is rated by user u and has one other common user with item i, and | Ri(u) | is the cardinality of Ri(u) set. Below
is the definition of dev(i,j):
,
| |∑
∈(2)
In this case, dev(i,j) is the average difference between the ratings of item I and item j.
E. Co-Clustering
Co-Clustering is a real-time collaborative filtering algorithm which utilizes ratings to make a rating prediction [16]. The computational cost to run co-clustering is lower than other collaborative filtering techniques such as matrix factorization [16]. This algorithm assigns users and items into user cluster, item cluster, and bicluster [17]. The rating prediction can be determined using the formula as found below:
!!!! " !!!! " # (3)
where u is user index, i is the item index, $% is the average rating of bi-cluster, $ is the average rating of i’s cluster, $% is the average rating of u’s cluster, μi is the mean of item i’s
ratings, and μu is the mean of ratings given by user u.
F. Evaluation Techniques
Because there is no real user that can access the web application, online evaluation such as A/B Testing cannot be conducted. With this limitation, we performed two offline evaluation techniques as follows:
G. K-Fold Cross Validation
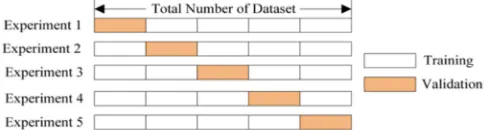
K-fold Cross Validation is a statistical method which is usually used to measure the performance of machine learning models [18]. The general idea of this methodology is to split all available data sets into K smaller sets (where K is a positive integer), also known as “folds” [19][20]. In performing every K experiment, one fold is used as test data, while the remaining K-1 folds are used as training data. The most important consideration when performing K-fold Cross Validation is that every fold must be used as a test data in exactly one experiment. The figure below shows how a 5-fold cross validation works:
Fig. 3 Example of 5-FoldCross-Validation
During the testing phase in each experiment, a comparison between the prediction generated by the model and the actual result in test data is conducted. By comparing these two values, the accuracy of the model’s predictions can be measured. There are many mathematical formulas to calculate the accuracy, some of which are the following:
• Root Mean Squared Error (RMSE)
RMAE *+∑+ , ,
-. (4)
• Mean Absolute Error (MAE)
MAE +∑ |,+ , |
. (5)
In both formulas, n is the number of data points, j is the iterator, , is the actual value, and , is the predicted value. These formulas produce negatively-oriented values [21]. In other words, a lower value indicates a higher model accuracy, with the ideal value equal to zero.
The value of k in a k-fold cross-validation procedure can vary depending on each situation. Essentially, there is no fixed rule on how to determine the right k value [18]. However, many data scientists assign k=5 or k=10 [18].
Implementing k-fold Cross Validation in a machine learning model can avoid overfitting, which is a condition where a model is only fit for a limited set of data points [19]. That is because, in every experiment, the model does not train using all available data.
H. Response Time
Response time is the total amount of time required for a system to produce a response from a certain request [22]. In this project, since we measured response time in the recommender system API, response time could be defined as the total time between the HTTP request and HTTP response. Response time is usually measured in seconds. In this context, a smaller value means a better system performance.
Many factors affect response time, including hardware specifications, speed of internet connection, database query time, and algorithms used. In this project, since all testing was conducted using the same hardware, internet connection, and database, algorithms were the sole factor which could be used to measure different response times between recommender system models.
We chose this metric because it was crucial for the overall user experience. A study conducted by DoubleClick (a Google subsidiary) indicates that to keep people engaged with a mobile site, it must be fast [23]. Otherwise, users will leave the site, resulting in decreased revenues.
I. Design and Implementation
1) Recommender System Architecture
Fig. 4 System Recommender Architecture
This layer consists of three major components, as follows:
a) API: This RESTful API is developed using a Flask
micro-framework. In the production server, the API receives an HTTP request from Back End Layer, then passes all available payloads to the recommendation engine. After the recommendation engine generates the appropriate recommendations, the API gives all recommendations through the HTTP response body.
b) Recommendation Engine: This component is the core
component of Recommender System Layer. As the name suggests, the recommendation engine provides robust recommendations based on an available data set.
c) MySQL Cursor: MySQL Cursor acts as a connector
between the recommendation engine and the MySQL Database, providing a relevant data set for the recommendation engine.
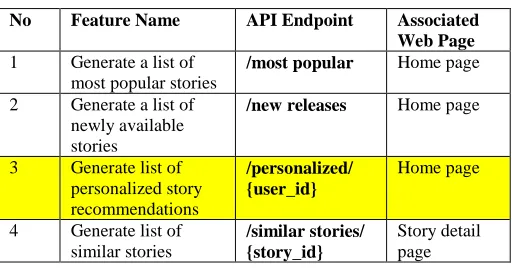
To deliver the best user experience to the Vixio user, the Vixio recommendation engine has four main features. Each of these features is associated with one API endpoint. The table below shows all of these features:
TABLEI
LIST OF FEATURES IN THE VIXIO RECOMMENDER SYSTEM
No Feature Name API Endpoint Associated Web Page
1 Generate a list of most popular stories
/most popular Home page 2 Generate a list of
newly available stories
/new releases Home page
3 Generate list of personalized story recommendations
/personalized/ {user_id}
Home page
4 Generate list of similar stories
/similar stories/ {story_id}
Story detail page
However, in this paper, we only focused on Collaborative Filtering Techniques to generate a list of personalized story recommendations for the user.
2) Use Case Diagram
Based on the system architecture above, we created the use case diagram to further depict the interaction between
the elements inside the system. The figure below shows the use case diagram of theVixio Recommender System:
Fig. 5 Use Case Diagram of Vixio Recommender System
Based on the Use Case diagram, there are two main actors in the system. They are (1) the Vixio Web Services, which represents the Back End Layer of Vixio and acts as a receiver of generated recommendations and (2) the Recommendation Engine, which represents the Recommender System Layer of Vixio that generates various recommendations. Both actors are connected with all four use cases. These four use cases represent the four features which have been discussed previously.
3) Activity Diagram
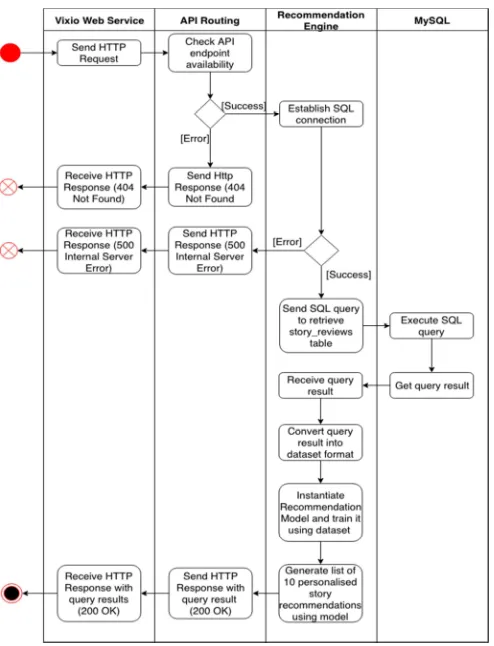
Based on the use case, there will be four activity diagrams based on each feature to depict the flow within the system. However, in addressing the main objective of this paper, we only focused on the activity diagrams for personalized story recommendations:
To generate a list of personalized story recommendations, the process starts when the Vixio Web Service sends an HTTP request to API routing at the Recommender System Layer. The API routing will check whether the endpoint is available. In this case, the endpoint is “/personalized/{user_id}”. If the endpoint is not available, then the API routing will return an HTTP response with the Status Code 404 (Not Found). Otherwise, the API routing will start the recommendation engine.
Fig. 6 Activity Diagram of Personalized Story Recommendations 4) Algorithms for the Recommender System
As mentioned previously, there are many algorithms which can be used in each feature. In this paper we focused on Collaborative Filtering algorithms that are suitable for generating personalized story recommendations.
The idea of this feature is to generate a list of stories based on users’ reading behavior. In this project, reading behavior manifests itself in a story_reviews table. This SQL table represents two things, which are the relationship between each user to each story and a story’s likeability as indicated by an integer rating between 1 to 5 (inclusive).
This problem can be solved using collaborative filtering. Since this feature generates personalized story recommendations for each user, we implemented a user-based collaborative filtering. In this project, five algorithms could be implemented as an attempt to solve this problem:
• Matrix Factorization – SVD
• Matrix Factorization – SVD++
• Matrix Factorization – NMF
• Slope One
• Co-Clustering
We decided to use matrix factorization since it is capable of detecting latent features in the relationship between the user and the story [13]. Since there are many matrix factorization techniques, we implemented three relatively popular techniques, which are SVD (Singular Value Decomposition), SVD++ (Singular Value Decomposition with implicit ratings), and NMF (Non-negative Matrix Factorization).
For comparison purposes, we also decided to implement techniques other than matrix factorization, which are Slope One and Co-Clustering. Slope One is a simple yet relatively
accurate technique [14], and so we observed its performance against matrix factorization techniques as listed above. Co-Clustering is a robust technique that has a lower computational cost than that of the typical matrix factorization technique, and is capable to handle dynamic data [16], which means it is effective for real-time collaborative filtering.
III.RESULT AND DISCUSSION
To conduct the comparative study, we implemented all five collaborative filtering techniques using the Python programming environment. Here are the list of Python packages/frameworks which were used:
TABLEII LIST OF PYTHON PACKAGES
No Package Name Version
1 Numpy 1.14.2
2 SciPy 1.0.0
3 Pandas 0.22.0
4 Flask 1.0.2
5 Flask-mysql 1.4.0
6 Flask-restful 0.3.6
7 Pytest 3.5.1
8 Scikit-surprise 1.0.5
9 Scikit-learn 0.19.1
All of these techniques are accessible through REST API endpoints, which enable them to connect with the Vixio web application through an HTTP request.
Since the Vixio web application was still in the initial stage of deployment, we did not possess any real user data yet. Consequently, for this paper we generated random users data automatically for development and testing purposes. In the end, three SQL tables were generated:
TABLEIII LIST OF SQLTABLES
No Table Name Description
1 users All user-related information 2 stories All story-related information 3 story reviews Ratings that users assigned to stories
To fill the users and story review table, we simply wrote a script to generate some random values for each row, with some constraints predefined. In order to fill the stories table, we manually curated a list of Indonesian folklore titles with their metadata.
To run this entire project, we used a computer with the following specifications:
TABLEIV COMPUTER SPECIFICATION
Specification Detail
Processor 2.9 GHz Intel Core i7
RAM 16 GB 2133 MHz LPDDR3
Disk Space 500 GB Flash Storage
Graphics Intel HD Graphics 630 1536 MB OS macOS High Sierra Version 10.13.3
A. 5-Fold Cross Validation
200, 300, 400, and 500 users. During the 5-fold cross validation process, four main parameters were measured:
TABLEV
MEASURED PARAMETERS DURING 5-FOLD CROSS VALIDATION
No Parameter Description
1 Root Square Meter
Evaluates the difference between real values and predicted values using the Root Mean Squared Error formula 2 Mean
Absolute Error
Evaluates the difference between real values and predicted values using the Mean Absolute Error formula 3 Fit Time Total time to train the model using the
training data set. Measured in seconds 4 Test Time Total time to test the model using the test
data set. Measured in seconds
Here are the results for each parameter:
TABLEVI
ROOT MEAN SQUARED ERROR COMPARISON
Users Matrix Factorization Slope One
Co-Clustering SVD SVD++ NMF
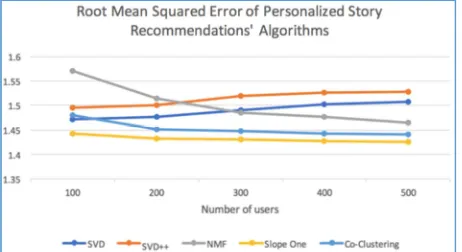
100 1.4709 1.4709 1.5707 1.4430 1.4797 200 1.4772 1.5012 1.5135 1.4326 1.4517 300 1.4906 1.5202 1.4856 1.4304 1.4485 400 1.5026 1.5264 1.4761 1.4275 1.4429 500 1.5074 1.5287 1.4652 1.4262 1.4415
The table above shows the root mean squared error of Three Matrix Factorization techniques, Slope One, and Co-clustering, corresponding to 100, 200, 300, 400, and 500 users. Since the value in each cell represents error value, a lower value indicates better performance. To observe the correlation between the number of users and the error value of each algorithm, the table above is represented as a line chart below:
Fig. 7 Graph of RMSE of Personalized Story Recommendations Algorithms
TABLEVII
MEAN ABSOLUTE ERROR COMPARISON
Users Matrix Factorization Slope One Co-Clustering SVD SVD++ NMF
100 1.2659 1.2792 1.3275 1.2450 1.2720 200 1.2689 1.2829 1.2930 1.2363 1.2543 300 1.2784 1.2982 1.2739 1.2336 1.2528 400 1.2857 1.2989 1.2693 1.2303 1.2479 500 1.2872 1.3012 1.2623 1.2294 1.2460
The table above shows the mean absolute error of Three Matrix Factorization techniques, Slope One, and
Co-clustering, with the corresponding number of users. Since the value in each cell represents an error value, a lower value indicates a better performance. To observe the correlation between the number of users and the error value of each algorithm, the table above is represented as a line chart below:
Fig. 8 Graph of MAE of Personalized Story Recommendations Algorithms TABLEVIII
FIT TIME COMPARISON (IN SECONDS)
Users Matrix Factorization Slope One
Co-Clustering SVD SVD++ NMF
100 0.63 13.63 0.58 0.03 0.12
200 1.14 27.56 1.17 0.06 0.24
300 1.69 77.49 1.75 0.10 0.35
400 2.00 48.34 2.03 0.12 0.43
500 2.47 60.44 2.54 0.14 0.54
The table above shows the fit time of three matrix factorization techniques, Slope One, and Co-clustering, with the corresponding 100, 200, 300, 400, and 500 users. To clearly observe the correlation between the number of users and the fit time of each algorithm, the table above can be represented as the line chart below:
Fig. 9 Graph of Fit Time in Personalized Story Recommendation Algorithms
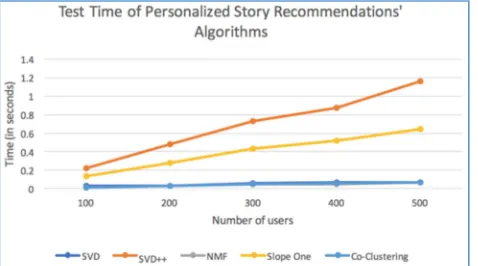
TABLEIX
TEST TIME COMPARISON (IN SECONDS)
Users Matrix Factorization Slope One
Co-Clustering SVD SVD++ NMF
100 0.03 0.22 0.01 0.14 0.01
200 0.03 0.48 0.03 0.28 0.03
300 0.06 0.73 0.05 0.43 0.05
400 0.07 0.87 0.05 0.52 0.06
The table above shows the test time of 3 matrix factorization techniques, Slope One, and Co-clustering, with 100, 200, 300, 400, and 500 users. To clearly observe the correlation between the number of users and the test time of each algorithm, the table above is represented as a line chart as follows:
Fig. 10 Graph of Test Time in Personalized Story Recommendation Algorithms
For every technique, we performed 5 response time testings using Postman, with 250 stories and 500 users in the database. Here are the response time results for each algorithm (all response times written in ms):
TABLEX
RESPONSE TIME COMPARISON (IN MILLISECONDS)
Test Number
Matrix Factorization Slope One
Co-Clustering SVD SVD++ NMF
1 4378 94563 4438 1586 2002
2 4252 92130 4325 1482 1936
3 4467 90778 4341 1525 1901
4 4372 91271 4508 1480 1907
5 4391 90576 4470 1481 1861
Mean 4372 91863.6 4416.4 1510.8 1921.4
As mentioned previously, the idea of this feature is to provide personalized story recommendations to each user, resulting in specificity and relevance. To implement this idea, we used collaborative filtering, which provides recommendations based on user preferences, in comparison with other users’ preferences. Using this approach, the generated recommendation list utilized user data, hence providing non-assumptive results. Due to the requirement of accessing the user history, the user needs to log on to the system in order for the system to provide personalized story recommendations.
In this project, we implemented and tested five different collaborative filtering techniques using a 5-fold cross-validation procedure. Based on the 5-fold cross-cross-validation results, there are some important insights which can be gathered:
• Generally, the value of Root Mean Squared Error is larger than the value of the Mean Absolute Error. This is an expected behavior, since the Root Mean Squared Error formula penalizes large errors significantly with its squaring calculation.
• Overall, all algorithms have Root Mean Squared Error values between 1.4 and 1.6 and Mean Absolute Error values between 1.2 and 1.4. It showed that none of
algorithms perform significantly better compare to the others.
• For all algorithms, as the numbers of users increase, the fit time and test time also increase. This is of course an expected behavior.
• Compared to other algorithms, the Slope One algorithm has the fastest fit time at all variations in the number of users. One major reason is that Slope One has a simple and straightforward implementation.
• Compared to other algorithms, SVD++ algorithm has the slowest fit time and test time at all variations in the number of users. One major reason is because SVD++ is a complex algorithm, which combines SVD with additional calculations for implicit ratings.
• NMF and Co-clustering are two algorithms with the fastest test time. NMF test time, however, is faster than Co-clustering test time by 0.01 when the number of users reaches up to 400.
We also performed response time measurements for all the five techniques. Based on the results, Slope One has the fastest mean response time while SVD++ has the slowest mean response time.
IV.CONCLUSION
Based on the results, the accuracy of all the five techniques evaluated in this comparative study is relatively similar. Slope One algorithm, however, is eminent in terms of fit time and mean response time. In the end, we decided to use Slope One as a collaborative filtering technique implemented for the Vixio web application. We realized that there are numerous actions which can be done to produce a better recommender system. Analyzing real data from real users after the web application has been launched, exploring more collaborative filtering techniques, and scaling the infrastructure to support big data are some of the future actions which can be done.
Based on this research, there are still a lot of improvement for future works which can be done to enhance Vixio’s recommendation system layer, such as: (1) use more real data from users to improve the accuracy and minimalize the error rate for the recommendation process, (2) explore more recommendation techniques for other alternatives, and (3) scalable data architecture and bid data supports for further implementation.
REFERENCES
[1] I. B. K. Manuaba, “Text-Based Games as Potential Media for Improving Reading Behaviour in Indonesia,” in Procedia Computer Science, 2017, vol. 116, pp. 214–221.
[2] A. Darmawan, S. Valdo, I. Ignatius, and I. B. K. Manuaba, “A Comparative Study Between Narrative Fiction and Interactive Fiction to Enhance Youth Literacy in Indonesia,” in 11th Annual International Conference on Computer Games Multimedia and Allied Technologies (CGAT 2018), 2018, pp. 15–21.
[3] Textadventures, “textadventures.co.uk - Create and play text adventure games,” textadventures, 2018.
[4] textadventures.co.uk, “Quest - Write text adventure games and interactive stories.” .
[5] Inform, “About Interactive Fiction: Inform,” Inform, 2018. . [6] P. Melville and V. Sindhwani, “Recommender Systems,” Encycl.
Mach. Learn., no. 338, pp. 829–838, 2011.
on purchase review,” J. Inf. Sci., vol. 44, no. 3, pp. 331–344, Jun. 2018.
[8] U. Kuzelewska, “Clustering Algorithms in Hybrid Recommender System on MovieLens Data,” Stud. Logic, Gramm. Rhetor., vol. 37, no. 1, pp. 125–139, Aug. 2014.
[9] K. Haruna, M. Akmar Ismail, D. Damiasih, J. Sutopo, and T. Herawan, “A collaborative approach for research paper recommender system,” PLoS One, vol. 12, no. 10, p. e0184516, Oct. 2017. [10] C. A. Gomez-Uribe and N. Hunt, “The Netflix Recommender
System,” ACM Trans. Manag. Inf. Syst., vol. 6, no. 4, pp. 1–19, Dec. 2015.
[11] J. Brownlee, “A Gentle Introduction to Matrix Factorization for Machine Learning,” Linear Algebra, 2018. .
[12] G. Li and Q. Chen, “Exploiting Explicit and Implicit Feedback for Personalized Ranking,” Math. Probl. Eng., vol. 2016, pp. 1–11, Jan. 2016.
[13] D. Bokde, S. Girase, and D. Mukhopadhyay, “Matrix Factorization Model in Collaborative Filtering Algorithms: A Survey,” Procedia Comput. Sci., vol. 49, pp. 136–146, Jan. 2015.
[14] D. Lemire and A. Maclachlan, “Slope One Predictors for Online Rating-Based Collaborative Filtering,” in Proceedings of the 2005 SIAM International Conference on Data Mining, Philadelphia, PA: Society for Industrial and Applied Mathematics, 2005, pp. 471–475. [15] N. Hug, “Slope One,” Surprise, 2015. .
[16] T. George and S. Merugu, “A Scalable Collaborative Filtering Framework Based on Co-Clustering,” in Fifth IEEE International Conference on Data Mining (ICDM’05), 2005, pp. 625–628. [17] N. Hug, “Co-clustering,” Surprise, 2015. .
[18] J. Brownlee, “A Gentle Introduction to k-fold Cross-Validation,” Statistical Methods, 2018. .
[19] Scikit-learn developers, “Cross-validation: evaluating estimator performance,” scikit learn, 2017. .
[20] D. Becker, “Cross-Validation | Kaggle,” Kaggle, 2018. .
[21] J. Wesner, “MAE and RMSE — Which Metric is Better?,” Medium - Human in a Machine World, 2016. .
[22] Techopedia, “Response Time,” Techopedia, 2018. .
![Fig. 1 Development Workflow of Recommender System [10]](https://thumb-us.123doks.com/thumbv2/123dok_us/9972925.1985639/2.595.345.508.61.212/fig-development-workflow-of-recommender-system.webp)