V
OLUMEN
O.
9
(2019),
I
SSUEN
O.
10
(O
CTOBER)
ISSN
2231-5756
A Monthly Double-Blind Peer Reviewed (Refereed/Juried) Open Access International e-Journal - Included in the International Serial Directories
Indexed & Listed at:
Ulrich's Periodicals Directory ©, ProQuest, U.S.A., Cabell’s Directories of Publishing Opportunities, U.S.A., Google Scholar, Indian Citation Index (ICI), J-Gage, India [link of the same is duly available at Inflibnet of University Grants Commission (U.G.C.)],
Index Copernicus Publishers Panel, Poland with IC Value of 5.09 (2012) & number of libraries all around the world.
V
OLUMEN
O.
9
(2019),
I
SSUEN
O.
10
(O
CTOBER)
ISSN
2231-5756
CONTENTS
Sr.
No.
TITLE & NAME OF THE AUTHOR (S)
Page
No.
1.
A STUDY ON THE IMPACT OF THE CHILI MARKET ON THE PEOPLE OF
BYADGI REGION, KARNATAKA, INDIA
Dr. GURUBASAVARYA HIREMATH & SUNITA
1
2.
PERCEPTION OF INSTITUTIONAL CUSTOMERS’ TOWARDS COURIER
SERVICES IN TAMILNADU
Dr. S. SELVAKUMAR
8
3.
A STUDY ON ASSESSING THE EFFECTIVENESS OF INTERNAL AUDIT
PRACTICE IN PUBLIC DEVELOPMENTAL AGENCIES IN ETHIOPIA WITH
REFERENCE TO DEVELOPMENT BANK OF ETHIOPIA
SEFIWSEW ZELEKE BELAY
15
V
OLUMEN
O.
9
(2019),
I
SSUEN
O.
10
(O
CTOBER)
ISSN
2231-5756
FOUNDER PATRON
Late Sh. RAM BHAJAN AGGARWAL
Former State Minister for Home & Tourism, Government of Haryana
Former Vice-President, Dadri Education Society, Charkhi Dadri
Former President, Chinar Syntex Ltd. (Textile Mills), Bhiwani
CO-ORDINATOR
Dr. BHAVET
Former Faculty, Shree Ram Institute of Engineering & Technology, Urjani
ADVISOR
Prof. S. L. MAHANDRU
Principal (Retd.), Maharaja Agrasen College, Jagadhri
EDITOR
Dr. PARVEEN KUMAR
Professor, Department of Computer Science, NIMS University, Jaipur
CO-EDITOR
Dr. A. SASI KUMAR
Professor, Vels Institute of Science, Technology & Advanced Studies (Deemed to be University), Pallavaram
EDITORIAL ADVISORY BOARD
Dr. S. P. TIWARI
Head, Department of Economics & Rural Development, Dr. Ram Manohar Lohia Avadh University, Faizabad
Dr. CHRISTIAN EHIOBUCHE
Professor of Global Business/Management, Larry L Luing School of Business, Berkeley College, USA
Dr. SIKANDER KUMAR
Vice Chancellor, Himachal Pradesh University, Shimla, Himachal Pradesh
Dr. JOSÉ G. VARGAS-HERNÁNDEZ
Research Professor, University Center for Economic & Managerial Sciences, University of Guadalajara,
Guadala-jara, Mexico
Dr. TEGUH WIDODO
Dean, Faculty of Applied Science, Telkom University, Bandung Technoplex, Jl. Telekomunikasi, Indonesia
Dr. M. S. SENAM RAJU
Professor, School of Management Studies, I.G.N.O.U., New Delhi
Dr. A SAJEEVAN RAO
Professor & Director, Accurate Institute of Advanced Management, Greater Noida
Dr. D. S. CHAUBEY
Professor & Dean (Research & Studies), Uttaranchal University, Dehradun
Dr. CLIFFORD OBIYO OFURUM
Professor of Accounting & Finance, Faculty of Management Sciences, University of Port Harcourt, Nigeria
Dr. KAUP MOHAMED
Dean & Managing Director, London American City College/ICBEST, United Arab Emirates
Dr. VIRENDRA KUMAR SHRIVASTAVA
Director, Asia Pacific Institute of Information Technology, Panipat
Dr. MIKE AMUHAYA IRAVO
Principal, Jomo Kenyatta University of Agriculture & Tech., Westlands Campus, Nairobi-Kenya
Dr. SYED TABASSUM SULTANA
Principal, Matrusri Institute of Post Graduate Studies, Hyderabad
Dr. BOYINA RUPINI
Director, School of ITS, Indira Gandhi National Open University, New Delhi
Dr. NEPOMUCENO TIU
V
OLUMEN
O.
9
(2019),
I
SSUEN
O.
10
(O
CTOBER)
ISSN
2231-5756
Dr. SANJIV MITTAL
Professor & Dean, University School of Management Studies, GGS Indraprastha University, Delhi
Dr. RAJENDER GUPTA
Convener, Board of Studies in Economics, University of Jammu, Jammu
Dr. SHIB SHANKAR ROY
Professor, Department of Marketing, University of Rajshahi, Rajshahi, Bangladesh
Dr. SRINIVAS MADISHETTI
Professor, School of Business, Mzumbe University, Tanzania
Dr. NAWAB ALI KHAN
Professor & Dean, Faculty of Commerce, Aligarh Muslim University, Aligarh, U.P.
MUDENDA COLLINS
Head, Operations & Supply Chain, School of Business, The Copperbelt University, Zambia
Dr. EGWAKHE A. JOHNSON
Professor & Director, Babcock Centre for Executive Development, Babcock University, Nigeria
Dr. A. SURYANARAYANA
Professor, Department of Business Management, Osmania University, Hyderabad
P. SARVAHARANA
Asst. Registrar, Indian Institute of Technology (IIT), Madras
Dr. MURAT DARÇIN
Associate Dean, Gendarmerie and Coast Guard Academy, Ankara, Turkey
Dr. ABHAY BANSAL
Head, Department of Information Technology, Amity School of Engg. & Tech., Amity University, Noida
Dr. YOUNOS VAKIL ALROAIA
Head of International Center, DOS in Management, Semnan Branch, Islamic Azad University, Semnan, Iran
WILLIAM NKOMO
Asst. Head of the Department, Faculty of Computing, Botho University, Francistown, Botswana
Dr. JAYASHREE SHANTARAM PATIL (DAKE)
Faculty in Economics, KPB Hinduja College of Commerce, Mumbai
SHASHI KHURANA
Associate Professor, S. M. S. Khalsa Lubana Girls College, Barara, Ambala
Dr. SEOW TA WEEA
Associate Professor, Universiti Tun Hussein Onn Malaysia, Parit Raja, Malaysia
Dr. OKAN VELI ŞAFAKLI
Professor & Dean, European University of Lefke, Lefke, Cyprus
Dr. MOHENDER KUMAR GUPTA
Associate Professor, Government College, Hodal
Dr. BORIS MILOVIC
Associate Professor, Faculty of Sport, Union Nikola Tesla University, Belgrade, Serbia
Dr. LALIT KUMAR
Course Director, Faculty of Financial Management, Haryana Institute of Public Administration, Gurugram
Dr. MOHAMMAD TALHA
Associate Professor, Department of Accounting & MIS, College of Industrial Management, King Fahd University
of Petroleum & Minerals, Dhahran, Saudi Arabia
Dr. V. SELVAM
Associate Professor, SSL, VIT University, Vellore
Dr. IQBAL THONSE HAWALDAR
Associate Professor, College of Business Administration, Kingdom University, Bahrain
Dr. PARDEEP AHLAWAT
Associate Professor, Institute of Management Studies & Research, Maharshi Dayanand University, Rohtak
Dr. ALEXANDER MOSESOV
V
OLUMEN
O.
9
(2019),
I
SSUEN
O.
10
(O
CTOBER)
ISSN
2231-5756
Dr. ASHOK KUMAR CHAUHAN
Reader, Department of Economics, Kurukshetra University, Kurukshetra
Dr. BHAVET
Former Faculty, Shree Ram Institute of Engineering & Technology, Urjani
YU-BING WANG
Faculty, department of Marketing, Feng Chia University, Taichung, Taiwan
SURJEET SINGH
Faculty, Department of Computer Science, G. M. N. (P.G.) College, Ambala Cantt.
Dr. TITUS AMODU UMORU
Professor, Kwara State University, Kwara State, Nigeria
Dr. RAJESH MODI
Faculty, Yanbu Industrial College, Kingdom of Saudi Arabia
Dr. SAMBHAVNA
Faculty, I.I.T.M., Delhi
Dr. THAMPOE MANAGALESWARAN
Faculty, Vavuniya Campus, University of Jaffna, Sri Lanka
Dr. SHIVAKUMAR DEENE
Faculty, Dept. of Commerce, School of Business Studies, Central University of Karnataka, Gulbarga
SURAJ GAUDEL
BBA Program Coordinator, LA GRANDEE International College, Simalchaur - 8, Pokhara, Nepal
FORMER TECHNICAL ADVISOR
AMITA
FINANCIAL ADVISORS
DICKEN GOYAL
Advocate & Tax Adviser, Panchkula
NEENA
Investment Consultant, Chambaghat, Solan, Himachal Pradesh
LEGAL ADVISORS
JITENDER S. CHAHAL
Advocate, Punjab & Haryana High Court, Chandigarh U.T.
CHANDER BHUSHAN SHARMA
Advocate & Consultant, District Courts, Yamunanagar at Jagadhri
SUPERINTENDENT
V
OLUMEN
O.
9
(2019),
I
SSUEN
O.
10
(O
CTOBER)
ISSN
2231-5756
CALL FOR MANUSCRIPTS
We invite unpublished novel, original, empirical and high quality research work pertaining to the recent developments & practices in the areas of Com-puter Science & Applications; Commerce; Business; Finance; Marketing; Human Resource Management; General Management; Banking; Economics; Tourism Administration & Management; Education; Law; Library & Information Science; Defence & Strategic Studies; Electronic Science; Corporate Gov-ernance; Industrial Relations; and emerging paradigms in allied subjects like Accounting; Accounting Information Systems; Accounting Theory & Practice; Auditing; Behavioral Accounting; Behavioral Economics; Corporate Finance; Cost Accounting; Econometrics; Economic Development; Economic History; Financial Institutions & Markets; Financial Services; Fiscal Policy; Government & Non Profit Accounting; Industrial Organization; International Economics & Trade; International Finance; Macro Economics; Micro Economics; Rural Economics; Co-operation; Demography: Development Planning; Development Studies; Applied Economics; Development Economics; Business Economics; Monetary Policy; Public Policy Economics; Real Estate; Regional Economics; Political Science; Continuing Education; Labour Welfare; Philosophy; Psychology; Sociology; Tax Accounting; Advertising & Promotion Management; Management Information Systems (MIS); Business Law; Public Responsibility & Ethics; Communication; Direct Marketing; E-Commerce; Global Business; Health Care Administration; Labour Relations & Human Resource Management; Marketing Research; Marketing Theory & Applications; Non-Profit Or-ganizations; Office Administration/Management; Operations Research/Statistics; Organizational Behavior & Theory; Organizational Development; Pro-duction/Operations; International Relations; Human Rights & Duties; Public Administration; Population Studies; Purchasing/Materials Management; Re-tailing; Sales/Selling; Services; Small Business Entrepreneurship; Strategic Management Policy; Technology/Innovation; Tourism & Hospitality; Transpor-tation Distribution; Algorithms; Artificial Intelligence; Compilers & Translation; Computer Aided Design (CAD); Computer Aided Manufacturing; Computer Graphics; Computer Organization & Architecture; Database Structures & Systems; Discrete Structures; Internet; Management Information Systems; Mod-eling & Simulation; Neural Systems/Neural Networks; Numerical Analysis/Scientific Computing; Object Oriented Programming; Operating Systems; Pro-gramming Languages; Robotics; Symbolic & Formal Logic; Web Design and emerging paradigms in allied subjects.
Anybody can submit the soft copy of unpublished novel; original; empirical and high quality research work/manuscriptanytime in M.S. Word format
after preparing the same as per our GUIDELINES FOR SUBMISSION; at our email address i.e. [email protected] or online by clicking the link online
submission as given on our website (FOR ONLINE SUBMISSION, CLICK HERE).
GUIDELINES FOR SUBMISSION OF MANUSCRIPT
1. COVERING LETTER FOR SUBMISSION:
DATED: _____________
THE EDITOR
IJRCM
Subject: SUBMISSION OF MANUSCRIPT IN THE AREA OF______________________________________________________________.
(e.g. Finance/Mkt./HRM/General Mgt./Engineering/Economics/Computer/IT/ Education/Psychology/Law/Math/other, please specify)
DEAR SIR/MADAM
Please find my submission of manuscript titled ‘___________________________________________’ for likely publication in one of your journals.
I hereby affirm that the contents of this manuscript are original. Furthermore, it has neither been published anywhere in any language fully or partly, nor it is under review for publication elsewhere.
I affirm that all the co-authors of this manuscript have seen the submitted version of the manuscript and have agreed to inclusion of their names as co-authors.
Also, if my/our manuscript is accepted, I agree to comply with the formalities as given on the website of the journal. The Journal has discretion to publish our contribution in any of its journals.
NAME OF CORRESPONDING AUTHOR : Designation/Post* : Institution/College/University with full address & Pin Code : Residential address with Pin Code : Mobile Number (s) with country ISD code : Is WhatsApp or Viber active on your above noted Mobile Number (Yes/No) : Landline Number (s) with country ISD code : E-mail Address : Alternate E-mail Address : Nationality :
* i.e. Alumnus (Male Alumni), Alumna (Female Alumni), Student, Research Scholar (M. Phil), Research Scholar (Ph. D.), JRF, Research Assistant, Assistant
Lecturer, Lecturer, Senior Lecturer, Junior Assistant Professor, Assistant Professor, Senior Assistant Professor, Co-ordinator, Reader, Associate
V
OLUMEN
O.
9
(2019),
I
SSUEN
O.
10
(O
CTOBER)
ISSN
2231-5756
NOTES:
a) The whole manuscript has to be in ONE MS WORD FILE only, which will start from the covering letter, inside the manuscript. pdf. version is liable to be rejected without any consideration.
b) The sender is required to mention the following in the SUBJECT COLUMNof the mail:
New Manuscript for Review in the area of (e.g. Finance/Marketing/HRM/General Mgt./Engineering/Economics/Computer/IT/ Education/Psychology/Law/Math/other, please specify)
c) There is no need to give any text in the body of the mail, except the cases where the author wishes to give any specific message
w.r.t. to the manuscript.
d) The total size of the file containing the manuscript is expected to be below 1000 KB.
e) Only the Abstract will not be considered for review and the author is required to submit the complete manuscript in the first instance.
f) The journal gives acknowledgement w.r.t. the receipt of every email within twenty-four hours and in case of non-receipt of acknowledgment from the journal, w.r.t. the submission of the manuscript, within two days of its submission, the corresponding author is required to demand for the same by sending a separate mail to the journal.
g) The author (s) name or details should not appear anywhere on the body of the manuscript, except on the covering letter and the cover page of the manuscript, in the manner as mentioned in the guidelines.
2. MANUSCRIPT TITLE: The title of the paper should be typed in bold letters, centeredand fully capitalised.
3. AUTHOR NAME (S) & AFFILIATIONS: Author (s) name, designation, affiliation (s), address, mobile/landline number (s), and email/al-ternate email address should be given underneath the title.
4. ACKNOWLEDGMENTS: Acknowledgements can be given to reviewers, guides, funding institutions, etc., if any.
5. ABSTRACT: Abstract should be in fully Italic printing, ranging between 150 to 300 words. The abstract must be informative and eluci-dating the background, aims, methods, results & conclusion in a SINGLE PARA. Abbreviations must be mentioned in full.
6. KEYWORDS: Abstract must be followed by a list of keywords, subject to the maximum of five. These should be arranged in alphabetic order separated by commas and full stop at the end. All words of the keywords, including the first one should be in small letters, except special words e.g. name of the Countries, abbreviations etc.
7. JEL CODE: Provide the appropriate Journal of Economic Literature Classification System code (s). JEL codes are available at www.aea-web.org/econlit/jelCodes.php. However, mentioning of JEL Code is not mandatory.
8. MANUSCRIPT: Manuscript must be in BRITISH ENGLISH prepared on a standard A4 size PORTRAIT SETTING PAPER. It should be free
from any errors i.e. grammatical, spelling or punctuation. It must be thoroughly edited at your end.
9. HEADINGS: All the headings must be bold-faced, aligned left and fully capitalised. Leave a blank line before each heading. 10. SUB-HEADINGS: All the sub-headings must be bold-faced, aligned left and fully capitalised.
11. MAIN TEXT:
THE MAIN TEXT SHOULD FOLLOW THE FOLLOWING SEQUENCE:
INTRODUCTION REVIEW OF LITERATURE
NEED/IMPORTANCE OF THE STUDY STATEMENT OF THE PROBLEM OBJECTIVES
HYPOTHESIS (ES)
RESEARCH METHODOLOGY RESULTS & DISCUSSION FINDINGS
RECOMMENDATIONS/SUGGESTIONS CONCLUSIONS
LIMITATIONS
SCOPE FOR FURTHER RESEARCH REFERENCES
APPENDIX/ANNEXURE
V
OLUMEN
O.
9
(2019),
I
SSUEN
O.
10
(O
CTOBER)
ISSN
2231-5756
12. FIGURES & TABLES: These should be simple, crystal CLEAR, centered, separately numbered & self-explained, and the titles must be above the table/figure. Sources of data should be mentioned below the table/figure. It should be ensured that the tables/figures are
referred to from the main text.
13. EQUATIONS/FORMULAE: These should be consecutively numbered in parenthesis, left aligned with equation/formulae number placed at the right. The equation editor provided with standard versions of Microsoft Word may be utilised. If any other equation editor is utilised, author must confirm that these equations may be viewed and edited in versions of Microsoft Office that does not have the editor.
14. ACRONYMS: These should not be used in the abstract. The use of acronyms is elsewhere is acceptable. Acronyms should be defined on its first use in each section e.g. Reserve Bank of India (RBI). Acronyms should be redefined on first use in subsequent sections. 15. REFERENCES: The list of all references should be alphabetically arranged. The author (s) should mention only the actually utilised
references in the preparation of manuscript and they may follow Harvard Style of Referencing. Also check to ensure that everything that you are including in the reference section is duly cited in the paper. The author (s) are supposed to follow the references as per the following:
All works cited in the text (including sources for tables and figures) should be listed alphabetically. Use (ed.) for one editor, and (ed.s) for multiple editors.
When listing two or more works by one author, use --- (20xx), such as after Kohl (1997), use --- (2001), etc., in chronologically ascending order.
Indicate (opening and closing) page numbers for articles in journals and for chapters in books.
The title of books and journals should be in italic printing. Double quotation marks are used for titles of journal articles, book chapters, dissertations, reports, working papers, unpublished material, etc.
For titles in a language other than English, provide an English translation in parenthesis.
Headers, footers, endnotes and footnotes should not be used in the document. However, you can mention short notes to elucidate some specific point, which may be placed in number orders before the references.
PLEASE USE THE FOLLOWING FOR STYLE AND PUNCTUATION IN REFERENCES: BOOKS
Bowersox, Donald J., Closs, David J., (1996), "Logistical Management." Tata McGraw, Hill, New Delhi. Hunker, H.L. and A.J. Wright (1963), "Factors of Industrial Location in Ohio" Ohio State University, Nigeria.
CONTRIBUTIONS TO BOOKS
Sharma T., Kwatra, G. (2008) Effectiveness of Social Advertising: A Study of Selected Campaigns, Corporate Social Responsibility, Edited by David Crowther & Nicholas Capaldi, Ashgate Research Companion to Corporate Social Responsibility, Chapter 15, pp 287-303.
JOURNAL AND OTHER ARTICLES
Schemenner, R.W., Huber, J.C. and Cook, R.L. (1987), "Geographic Differences and the Location of New Manufacturing Facilities," Jour-nal of Urban Economics, Vol. 21, No. 1, pp. 83-104.
CONFERENCE PAPERS
Garg, Sambhav (2011): "Business Ethics" Paper presented at the Annual International Conference for the All India Management Asso-ciation, New Delhi, India, 19–23
UNPUBLISHED DISSERTATIONS
Kumar S. (2011): "Customer Value: A Comparative Study of Rural and Urban Customers," Thesis, Kurukshetra University, Kurukshetra.
ONLINE RESOURCES
Always indicate the date that the source was accessed, as online resources are frequently updated or removed.
WEBSITES
V
OLUMEN
O.
9
(2019),
I
SSUEN
O.
10
(O
CTOBER)
ISSN
2231-5756
A STUDY ON THE IMPACT OF THE CHILI MARKET ON THE PEOPLE OF BYADGI REGION, KARNATAKA, INDIA
Dr. GURUBASAVARYA HIREMATH
ASSOCIATE PROFESSOR
SCHOOL OF MANAGEMENT STUDIES & RESEARCH
KLE TECHNOLOGICAL UNIVERSITY
HUBBALLI
SUNITA
RESEARCH SCHOLAR
SCHOOL OF MANAGEMENT STUDIES & RESEARCH
KLE TECHNOLOGICAL UNIVERSITY
HUBBALLI
ABSTRACT
Byadgi is known for its dry chili market. According to folk 200 years ago chili cultivation has started in Byadgi. Presently this is the second largest chili trading market in the country. It has awarded with local Geographical Indication (GI) tag in the year 2010 for varieties of chili. There is a scope to study the impact of the chili
market.This study throws the light on the impact of chili market on the local traders, farmers, and the public through exploratory design using semi-structured
questioner and interview methods. This paper discussed the overall chili industry influences on people lifestyle, employment, and health. Information collected directly from farmers, traders and workers through discussion.
KEYWORDS
Byadgi, effects of chili market.
JEL CODES
Q10, Q11, Q13, Q15, Q19.
1. INTRODUCTION
hilli is originated from America in 7500 BC. Capsicum word is derived from the Greek word ‘Kampsimo’ meaning is “to bite”. Chilli is a fruit of plant ‘Capsicum annuum and capsicum friends’. It has some common varieties like bell peppers, hot pepper, cayenne pepper, and sweet pepper, etc. in the world more than 200 countries produce this product because of its color and pungency. The world area for production chili during 2009-10 was 767200 hectors and 1202900 tons. Chill is a source of vitamin A,C, and E so it scientifically recognized application in the treatment of asthma, arthritis blood clots, cluster, headaches and it also used in cosmetics preparation.
GRAPH 1: COUNTRY WISE SHARE IN CHILI PRODUCTION
Chilli enters India in the year 1585 by Portuguese and it spread rapidly in the whole country because of a suitable climate for cultivation. India is the world leader in chili production followed by China and Pakistan. Chilli is a universal spice. India is cultivating it in all the state and union territories of the company. Andhra Pradesh is the largest producer in India contributing 57 percent of total production followed by Karnataka, Maharashtra, and Tamilnadu. The export of chili from India stood at 204000 tons valued at Rs.129172.8 lakhs during 2009-10 and Malaysia (26%) is the largest importer of chili from India (Stephan 2012) Assam state producing World hottest chili “Naga Jolokia".
V
OLUMEN
O.
9
(2019),
I
SSUEN
O.
10
(O
CTOBER)
ISSN
2231-5756
GRAPH 2: STATE WISE SHARE IN CHILI PRODUCTION
In Karnataka Dharwad, Haveri, Gulbarga, Belgaum, Hasan and Chitradurga districts produce chilli but Byadgi is known for chilli in the world market this chili is special for its deep red color and has the highest color value. Chilli crops play the main role in the agricultural economy of Byadgi and its given geographical indication (GI) certificate from September 2010 as per section of a geographical indication of goods (registration, protection) Act 1999. They are several types of Byadgi chili mainly classified into 2 types Byadgi kaddi and Byadgi Dabbi. Chillis were being cultivated in the Byadgi area about 200 years ago according to folk by British rule. Byadgi taluk is the second largest chili trading market in the country (Swamida 2012).
GRAPH 3: CHILLI TRENDS IN THE AREA, PRODUCTION, AND YIELD IN INDIA
WHY CHILI MARKET IN BYADGI?
Byadgi chili is primarily sold in Byadgi chili market annual sales are about Rs 3 billion ($75 million). APMC of the Byadgi was started in the year 1948 (Feb 15). This market attracts the traders from all over Karnataka and neighboring Andrapradesh because of favorable condition for the business such as
Transportation (Railway, Road)
Best market place (75 acres)
E-tender adopted in the year 2008
Cold storage facility
Money transfer through check or RTGS (Real Time Gross Settlement) to formers
There are 6000 Framers, 600 Traders and 500 Commission agents are present the market
More than 500 varieties of chili arrive at market
V
OLUMEN
O.
9
(2019),
I
SSUEN
O.
10
(O
CTOBER)
ISSN
2231-5756
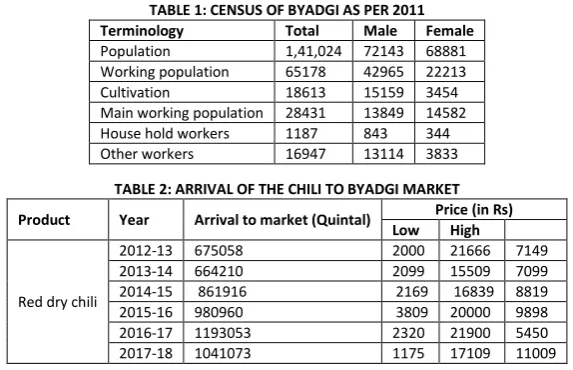
TABLE 1: CENSUS OF BYADGI AS PER 2011
Terminology Total Male Female
Population 1,41,024 72143 68881
Working population 65178 42965 22213
Cultivation 18613 15159 3454
Main working population 28431 13849 14582
House hold workers 1187 843 344
Other workers 16947 13114 3833
TABLE 2: ARRIVAL OF THE CHILI TO BYADGI MARKET
Product Year Arrival to market (Quintal) Price (in Rs)
Low High
Red dry chili
2012-13 675058 2000 21666 7149
2013-14 664210 2099 15509 7099
2014-15 861916 2169 16839 8819
2015-16 980960 3809 20000 9898
2016-17 1193053 2320 21900 5450
2017-18 1041073 1175 17109 11009
2. LITERATURE REVIEW
This chapter reviews the research work done in the field related to the objective of the study. These are few comprehensive studies made available on Byadgi Chilli may methods of analysis are presented following. To consistent with the objectives of the study the literature review is presented in two heads
a. Chili market
b. Byadgi chili market
2.1 CHILLI MARKET
Dr. Indira Mehta (2017) reported Indian Spice sector is zooming at a great place. India produces than 4 million tones of spice expert 180 spice products in over 150 nations. Technical guidance for organic chili cultivation is required and chili price is relevant to the market arrivals. If highest during the period of May September and lowest during November October. Chilli is rich in vitamins A&C and good sources of folic acid, potassium and vitamin E.
S. S. Pawar at al. (2011) stated that chili is contained belonging to Capsicum annulment and contain more than 12% of a volatile other soluble extractive capsaicin gives pungent to test. Chilli using more like chili Beverages, a counter-irritant in rheumatism, stomachic, heart arrhythmias as a food flavoring, etc. benefits effects of chili were positive and some were negative.
Shivaraja M B (2012) identified that chili is an important commercial crop of India and its exports also. Asian countries have a bulk share in the production of chili Indian is contributing 25 percent to the total world chili production. Karnataka has 20 percent of the total area produce chili in India but the output is only 9 percent of the total production chili. There is a need for the crop insurance scheme for chili protect production
Veerana et al (2011) reported that chili area, production, productivity was decreasing year after year despite being a highly profitable commercial spice crop. Ajithkumar and Indira Devi (1994) in the study on cardamom production in Kerala used secondary and data on area, production productivity from the various publications of Bureau of Economics and Statistics as well Kerala spice board for the period (1965-66 to1989-90). He employed a linear growth rate model to analyze the data and concluded that the growth rates for the area (1.923 percent), production (5.535 percent) and productivity (3.612 percent) were positive and significant.
Hiremath (1994) studied growth rates for chilies in Dharwad district and found that the growth rate with respect to the area was higher (5.9%) which was closely followed by production (5.18%) and productivity (0.011%). All these parameters showed a positive growth rate with respect to chilies’ in Dharwad district. Bhullar (2005) studied the trends in the production of dry chilies in India and found that Andhra Pradesh, Karnataka, Maharashtra, and Orissa put together account for 75.00 percent of the total Indian production. Punjab state occupied 3.10 percent of the area and was ranked eighth during 1974-77, which decreased substan-tially to only 0.46 percent in 2001. Production-wise, Punjab accounted for 4.61 percent of production during 1974-77, which fell to 0.74 percent during 1998-2001. There has been a significant improvement in the productivity of chilies’ at 1945 kg per ha, followed by Punjab at 1688 kg per ha, Rajasthan at 1064 kg per ha, Arunachal Pradesh at 1272.7 kg per ha and Gujarat 786 kg per ha.
Vandana (2008) reported that chili cultivation depended on farmers saved seeds. The farmers largely depend upon two major regions for the supply of seeds – one in Karnataka itself called Byadgi and the other was Guntur (Andhra Pradesh).
Ramachandra (2008) estimated Rs. 6.58 corer loss of chili crop in Bellary district due to disease attack. Chilli area was 1,736 hectares, out of the total crop area of 13,287 hectares in Bellary.
Navadkar et al. (2003) revealed that the area, production, and productivity of cotton in India during 2001-2002 were increased by 48.81, 22.71 and 15.00 percent change over 1950-51 respectively. It means that the production increased rapidly on account of area and productivity growth.
Balappa Shivaraya et al. (1999) attempted to analyze the growth performance of red gram in Gulbarga district and Karnataka state as a whole over the period 1980 to 1994. The quadratic growth function was fitted for the estimation of growth rate in the area and cubic function for production and productivity. The study showed that area under red gram declined significantly by 10 percent and 9 percent per annum respectively during 1980-81 to 1994-95 in the Gulbarga district and Karnataka state as a whole. Productivity has increased significantly by 11 percent in Karnataka state. The analysis concluded that even though the area had declined significantly, the production did not decline due to the significant increase in its products for the state as a whole.
2.2 BYADGI CHILI MARKET
Ishwara (2010) reported analysis that in the Byadgi region were cold storages to storing red, chili seeds and chili, etc. however 80 percent of each cold storage was filled with red chili due to the existence of vast and extensive red chili market yard in Byadgi.
Stephan Raj Swaminba (2012) reputed that Haveri (Byadagi) is shifting from red chili to cotton production. Despite the reduction Byadgi chili area the market arrivals as Byadgi chili substantially chili farmers facing "Madura Roga" means leaf curling disease for their chili cultivation. Byadgi chili is grown in Dharwad Gadag & Haveri district in rain field conditions
Jajetiravi (2012) reported that farmers switched to cotton from chili because of cotton prices were more stable than chili prices. Farmers were likely to shift to cotton or cereals due to lower returns from the chili.
3. RESEARCH GAP
There are many research studies on the chili market and Byadgi chili. Specifically studies on History of Byadgi chili, dynamics of chili market, grades and standards on chili, characteristics of Byadgi chili, production and value addition to chill, etc. But there is a lack of study chili market impact on the Byadgi region.
4. PROBLEM STATEMENT
Byadgi is known for chili and its given Geographical Indication (GI) certificate from September 2010 as per section of the GI goods Act 1999. According to folk 200 years ago chili crop started to grow here. Byadgi chili is special for its deep red color and less spicy and 25 industries are in and around the Byadgi involved in converting this chili into powder. Annually on an average Byadgi chili market has 300 core turnovers. This market attracts traders from throughout Karnataka and near state Andra Pradesh because of its fair price, immediate payment and accurate measurement of chili.
V
OLUMEN
O.
9
(2019),
I
SSUEN
O.
10
(O
CTOBER)
ISSN
2231-5756
5. OBJECTIVE
To analyze the impact of Byadgi chili market on the following people of Byadgi:
• Towards the Framers
• Towards the Traders
• Towards the Workers
6. SIGNIFICANCE OF THE STUDY
This study should be significant in the sense that it will:
This research enlightens policymakers on information about whether the chili market is impacting stakeholders of Byadgi or not in terms of infrastructure devel-opment, health, people lifestyle and economic growth, etc.
7. SCOPE OF THE STUDY
This study will be restricted to Byadgi region because of external aspects like industries related to chili and chili market. This study is intense on only chili aspect.
8. LIMITATIONS OF THE STUDY
1. This study is limited to Byadgi region
2. This study is cover only those who are related to Byadgi chili market
9. RESEARCH METHODOLOGY
9.1 TYPE OF RESEARCHThe proposed research carried out will be descriptive research and analytical research in nature. 9.2 DESCRIPTION OF THE STUDY AREA
The study will carry in Haveri and Dharwad districts of Karnataka which contribute substantial chili area and production of the state.
Haveri, popularly known for Byadgi chili variety and its market in South East Asia, is almost in the center of Karnataka. It is a newly formed district on 15th August 1997comprising 7 taluks namely Haveri, Byadgi, Hirekerur, Ranebennur, Savanur, and Shiggaon The district has a total geographical area of 4, 85,058 ha with a cultivable area of 3, 47,540 ha
Dharwad district has a total geographical area of 4.27 lakh ha with 3.60 lakh ha cultivated area comprising of three Agro-climatic zones, i.e. Dry zone (zone-3), Northern transitional zone (zone-8) and part of Hilly zone (zone-9)
9.3 POPULATION FOR THE STUDY
For the proposed study population is defined as chili formers and chili related companies in Byadgi include employees who employed on chili related activities 9.4 DATA TYPE
For the research purpose, data will be collected on a quantitative and qualitative way 9.5 SAMPLING TYPE
Probability sampling (Stratified random sampling) 9.6 COLLECTION OF DATA
Data was collected through primary and secondary mode. Primary through interview of prospective respondents by questioner and secondary through Journals, Magazines, Newspapers, reports published by various institutes and Government bodies
10. DATA ANALYSIS
Hypothesis test used as data analyzes tool. It refers to an assumption that is made to find a solution to the research problem. The hypothesis is the theory, methods for the practice of testing a hypothesis by comparing it with the null hypothesis. The null hypothesis is only rejected if its probability falls below a predetermined significance level, in which case the hypothesis being tested is said to have that level of significance.
Parametric test: Hypothesis is based on two types Parametric and Non-parametric. The parametric statistical test is one that makes assumptions about the
pa-rameters (defining properties) of the population distribution from which one's data are drawn, while a non-parametric test is one that makes no such assumptions. Here parametric" as referring to tests, such as t-tests and the analysis of variance, those assume the underlying source population(s) to be normally distributed.
t-test: t- test (Sample size, Population variance unknown)
1. Chilli cultivation
H0: There is no decrease of chilli cultivation in Byadgi over years (µp = µs) H1: There is decrease of chilli cultivation in Byadgi over years (µp < µs) Reject H0 If t < -1.725
Test statistic t = -12.69
Decision: t = -12.69 < -1.725 Reject the H0
T-Distributions Plot lest-tail test, Alpha = 0.05, Degree of freedom (df) = 20 CHART 1
-1.725 0
Interpretation: From the above graph, it can be inferred that the t value is -12.69 it falls in the rejection area that evidences that there is a decrease of chili cultivation in Byadgi over years. The study (Stephan Raj Swaminba et.al 2012) is also witness the formers of Haveri district people are shifting from red chili to cotton production.
V
OLUMEN
O.
9
(2019),
I
SSUEN
O.
10
(O
CTOBER)
ISSN
2231-5756
H1: Chilli market has effect on life style of the people Reject H0 If t ≥ 1.725
Test statistic: t = 5.2
Decision: t = 5.2 > 1.725 Reject the H0
T-Distributions Plot right-tail test, Alpha = 0.05, Degree of freedom (df) = 20 CHART 2
0 1.75
Interpretation: The graph shows that there is an acceptance area of the null hypothesis less than 1.75 but the t value is 5.2, it would result in rejection of the null hypothesis. From the result, it can infer that the chili market into the lifestyle of the people. Because of chilli market income of people had increased and this affected the lifestyle of people also.
3.Impact on Byadgi
H0: Chilli market has not positively impacted on Byadgi H1: Chilli market has positively impacted on Byadgi Hypotheses Region:
Reject H0 If t < 1.725 Test statistic: t = -4.21
Decision: t = -4.21 < 1.725 Reject the H0
T-Distributions Plot right-tail test, Alpha = 0.05, Degree of freedom (df) = 20 CHART 3
-1.725 0
Interpretation: From the above graph, it can be inferred that the t value -4.21 falls in the rejection area. It would result in accept the alternative hypothesis that is Chilli market has positively impacted on Byadgi in terms of their infrastructure and development of the region.
4. Impact on Employment
H0: Employment has not increased in Byadgi because of chilli market H1: Employment has increased in Byadgi because of chilli market Hypotheses Region:
Reject H0 If t < 1.725 Test statistic: t = -20.07
Decision: t = -20.7 < - 1.725 Reject the H0
T-Distributions Plot right-tail test, Alpha = 0.05, Degree of freedom (df) = 20 CHART 4
V
OLUMEN
O.
9
(2019),
I
SSUEN
O.
10
(O
CTOBER)
ISSN
2231-5756
Interpretation: The graph shows that there is an acceptance area of the null hypothesis less than 1.75 but the t value is 20.07, it would result in rejection of the null hypothesis. From the result, it can infer that employment has increased in Byadgi because of the chili market. Presently on an average daily 10.000 people are working in the market.
5. Impact on Health
H0: Chilli market has no effect on the health of people H1: Chilli market has an effect on the health of people Hypotheses Region:
Reject H0 If t ≠ 2.086 Test statistic: t = 8.1609 Decision: t ≠ Reject the H0
T-Distributions Plot of two tail test, Alpha = 0.05, Degree of freedom (df) = 20
CHART 5
-2.086 0 2.086
Interpretation: Interpretation: From the above graph, it can be inferred that the t value 8.1609 falls in the rejection area. It would result in accept the alternative hypothesis that is chili market has an effect on the health of people.
11. FINDINGS
On the basis of the study following findings have been drawn:
Byadgi chili is known for its deep red color and fragrance. That provides scope for chili related industry There is a lack of awareness about the Geographical Index (GI) tag in the market
There are 600 registered chili traders in the market that producing employment opportunities for people
On average 10,000 people are working in the market daily based especially involved in removing the cap of chili, which negatively impacts on the health of people.
Growth of the market influencing the lifestyle of the people.
Prices of chili are not stable compared to other crops. Formers are shifting from chili cultivation so resulting in a reduction of chili cultivation in Byadgi On an average daily 10,000 people are working in the market, especially involved in removing the cap of chili, which negatively impacts on the health of people.
12. CONCLUSION
Byadgi is forced to grow chili at the time of British role. Presently this is second largest chili trading market in India. This growth results in many changes in Byadgi. The study is contributing to know that the market has impacted Byadgi directly and indirectly in terms of their employment, infrastructure, health, and lifestyle. It has upgraded the peoples' lifestyles with a negative effect on health.
REFERENCES
1. Ajith Kumar P.K and Indira Devi P. ‘Variability and trends in area, production, and productivity of tea in Kerala’, Agricultural Situation in India, Volume XLX(11),
1995, pp 807-809.
2. Balappa Shivaraya, L.B Hugar, and J.N Olekar, ‘Growth performance of red gram in Karnataka state’, Journal of Applied and Natural Science, Volume 8(4),
(2016), Issue No 10 (December), ISSN 1756-1761.
3. Bhullar, A. S., ‘Estimating, export competitiveness of chillies from Punjab state’. Agricultural Marketing, April-June, 2005, pp 36-43.
4. Hiremath, A.P, 1994, ‘Production and marketing of dry chillies in Karnataka’ – An economic analysis. M.Sc. (Agri) thesis (Unpub.), University of Agricultural
Sciences, Dharwad. Journal of Pharmacognosy and Phytochemistry, Volume No 6(2017), Issue No :1291-1293 E-ISSN 2278-4136.
5. Ishwara P., ‘Entrepreneurial opportunities in food processing units (with special references to Byadgi red chilli cold storage units in the Karnataka state)’,
Annals of the University of Petrosani, Economics, Volume 10(1) 2010, pp 119-128.
6. Jajetiravi, 2012, Turmeric, chilli suffer production overkill, The Financial express, report by The Hindu newspaper.
7. Navadkar, D.S., K.S. Birari and D.V. Kasar, 2003, ‘Government support for increasing production and marketing of cotton’, Agricultural Situation in India,
Volume No 59(12), Issue No April 2002, pp 777-781.
8. Ramachandra C., 2008, Chilli grown in 1,736 hectares damaged the loss has been highest in Bellary taluk, report by The Hindu newspaper.
9. S.S.Pawar, N.V Bharude et al. ‘Chillies a food, spice and medicine: A perspective’, International Journal of Pharmacy and Biological science, Volume 1, Issue
No 3(July)2011, ISSN: 2230-7605, pp 311-318.
10. Stephan Raj Swamidas 2012, ‘A study on Dynamics of Byadgi chili in Karnataka’, Department of agriculture marketing cooperation and business management,
University of Agricultural Science, GKVK, Benglure-560 065.
11. Vandana Shiva, 2008, ‘Seeds of Suicide, the Ecological and Human Costs of Globalisation of Agriculture’, Research Foundation for Science, Technology and
Ecology, 2008.
12. Veerana G. Goudra, Y. N. Havaldar, S. N. Megeri, S. B. Hosamani, Basvaraj Banakar, 2011, ‘Growth rate scenario of chilli (Capsicum annum L) in north
Karna-taka’, Journal of Farm Science, Volume 24(2011), Issue No 3 (November), pp 412. WEBSITES
13. http://iosrjournals.org/iosr-jhss/papers/Vol.%2022%20Issue7
V
OLUMEN
O.
9
(2019),
I
SSUEN
O.
10
(O
CTOBER)
ISSN
2231-5756
15. http://www.dupont.co.in/products-and-services/crop-protection/crop-protection-chilli-cultivation.html
16. https://ideas.repec.org/p/pra/mprapa/64832.html
17. https://www.academia.edu/36819500/Indian_Commodity_Trading
18. https://www.agrocrops.com/red-dry-chillies.php
19. https://www.ijpbs.com/ijpbsadmin/upload/ijpbs
20. https://www.researchgate.net/profile/Indira
V
OLUMEN
O.
9
(2019),
I
SSUEN
O.
10
(O
CTOBER)
ISSN
2231-5756
PERCEPTION OF INSTITUTIONAL CUSTOMERS’ TOWARDS COURIER SERVICES IN TAMILNADU
Dr. S. SELVAKUMAR
HEAD
PG & RESEARCH DEPARTMENT OF COMMERCE
THEIVANAI AMMAL COLLEGE FOR WOMEN (AUTONOMOUS)
VILLUPURAM
ABSTRACT
All the institutions are using courier services for onwards transmission of time-sensitive documents and non-documents from one place to another irrespective of their type of organisation and business. Hence, in this study an attempt has been made to analyse the institutional customers’ attitude towards courier services in Tamilnadu. Both primary and secondary data were collected for the study. In order to analyse the opinion of the institutional customers belonging to different types of organisations and different types of business on service variables such as speed of delivery, safety, reasonable charges, reliability, proximity, technology, value added services, credit facility, service at all places and allied business, ANOVA test was used. The major finding of the study is that even though the institutional customers are belonging to different types of organization and business, they have similar positive opinion on courier services and associate the name courier service with speed, safety and reliability.
KEYWORDS
courier service, customers, perception, speed, safety.
JEL CODE
L87, L91, L97, M30.INTRODUCTION
he courier industry plays an important role in transmitting documents and non-documents from one place to another for business community and general public. Apart from this, it also provides employment opportunities to many young educated youth. In a way within a short-span of time it has proved its value in the economy.
Oil and Natural Gas Corporation is the first Indian entity to use single express services in India. The legend of the runner who ran all the way from Sparta to Athens, to deliver the message of the Greek victory, is also the first famous courier in history”1
“The global express service industry made a direct contribution to world GDP of US$64 billion in 2003. It carried over 1 billion shipments annually. It contributed more than Rs.6 billion in federal taxes yearly.”2
STATEMENT OF THE PROBLEM
Customer perception plays a vital role in a company's ability to attract new customers and to retain existing customers. The good news is that courier services have the ability to control many of the factors that build an individual's perception of the company/brand. Hence, an attempt has been made to analyse the perception of the institutional customers belonging to different types of organisations and different types of business on service variables such as speed of delivery, safety, reasonable charges, reliability, proximity, technology, value added services, credit facility, service at all places and allied business.
REVIEW OF RELATED LITERATURE
While scanning through customer satisfaction on courier service, very few studies have been conducted.
Aleksandra Gule in her article titled “Courier Service Quality from the Clients’ Perspective”3 published in ‘Engineering Management in Production and Services’
assessed the significance of thirteen criteria which determine the choice of service at present and in the future using Wilcoxon signed ran test.
Dr. R. Somasundaram et al in their article titled “Customer Behaviour of Courier Services in Erode District”4 published in Indian Journal of Research have found
that there is relationship between the level of education of customers and the purpose of using courier service.
OBJECTIVES OF THE STUDY
The following are the main objectives of the study:
1. To examine the perception of institutional customers’ towards courier services in Tamil Nadu.
2. To offer suitable suggestions on the basis of the findings of the study.
HYPOTHESES
Ho: The opinions on variables influencing courier services such as speed of delivery, safety, reasonable charges, reliability, proximity, technology, value added services, credit facility, service at all places and allied business among institutional customers belonging to different types of organisations do not differ. H1: The opinions on variables influencing courier services such as speed of delivery, safety, reasonable charges, reliability, proximity, technology, value added services, credit facility, service at all places and allied business among institutional customers belonging to different types of business differ.
RESEARCH METHODOLOGY
COLLECTION OF DATAThe study is based on both primary and secondary data. Primary data have been collected by conducting survey. The survey covered 100 institutional customers of courier services i.e., 25 each from four major districts of Tamilnadu such as Chennai, Coimbatore, Madurai and Trichy. Secondary data have been collected from books, journals, newspapers, periodicals, reports, internet and unpublished Ph.D. theses.
1 Pankaj Joshi and Vijay Trivedi, “Courier Industry”, Indian Express Investment Week, September 14 - 20, 1998, p.16.
2 Oxford Economic Forecasting, “The Impact of the Express Delivery Industry on the Global Economy”, March, 2005, p.7.
3 Aleksandra Galc, “Courier Service Quality from the Clients’ Perspective”, Engineering Management in Production and Services, Vol.9, No.1, 2017, p.36.
V
OLUMEN
O.
9
(2019),
I
SSUEN
O.
10
(O
CTOBER)
ISSN
2231-5756
PROFILE OF INSTITUTIONAL CUSTOMERS
TYPE OF ORGANISATIONThe institutional customers surveyed belong to different types of organisation. Table 1 shows the classification of institutional customers on the basis of type of organisation.
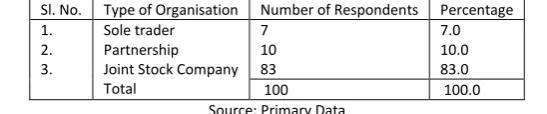
TABLE 1: CLASSIFICATION OF INSTITUTIONAL CUSTOMERS ON THE BASIS OF TYPE OF ORGANISATION
Sl. No. Type of Organisation Number of Respondents Percentage
1. 2. 3.
Sole trader Partnership Joint Stock Company Total 7 10 83 7.0 10.0 83.0
100 100.0
Source: Primary Data
From Table 1, it is clear that among the 100 institutional customers functioning in the State of Tamilnadu surveyed, 7 per cent belonged to sole trader concerns. Those who operated as partnership firms and joint stock companies amounted to ten per cent and 83 per cent respectively. It is concluded that more than four-fifths of the institutional customers (83%) belong to Joint Stock Companies.
Table 2 shows the details of opinion of the institutional customers belonging to different types of organisations on service variables such as speed of delivery, safety, reasonable charges, reliability, proximity, technology, value added services, credit facility, service at all places and allied business.
TABLE 2: DESCRIPTION OF THE OPINION ON VARIABLES INFLUENCING COURIER SERVICES AMONG INSTITUTIONAL CUSTOMERS BELONGING TO DIFFERENT TYPES OF ORGANISATIONS
Variable influencing Courier Services Type of Organisation Number of
Institu-tional Customers
Mean value of opinion
Standard. Deviation
of Opinion Standard Error
Speed of Delivery
Sole Trader Partnership Firm Joint Stock Co. Total 7 10 83 100 4.57 5.00 4.72 4.73 .535 .000 .454 .446 .202 .000 .050 .045 Safety Sole Trader Partnership Firm Joint Stock Co. Total 7 10 83 100 4.43 4.40 4.20 4.24 .535 .966 .781 .780 .202 .306 .087 .078 Reasonable Charges Sole Trader Partnership Firm Joint Stock Co. Total 7 10 83 100 4.57 4.80 4.41 4.45 .535 .422 .648 .626 .202 .133 .072 .063 Reliability Sole Trader Partnership Firm Joint Stock Co. Total 7 10 83 100 4.14 4.30 4.17 4.19 .378 .483 .469 .465 .143 .153 .052 .046 Proximity Sole Trader Partnership Firm Joint Stock Co. Total 7 10 83 100 4.29 4.50 4.30 4.31 .488 .527 .535 .526 .184 .167 .059 .053 Technology Sole Trader Partnership Firm Joint Stock Co. Total 7 10 83 100 4.14 4.10 3.88 3.90 .378 .876 .967 .969 .143 .277 .107 .097
Value Added Services
Sole Trader Partnership Firm Joint Stock Co. Total 7 10 83 100 3.86 4.50 4.32 4.31 .900 .527 .609 .631 .340 .167 .068 .063 Credit facility Sole Trader Partnership Firm Joint Stock Co. Total 7 10 83 100 4.14 4.30 4.16 4.18 .378 .483 .460 .458 .143 .153 .051 .046
Service at all places
Sole Trader Partnership Firm Joint Stock Co. Total 7 10 83 100 4.29 4.50 4.28 4.30 .488 .527 .553 .541 .184 .167 .061 .054 Allied Business Sole Trader Partnership Firm Joint Stock Co. Total 7 10 83 100 2.71 3.10 2.88 2.91 .488 .316 .781 .753 .184 .100 .087 .075 Source: Primary Data
Table 2 shows the details of opinion of the institutional customers belonging to different types of organisations on service variables such as speed of delivery, safety, reasonable charges, reliability, proximity, technology, value added services, credit facility, service at all places and allied business.
The above analysis shows that the mean value (5.00) for speed of delivery is the highest for partnership firms with standard deviation of (0.0). When this value is compared with value of other respondents such as sole trader and company, the mean value slightly varies.
The mean value (4.43) for safety is the highest for sole trader with standard deviation of.535. When this value is compared with value of other respondents such as partnership firm and company, the mean value slightly varies.
The mean value (4.80) for reasonable charges is the highest for partnership firm with standard deviation of.422. When this value is compared with value of other respondents such as sole trader and company, the mean value slightly varies.
The mean value (4.30) for reliability is the highest for partnership firm with standard deviation of.483. When this value is compared with value of other respondents such as sole trader and company, the mean value slightly varies.
V
OLUMEN
O.
9
(2019),
I
SSUEN
O.
10
(O
CTOBER)
ISSN
2231-5756
The mean value (4.14) for technology is the highest for sole trader with standard deviation of.378. When this value is compared with value of other respondents such as partnership firm and company, the mean value slightly varies.
The mean value (4.50) for value-added services is the highest for partnership with standard deviation of.527. When this value is compared with value of other respondents such as sole trader and company, the mean value slightly varies.
The mean value (4.30) for credit facility is the highest for partnership with standard deviation of.483. When this value is compared with value of other respondents such as sole trader and company, the mean value slightly varies.
The mean value (4.50) for service at all places is the highest for partnership firm with standard deviation of.527. When this value is compared with value of other respondents such as sole trader and company, the mean value slightly varies.
The mean value (3.10) for allied business is the highest for partnership firm with standard deviation of.316. When this value is compared with value of other respondents such as sole trader and company, the mean value slightly varies.
In order to find the evidence for the statistical significance of these variations, the researcher applied ANOVA test and the result is given in Table 3.
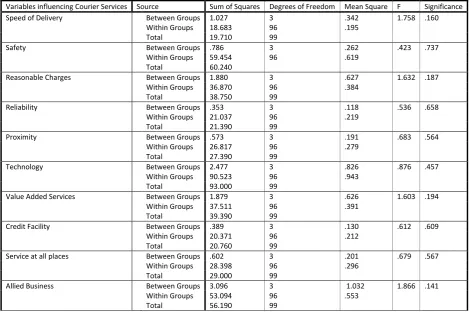
TABLE 3: ANALYSIS OF VARIANCE
Variables influencing Courier Services Source Sum of Squares Degrees of Freedom Mean Square F Significance
Speed of Delivery Between Groups 1.027 3 .342 1.758 .160
Within Groups 18.683 96 .195
Total 19.710 99
Safety Between Groups .786 3 .262 .423 .737
Within Groups 59.454 96 .619
Total 60.240
Reasonable Charges Between Groups 1.880 3 .627 1.632 .187
Within Groups 36.870 96 .384
Total 38.750 99
Reliability Between Groups .353 3 .118 .536 .658
Within Groups 21.037 96 .219
Total 21.390 99
Proximity Between Groups .573 3 .191 .683 .564
Within Groups 26.817 96 .279
Total 27.390 99
Technology Between Groups 2.477 3 .826 .876 .457
Within Groups 90.523 96 .943
Total 93.000 99
Value Added Services Between Groups 1.879 3 .626 1.603 .194
Within Groups 37.511 96 .391
Total 39.390 99
Credit Facility Between Groups .389 3 .130 .612 .609
Within Groups 20.371 96 .212
Total 20.760 99
Service at all places Between Groups .602 3 .201 .679 .567
Within Groups 28.398 96 .296
Total 29.000 99
Allied Business Between Groups 3.096 3 1.032 1.866 .141
Within Groups 53.094 96 .553
Total 56.190 99
From table 3, it is inferred that all the variables show only insignificant difference. It means that even though the institutional customers belong to different types of organisations such as sole trader, partnership and company, there is no significant difference in their opinion on the variables important for courier services such as speed of delivery, safety, reasonable charges, reliability, proximity, technology, value added services, credit facility, service at all places and allied business. It is concluded that all the institutional customers have similar positive opinion on courier services and associate the name courier service with speed, safety and reliability.
TYPE OF BUSINESS
Institutional customers surveyed belong to different type of business. Table 4 shows the classification of institutional customers on the basis of type of business.
TABLE 4: CLASSIFICATION OF INSTITUTIONAL CUSTOMERS ON THE BASIS OF TYPE OF BUSINESS
Sl. No. Type of Business Number of Respondents Percentage
1. 2. 3.
Manufacturing Trading Service Total
13 18 69
13.0 18.0 69.0
100 100.0
Source: Primary Data
V
OLUMEN
O.
9
(2019),
I
SSUEN
O.
10
(O
CTOBER)
ISSN
2231-5756
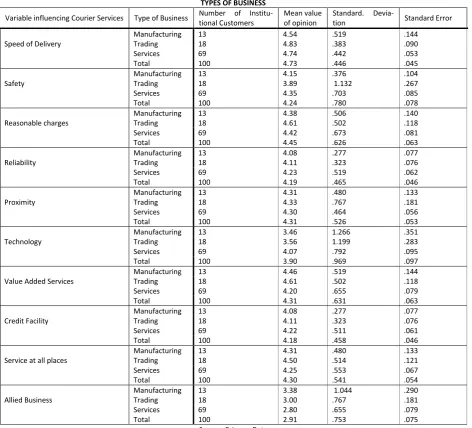
TABLE 5: DESCRIPTION OF THE OPINION ON VARIABLES INFLUENCING COURIER SERVICES AMONG INSTITUTIONAL CUSTOMERS BELONGING TO DIFFERENT TYPES OF BUSINESS
Variable influencing Courier Services Type of Business Number of
Institu-tional Customers
Mean value of opinion
Standard.
Devia-tion Standard Error
Manufacturing 13 4.54 .519 .144
Speed of Delivery Trading 18 4.83 .383 .090
Services 69 4.74 .442 .053
Total 100 4.73 .446 .045
Manufacturing 13 4.15 .376 .104
Safety Trading 18 3.89 1.132 .267
Services 69 4.35 .703 .085
Total 100 4.24 .780 .078
Manufacturing 13 4.38 .506 .140
Reasonable charges Trading 18 4.61 .502 .118
Services 69 4.42 .673 .081
Total 100 4.45 .626 .063
Manufacturing 13 4.08 .277 .077
Reliability Trading 18 4.11 .323 .076
Services 69 4.23 .519 .062
Total 100 4.19 .465 .046
Manufacturing 13 4.31 .480 .133
Proximity Trading 18 4.33 .767 .181
Services 69 4.30 .464 .056
Total 100 4.31 .526 .053
Manufacturing 13 3.46 1.266 .351
Technology Trading 18 3.56 1.199 .283
Services 69 4.07 .792 .095
Total 100 3.90 .969 .097
Manufacturing 13 4.46 .519 .144
Value Added Services Trading 18 4.61 .502 .118
Services 69 4.20 .655 .079
Total 100 4.31 .631 .063
Manufacturing 13 4.08 .277 .077
Credit Facility Trading 18 4.11 .323 .076
Services 69 4.22 .511 .061
Total 100 4.18 .458 .046
Manufacturing 13 4.31 .480 .133
Service at all places Trading 18 4.50 .514 .121
Services 69 4.25 .553 .067
Total 100 4.30 .541 .054
Manufacturing 13 3.38 1.044 .290
Allied Business Trading 18 3.00 .767 .181
Services 69 2.80 .655 .079
Total 100 2.91 .753 .075
Source: Primary Data
Table 5 shows the details of opinion of the institutional customers belonging to different types of business on service variables such as speed of delivery, safety, reasonable charges, reliability, proximity, technology, value added services, credit facility, service at all places and allied business.
The above analysis shows that the mean value (4.83) for speed of delivery is the highest for respondents doing trading business with standard deviation of.383. When this value is compared with value of other respondents doing manufacturing business and service business, the mean value slightly varies.
The mean value (4.35) for safety is the highest for institutional customers doing service type of business with standard deviation of.703. When this value is com-pared with value of other respondents doing manufacturing and trading businesses, the mean value slightly varies.
The mean value (4.61) for reasonable charges is the highest for institutional customers doing trading business with standard deviation of.502. When this value is compared with value of other respondents doing manufacturing and service type of businesses, the mean value slightly varies.
The mean value (4.23) for reliability is the highest for institutional customers doing service type of business with standard deviation of.519. When this value is compared with value of other respondents doing manufacturing and trading businesses, the mean value slightly varies.