Vol.7 (2017) No. 2
ISSN: 2088-5334
Validation on an Enhanced Dendrite Cell Algorithm using
Statistical Analysis
Mohamad Farhan Mohamad Mohsin
#, Abdul Razak Hamdan
*, Azuraliza Abu Bakar
*, Mohd Helmy
Abd Wahab
$#
School of Computing, College of Arts & Sciences, Universiti Utara Malaysia, Kedah, Malaysia E-mail: [email protected]
* Faculty of Science & Information Technology, Universiti Kebangsaan Malaysia, Selangor, Malaysia E-mail: [email protected], [email protected]
$
Faculty of Electrical and Electronic Engineering, Universiti Tun Hussein Onn Malaysia, Johor, Malaysia E-mail: [email protected]
Abstract— Evaluating a novel or enhanced algorithm is compulsory in data mining studies in order to measure it has superior
performance than its previous version. In practice, most of studies apply a straightforward approach for evaluation where appropriate performance metrics such as classification accuracy is selected, computes the mean and its variance over several repetitive experiments, and then compares it with the base algorithm or other comparative approach. However, there are limitations using this approach because dataset from different domain tend to produce different error rate thus make their average meaningless as well as susceptible to the outlier. This study demonstrates the mechanism of evaluating an enhanced algorithm using performance metrics and validated it using statistical analysis. In this study, we evaluated the performance of the enhanced algorithm called dendrite cell algorithm using sensitivity, specificity, false positive rate, and accuracy and validated the result using parametric and non parametric statistical significant tests. From the evaluation, the new version of dendrite cell algorithm was statistically proven to have improvement with a significant difference compared to its previous versions in all performance metrics.
Keywords— danger theory; dendrite cell algorithm; significant test.
I. INTRODUCTION
One of the primary focuses in data mining studies is to produce a novel or enhancing the existing algorithm. To measure the performance of the enhanced algorithm whether it has improved from previous version or against its competitor, the evaluation process is compulsory. The straightforward approach [1] to evaluate the algorithm performance is by using a suitable performance metrics such classification accuracy, compute the mean and its variance over several repetitive experiments and then compare it with the base algorithm or other comparative approach [2]. Algorithm with the highest score value is normally chosen as the best. However, there are weaknesses in taking the average as the main criteria because such dataset from different domain produces different error rate thus their average are meaningless. Besides that, the average is also susceptible to the outlier [3]. Thus assessing a model performance using significance test is critically more
comparison to other systems. DCA imitates the role of dendrite cell to detect anomaly. The algorithm receives sets of inputs from external sources and represents them as signals in the algorithm. There are three types of signals; the PAMP, safe (SS), and danger (DS) with each of them has a different role thus the selected features need to be assigned into appropriate signals. After that, the signal value is standardized using specific normalization algorithm before presenting them to DCA for detection. One of the issues in DCA is the signal normalization algorithms where they are designed purposely for a specific application based on recommendation of domain experts and very few algorithms are designed to address general problem. Since most of the signal normalization algorithms adopt a problem-based approach, this makes it difficult for an inexperienced user to exploit existing approaches to address another problem, particularly when the initial information about the problem is limited. Therefore, a generalized signal normalization algorithm based on cumulative sum technique is proposed [13].In this study, the performance of an enhanced DCA was tested using four performance metrics; the sensitivity, specificity, false positive rate, and accuracy and more importantly validating the result using statistical significant test. This paper discusses the testing and validating processes. The enhanced DCA was compared with the original DCA that applied the normalized techniques as used in [14]. Eight universal classification datasets from the UCI Machine Learning Repository [15] and StatLib Archive [16] were taken as the experiment data.
The remainder of the paper is organized as follows: In Section II, it discusses the related material to the study where several items are outline. In this section, it covers the background of DCA, outlines the statistical validating technique that covers the types of significant test and the count of wins, losses, ties and enhanced DCA and describes the experimental set-up. Then Section III presents the main result and discussion. The final section, Section IV, concludes this work.
II. MATERIAL AND METHOD
A. Material
This section discusses several important item related to the study; the background of DCA, outlines the statistical validating technique that covers the types of significant test and the count of wins, losses, and ties and presents the enhanced DCA. Firstly is the Dendrite Cell Algorithm (DCA). The foundation of DCA is derived from the functionality of danger theory that believes human immune system is activated when a body cell releases a danger signal as a response to infection. The key component of the theory is the dendrite cell (DC) that recognizes the released signals by collecting body cell proteins paired with three signals; PAMP, DS, SS and then monitors their life progress. The monitoring task continues until the cell dies either as a
‘healthy death’ (normal) or ‘unhealthy death’
(abnormal).DCA has three main phases; initialization, updating and aggregation as shown in Fig 1. In the initialization stage, it starts with the configuration and initialization of the algorithm parameter, matches the
features with the input signals, and normalized them. In this case, all DCs are initially set in the immature state and each record in the dataset is marked as antigen that has similar probability to be attacked by pathogen. In the updating phase, it involves an iterative process of updating data structures from the input signals and the antigens. The immature DC collects the input signals of PAMP, DS, and SS collectively with multiple antigens samplings, calculates the changes and determines which antigen is causing the changes using the accumulative function as Equation 1.
= ( / ( (1)
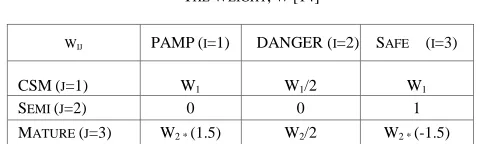
where W is the weight matrix, IS is the input signal, OS is the output signal, i represents the PAMP, SS, and DS while j is the output signal categories of CSM, Mature, and Semi-Mature. Table I depicts the combination of W in DCA, which has extracted from the immunological studies. The figure is allowed to be changed without changing the structure between signal.
TABLE I THE WEIGHT,W[14]
WIJ PAMP(I=1) DANGER (I=2) SAFE (I=3)
CSM(J=1) W1 W1/2 W1
SEMI (J=2) 0 0 1
MATURE (J=3) W2 * (1.5) W2/2 W2 * (-1.5)
During the sampling and updating cycle, all input signals are transformed into three cumulative output signals: CSMs, Mature, and Semi-Mature. Throughout several samplings, the maturity of DC changes from immature state to either semi-mature (normal) or mature (abnormal) depending on the CSM value that must be greater than the migration threshold. If CSM value exceeds the threshold, the type of maturity is determined; ‘mature’ if the Mature > Semi-Mature or ‘semi-mature’ if Semi-Mature < Semi-Semi-Mature.The aggregation phase occurs when the learning has ended. At the final stage, antigens that are presented by the Mature and Semi-Mature context are accessed to determine their abnormalities. Termed as the mature context antigen value (MCAV), the abnormality of an antigen is calculated as MCAV = (Mature)/(Semi Mature + Mature). If the MCAV is above a predetermined value (anomaly threshold), the antigen is labelled as abnormal/anomalous or otherwise as normal.
Fig. 1. The Dendrite cell algorithm (adapted from [14])
It is used to estimate the probability that the difference between algorithm results over various dataset is unrelated in the population. The result from the test can be used to filter out unpromising hypotheses by adhering to observed patterns. There are two types of significant test; the parametric and non-parametric models. The selection of appropriate significant test is based on two conditions, which are the number of conducted experiment and the normality of the result. Based on these conditions, the parametric test such as t-test and z-test requires at least 30 numbers of experiments and their experiment results should be in a normal distribution. Otherwise, the non-parametric test such as Wilcoxon sign-ranked test is more appropriate to apply [17]. An algorithm is said to have a significant improvement than its competitor when the significant value; p is less than the significant level which is p<0.05 and the mean value must be greater than its competitor. In this study, two significant tests were used; the t-test and the Wilcoxon sign-ranked test.
T-test: T-test checks whether the average difference between two algorithm performances over datasets is
significantly different from zero. Let and be the performance score of algorithm 1 and algorithm 2 on ith out
of N dataset and let be the difference of . The
t-set statistic is calculated as and distributed according to the student’s distribution with N-1 degrees of freedom. The t-test analysis only makes sense when the differences over dataset are commensurate, thus it is employed if the sample size is large enough (at least 30 cases) and requires the difference between the compared algorithms to be distributed normally. The number of size sample is important since small samples prohibit the checking of shape distribution.Wilcoxon sign-ranked test : In conjunction to fulfil the sample size and normal shape distribution, the non-parametric test such as the Wilcoxon sign-ranked is an alternative. This approach compares the performances of two algorithms by ranking their performance difference, ignoring the signs, and compares the ranks for positive and negative difference. Let d_i be the difference between the performances of two algorithms on ith of N dataset. The differences are ranked according to their absolute values; average ranks are assigned in case of ties. Let R+ be the sum of ranks for the data sets on which the second algorithm outperformed the first, and R− is the sum of ranks for the opposite. Ranks of d_i = 0 are split evenly among the sums; if there is an odd number of them, one is ignored. The Wilcoxon signed ranks test is more rational than the t-test.
From the statistical point of view, the test is safer since it does not assume normal distributions. Also, the outliers (exceptionally good/bad performances on a few data sets) have less effect on the Wilcoxon than on the t-test [3].
Then is the count of wins, losses, and ties. Under this approach, the overall performance of classifiers is measured by calculating the number of dataset on which algorithm is the overall winner. It involves the wins, ties, and losses (indicated by W/T/L) at the 5% level (p<0.05) where the wins represent the enhanced algorithm beats other algorithms, losses are when the scores are lesser than other algorithms and ties if their results are similar. The W/T/L measurement is considered in addition to the average measurement because the average criteria would be susceptible to the outliers.
B. Methodology
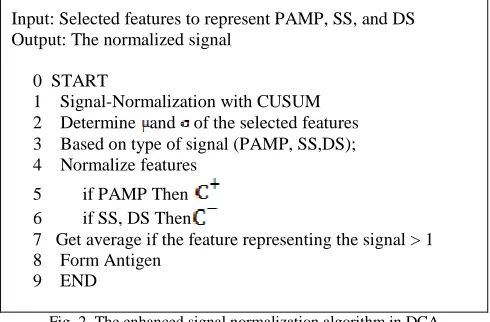
This section presents the enhanced DCA and describes the experimental set-up. The issues of DCA are during normalizing input data and assigned them to appropriate DCA signal. The limitation of existing signal normalization algorithms for DCA is it can’t be applied to general problems since they are designed based on the recommendations of experts in specific domain. Thus, DCA with an enhanced signal normalization algorithm is suggested to allow the algorithm can be applied at various domains. Fig. 2 shows the enhancement of signal normalization algorithm in DCA. In the enhanced DCA, the input signals; PAMP, SS, and DS are normalized using the cumulative sum normalization technique as depicted in Equation 2 and Equation 3:
(2)
(3)
where is the cumulative sum value. If is
greater than or equal to 0, the cumulative sum value is taken as the normalized value. The is used to normalize the
PAMP while the DS and SS are normalized with . Equation 4 shows the rule to normalize DCA signal.
Input: Selected features to represent PAMP, SS, and DS Output: The normalized signal
0 START
1 Signal-Normalization with CUSUM 2 Determine and of the selected features 3 Based on type of signal (PAMP, SS,DS); 4 Normalize features
5 if PAMP Then 6 if SS, DS Then
7 Get average if the feature representing the signal > 1 8 Form Antigen
9 END
Fig. 2. The enhanced signal normalization algorithm in DCA
In this study, the normalization approach of DCA input signal was enhanced in order to allow DCA to be applied to general domain problems. To test the validity of the enhanced algorithm (I-DCA), the algorithm was evaluated by applying it to eight universal classification datasets, which were taken from the UCI Machine Learning Repository [23] and StatLib Archive [28], as described in Table II The aim of the evaluation was to statistically validate the performance of the I-DCA over various datasets and compared with the over previous version of DCA (O-DCA).
TABLE III DESCRIPTION OF THE DATASETS
Dataset Origin Attributes # Records #
Indian Pima Diabetic (DBC)
[15]
9 768
Wisconsin Breast Cancer (WBC)
10 699
Iris (IRIS) 4 150
BUPA Liver Disorder (LDR) 7 345
Parkinson (PKN) 24 195
German Credit (GCD) 25 1000
Wine (WINE) 14 178
Biomedical (BIO) [16] 6 209
The signal normalization algorithm in O-DCA was taken from Greensmith [14] as a default signal normalization algorithm. The algorithm was initially used to classify the breast cancer dataset from UCI Machine Leaning Repository. For this study, it was applied to all experiment datasets to represent O-DCA and was compared with I-DCA.To evaluate the performance of the proposed model, the algorithms’ results were examined using four evaluation metrics; sensitivity (SNS), false positive rate (FPR), specificity (SPS), and accuracy (ACC). SNS measured the accurateness of the model to detect an abnormal class as an abnormal class SNS=TP/(TP+FN); SPS measured the ability of the model to detect a normal class as a normal class SPS=TN/(TN+FP); FPR measured the amount of false detections of an abnormal class as a normal class FPR= FP/(TN+FP); and ACC measured the accurateness of the model in classifying both classes correctly ACC= (TP+TN)/( TP+TN+FN+FP). For SNS, SPS, and ACC, the
highest value indicated the best result while the lowest value was the best result for FPR. The TP is true positive, TP is false positive, FP is false positive, and FN is false negative. Table III summarizes the performance metric
TABLE IIIII THE PERFORMANCE METRIC
Criteria Description Evaluation Formula
SNS The accurateness of the model to detect an abnormal class as an abnormal class
↑ TP/(TP+FN)
SPS The ability of the model to detect a normal class as a normal class
↑ TN/(TN+FP)
FPR false detections of an abnormal class as a normal class
↓ FP/(TN+FP)
ACC the accurateness of the model in classifying both normal/abnormal correctly
↑ (TP+TN)/
( TP+TN+FN+FP)
Result of two algorithms
N>30 Determine the number of sample N
Determine result distribution using normality test
P<0.05?
Non-Parametric Test (Wilcoxon sign-ranked
test)
Parametric Test (T-Test)
Determine Significant level N
N Y
Y
Win, losses, ties analysis
P<0.05?
Significant
Y Not
significant N
Fig. 3.The steps of significant test
III.RESULT AND DISCUSSION
In this section, the performance of the enhanced DCA (I-DCA) is presented. I-DCA was compared with O-DCA in terms of SNS, SPS, FPR, and ACC. The information in Table IV depicts the normality test of each performance results and PKN dataset was chosen for the illustration. In this study, the Kolmogorov-Smirnov result was chosen to determine the type of normality. If the P value (Sig.) of the normality test was < 0.05, then the result had a normal distribution thus the t-test was chosen as the significant test. Otherwise, the Wilcoxon sign-ranked test was assigned. From the table, the SPS and FPR were evaluated using the t-test while SNS and ACC were using the Wilcoxon sign-ranked test. The results of the significant test are shown in Table V (Wilcoxon) and Table VI (t-test).
TABLE IV
NORMALITY TEST FOR PKN DATASET Kolmogorov-Smirnova Shapiro-Wilk
Statistic df Sig. Statistic df Sig.
SNS(I-DCA) .079 100 .126 .982 100 .185
SNS(O-DCA) .180 100 .000 .933 100 .000
SPS (I-DCA) .537 100 .000 .123 100 .000 SPS (O-DCA) .181 100 .000 .933 100 .000 FPR (I-DCA) .537 100 .000 .123 100 .000 FPR (O-DCA) .180 100 .000 .933 100 .000 ACC (I-DCA) .078 100 .143 .983 100 .213 ACC (O-DCA) .079 100 .126 .982 100 .185
TABLE V
THE WILCOXON SIGN-RANKED TEST FOR PKN DATASET (SNS AND ACC) SNS(I-DCA -O-DCA) ACC(I-DCA -O-DCA)
Z -8.687b -8.682c
Asymp. Sig. (2-tailed) .000 .000
TABLE VI
THE T-TEST FOR PKN DATASET (SPS AND FPR)
The full results of I-DCA are illustrated in Table VII, which indicates the comparative results between I-DCA and the original DCA (O-DCA) in terms of four performance metrics; SNS, SPS, FPR, and ACC. The three rows above the last row summarize (1) the average values (AV) of each performance metric, (2) the results for all datasets in terms of wins, ties, and losses (indicated by W/T/L) and (3) the totals of the significant (+) and not significant (-) datasets. The p-value (P) represents the T-test (T) or the Wilcoxon test (W) result, where the value of the I-DCA must be less than 0.05 to make it statistically significant compared to the O-DCA.
TABLE VII
THE COMPARATIVE RESULT BETWEEN I-DCA AND O-DCA SNS
O-DCA I-DCA P
BIO 0.506 0.748 0.243W 0.00w+
LDR 1.000 0.720 -0.28 L 0.00w+
DBC 0.695 0.960 0.265 W 0.00w+
GCD 0.133 1.000 0.867 W 0.00w+
IRIS 0.998 0.919 -0.079 L 0.00w+
WBC 0.976 0.964 -0.012 L 0.00T+
PKN 0.000 0.562 0.562 W 0.00T+
WINE 0.956 1.000 0.044 W 0.00T+
AV 0.658 0.859 0.201W
W/T/L 5/3/0
+/- 8/0
SPS
O-DCA I-DCA O-DCA I-DCA BIO
0.721 0.964 0.242W 0.00w+ LDR 0.007 0.986 0.979 W 0.00T+
DBC 0.046 0.900 0.854 W
0.00w+ GCD
1.000 0.953 -0.047 L 0.00w+ IRIS
0.617 0.992 0.375 W 0.00w+ WBC 1.000 1.000 0.000 T
0.00w+ PKN
0.983 1.000 0.016W 0.00T+ WINE
0.606 0.839 0.232 W 0.00T+ AV 0.623 0.954 0.331W
W/T/L
6/1/1
+/- 8/0
Mean Std.
Deviation T df Sig.(2-tailed) SPS (I-DCA
-O-DCA) -.9995834 .0029309 -3410.510 99 .000 FPR (I-DCA
FPR
O-DCA I-DCA P
BIO
0.279 0.036 0.242 W 0.00w+ LDR
0.993 0.014 0.979 W 0.00T+ DBC
0.954 0.100 0.854W 0.00w+
GCD
0.000 0.047 -0.047 L 0.00w+ IRIS
0.383 0.008 0.375 W 0.00w+
WBC 0.000 0.000 0.000 T 1.00
T-PKN
0.017 0.000 0.016 W 0.00T+ WINE
0.394 0.161 0.232 W 0.00T+ AV
0.377 0.046 0.331 W W/T/L
6/1/1
+/- 7/1
ACC
O-DCA I-DCA P
BIO
0.644 0.886 0.242W 0.00w+
LDR 0.583 0.832 0.249 W 0.00w+
DBC
0.272 0.921 0.649 W 0.00w+ GCD
0.740 0.967 0.228 W 0.00w+ IRIS 0.744 0.968 0.224 W 0.00w+ WBC
0.984 0.977 -0.008 L 0.00T+ PKN
0.741 0.669 -0.072 L 0.00w+ WINE 0.701 0.882 0.181 W 0.00w+ AV
0.676 0.888 0.212W W/T/L
6/2/0 +/-
8/0
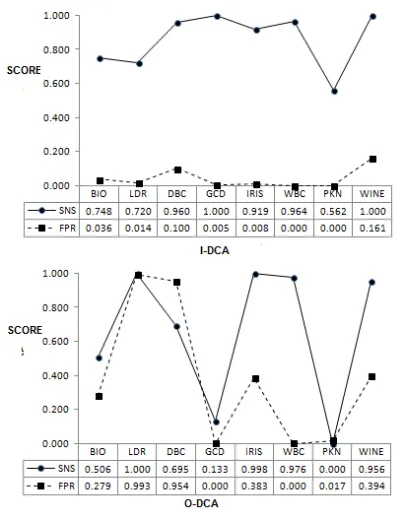
From the table, I-DCA overcame O-DCA in all performance metrics. It can be clearly seen that the enhanced DCA generated higher scores in SNS, SPS, ACC and lesser FPR with a huge difference. In overall average (AV), I-DCA beat O-DCA. Furthermore, the W/T/L statistic indicates that I-DCA lead the highest W in all performance metrics. Although there were some experiments that indicated I-DCA as losses, the score values between both versions were not significantly different. Then, the comparison was carried out by comparing the SNS and FPR. A good detection algorithm must score a highest SNS as possible that represents the ability to detect normal item but the same time generates the lowest FPR [18]. Lowest FPR represents the error rate while classifying normal item as abnormal. The information in Fig. 4 shows the differences between SNS and FPR of I-DCA and O-DCA for all datasets .Overall, the I_DCA has better SNS and FPR.The main objective of this experiment was to prove the proposed I-DCA has a positive improvement or in other term it was statistically significant from its previous version. The result can be seen at the last column (P) of Table VI where the W and T indicate the type of significant test; Wilcoxon sign-ranked test or T-Test and the +/- sign indicate significant/not significant result. As mention, the W and T was determined based on the normality test. Based on the figures in P (last column of Table VII), it was clearly proven that I-DCA was statistically improved when significant results in most datasets were generated. Out of all experiments, only one experiment signified I-DCA was not significant with O-DCA which can be seen at the evaluation
on FPR in WBC dataset. This resukt also can be seen at the +/- in last row of table VII that accumulate the significant and not significant dataset.
Fig. 4. The SNS and FPR between I-DCA and O-DCA in all dataset.
In overall, all results indicated that the proposed signal normalization using CUSUM can be applied to various domain problems. The performance of I-DCA has been proven as the best model than its competitor; the O_DCA after two experiments; based on single performance metrics and secondly statistic significant test.
IV.CONCLUSIONS
In this study, we presented a mechanism to evaluate an algorithm using performance metrics and validate it using statistical test. We evaluated the performance of the enhanced DCA called I-DCA using sensitivity, specificity, false positive rate, and accuracy. Besides that, the statistical test including significant test and the count of wins, losses, and ties were employed to validate the performance between I-DCA and O-DCA. To validate the result, this study considered two conditions; (1) the number of experiments and (2) type of normality in determining the appropriate significant test, either the t-test or the Wilcoxon sign -ranked test. From the validation, it was statistically proven that the I-DCA had overcome the O-DCA in all performance metrics with significant difference. The reliability of the proposed algorithm can be strengthen through the statistical test rather than relying on the single performance metrics by considering their average differences and their behaviour occurrence more than chance of several repetitive experiments.
ACKNOWLEDGMENT
REFERENCES
[1] J. Han, M. Kamber, and J. Pei, "13 - Data Mining Trends and Research Frontiers," in Data Mining (Third Edition), ed Boston: Morgan Kaufmann, 2012, pp. 585-631.
[2] S. Zainudin, D. S. Jasim, and A. A. Bakar, "Comparative Analysis of Data Mining Techniques for Malaysian Rainfall Prediction," International Journal on Advanced Science, Engineering and Information Technology, vol. 6, p. 1148, 2016.
[3] J. Demsar, "Statistical Comparisons of Classifiers over Multiple Data Sets," J. Mach. Learn. Res., vol. 7, pp. 1-30, 2006.
[4] U. Aickelin and J. Greensmith, "Sensing Danger: Innate Immunology for Intrusion Detection," Information Security Technical Report 12, pp. 218-227, 2007.
[5] U. Aickelin and S. Cayzer, "The Danger Theory and Its Application to Artificial Immune Systems," in 1st International Conference on ARtificial Immune Systems (ICARIS-2002), Canterbury, UK, 2002, pp. 141-148.
[6] P. Matzinger, "The evolution of the danger theory," Expert Review of Clinical Immunology, vol. 8, pp. 311-317, 2012.
[7] J. Greensmith, U. Aickelin, and S. Cayzer, "Introducing Dendritic Cells as a Novel Immune Inspired Algorithm for Anomaly Detection " in 4th International Conference in Artificial Immune Systems (ICARIS), 2005, pp. 153-167.
[8] J. Greensmith, J. Twycross, and U. Aickelin, "Dendritic Cells for Anomaly Detection," in Evolutionary Computation, 2006. CEC 2006. IEEE Congress on, 2006, pp. 664-671.
[9] D. Zhou, Z. Fan, and W. Zhang, "Research on AMU fault detection algorithm based on immune danger theory," in Control and Decision Conference (CCDC), 2011 Chinese, 2011, pp. 1957-1961.
[10] C.-M. Ou, "Host-based intrusion detection systems adapted from agent-based artificial immune systems," Neurocomputing, vol. 88, pp. 78-86, 2012.
[11] R. Huang, H. Taufik, and A. K. Nagar, "Artificial Dendritic Cells Algorithm for Online Break-in Fraud Detection," presented at the Second International Conference on Development in eSystems Engineering, 2009.
[12] M. F. Mohamad Mohsin, A. Abu Bakar, and A. R. Hamdan, "Outbreak detection model based on danger theory," Applied Soft Computing, vol. 24, pp. 612-622, 2014.
[13] M. F. Mohamad Mohsin, A. Abu Bakar, and A. R. Hamdan, "An upper and lower CUSUM for signal normalization in the dendritic cell algorithm," Evolutionary Intelligence, pp. 1-15, 2016.
[14] J. Greensmith, "The Dendritic Cell Algorithm," Ph.D, University of Nottingham, United Kingdom 2007.
[15] P. M. Murphy. (1997, 2 January 2013). UCI repositories of machine learning and domain theories”. Available: http://www.ics.uci.edu/~mlearn/MLRepository.html
[16] StatLib. (2005, 3 Febuary 2014). "Statlib — datasets archive" Available: http://lib.stat.cmu/datasets
[17] M. F. Triola, Elementary statistics, 10 ed. Boston: Pearson/Addison-Wesley, 2006.
![Fig. 1. The Dendrite cell algorithm (adapted from [14])](https://thumb-us.123doks.com/thumbv2/123dok_us/10040957.1990721/3.595.81.536.52.162/fig-the-dendrite-cell-algorithm-adapted-from.webp)