Volume 2, Issue 5, May 2013
Page 5
Abstract
In this paper we introduced low leakage 10T one-bit full adders cells are proposed for mobile applications. The analysis has been performed on various process and circuits techniques, the analysis with leakage power. We introduced a new transistor resizing approach for 1bit full adder cells to determine the optimal sleep transistor size which reduce the leakage power and area to minimize leakage current. We have performed simulations using Cadence Virtuoso 45nm standard CMOS technology at room temperature with supply voltage of 0.71V. Simulations have been also compared for multiple VDD. Thus design guide-lines have been derived to select the most suitable topology for the design features required. This paper also proposes a novel figure of merit to realistically compare 1-bit adders implemented as a chain of one-bit full adders. The CMOS leakage current at the process level can be decreased by some implement on deep sub micron method. The circuit level technique is reduced power consumption at very high level. In this paper we simulate the 10T Adder using many techniques both circuit level, process level.
Key Word —Adder, CMOS, MOSFET Transistor Leakage and Threshold Voltage
1. Introduction:
Due to increasing the demand of low power ICs for digital Circuits, use in like palmtop computers, cellular mobile, etc design choices which take into consideration low power features along with other circuit features like speed, area, performance life time, accuracy etc. Additions are heart of computational circuits and many complex arithmetic circuits are based on the addition and it is often one of the speed-limiting elements. Hence optimization of the adder both in terms of speed and/or power consumption should be pursued. During the design of an adder we have to make two choices in regard to different design abstraction levels. One is responsible for the adder’s architecture implemented with the one-bit full adder as a building block. The other defines the specific de-sign style at transistor level to implement the one-bit full adder. The one-bit full adder used is a three-input two-output block. The inputs are the two bits to be summed, A and, B and the carry bit Ci, which derives from the calculations of the previous digits. The outputs are the result of the sum operation S and the resulting value of the carry bit Co. More specifically, the sum and carry output are given by
...1 ……….... .2
From equation (2) it is evident that if A=B the carry output is equal to their value Co = Ci and the full adder has to wait for the computation of Co. Until now, in the literature there have been some comparisons between full adder circuits. However, in the former work, no low-power topologies were analyzed at all, whereas in the latter, new topologies which appear to be promising is not taken into account. Moreover, the effects of the interconnection parasitic of low-power full adders in were extracted from layout only for the CMOS and CPL topologies, while they were only approximately estimated for the other circuits. For these reasons, these approximate results differ from those presented in this paper. Apart from and, no systematic comparisons have been developed in the literature for other topologies, and recently proposed circuits are compared to existing ones by applying different simulation and comparison strategies, and even using different technologies. Hence, it is not easy to compare performances in a fair and clearly understandable way. The analysis and comparison developed here have been carried out in terms of speed, power consumption and power-delay product (PDP). The investigation, which also includes the most interesting recently proposed one-bit full adders, has been based on simulation runs on a Cadence environment by using a 0.45nm process taking parasitic into account, since post layout simulations have been performed. Two design strategies have been used to size each topology. The former aims to minimize power consumption adopting minimum-size transistors, the latter achieves minimum power-delay product by suitable transistor sizing. Performance for both design strategies has been also compared for different supply voltage values.
2. The 10T Adder
Minimization Leakage Current of Full Adder
Using Deep Sub-Micron CMOS Technique
1
Sandeep Kalundrekar, 2Shelendra Singh Tomar
1
Asst Prof. EI Dept. ITM University, Gwalior, M.P. India
2
Volume 2, Issue 5, May 2013
Page 6
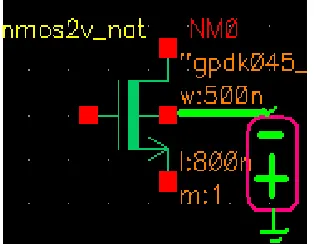
Fig-1 Ten Transistor Adder cellBased on CMOS 0.45-nm process technology, the proposed full adder is proven to have the minimum power consumption and less power-delay product by Cadence simulation comparing with other prior literature, the characteristics of the novel hybrid full adder shows that the design has the best power-delay product for carry out signal. Due to the minimum time delay of carry out, the adder core greatly improves the overall performance for a large scale of multi-bit adder. In active mode of operation the high Vt transistors are turned off and the logic gates consisting of low Vt transistors can operate with low switching power dissipation and smaller propagation delay. In standby mode the high Vt transistors are turned off thereby cutting off the internal low Vt circuitry.
3. Low power 1-bit full adder
Most often, Full adder is a part of the critical path that determines the overall performance of a system.1-bit full adder is one of the most critical components of a processor that determines its throughput. In this work we have designed a new 1-bit 10-transistor full adder which consumes less power than the standard implementations of full adder cell. The proposed adder is tested and compared with the high transistor count and existing 10-transistor adders under the same conditions. The addition of 2 bits A and B with C yields a SUM and a CARRY bit. The integer equivalent of this relation is shown as
….3 ……….….... 4
The proposed adder implements equations (3) and (4) using complementary CMOS and MUX based design logic with only 10 transistors. The adder is useful in larger circuits such as multipliers despite the threshold problem. The number of direct connections from VDD to the ground is reduced in the new design to minimize the power consumption due to short circuit current. Also the generation of SUM from CARRY is avoided as in the CMOS adder. Performance analysis of all the adder designs is carried out in 180nm, 90nm and 45nm CMOS technology in cadence. The performance is studied at power supply voltage of1.8V for 180nm, 1.0V for 90nm and 0.7V for 45nm at frequencies of 50MHZ.
4. CMOS Inverter Leakage Current
Volume 2, Issue 5, May 2013
Page 7
Fig-2. Static and dynamic power trendsIn the CMOS devices, the leakage current is becoming a major contributor to the total power consumption. In current deep-sub micron technology with low threshold voltages, sub threshold and gate leakage have become dominant sources of leakage and are expected to increase with the technology scaling. The leakage power is becoming significant component of the total power and may contribute to majority of the power dissipation in future CMOS technologies. The leakage current and leakage power are increasing with scaling. The two main sources of power dissipation in CMOS circuits are dynamic power dissipation and static power dissipation. Static power dissipation is due to leakage current when the transistor is normally off. The improvement in technology scaling has introduced very large sub threshold leakage current, therefore careful design techniques are very important in order to reduce sub threshold leakage current for low power design. Leakage current occurs in both active and standby modes. It is recommended to switch off the leakage current when the circuit is in standby mode. Power and technology graphs are shown in fig-2.
There are two major leakages current for power wastage in CMOS inverter 1. Sub threshold (weak inversion) leakage (ISUB)
2. Oxide tunneling Current (IG)
Where sub threshold leakage current are explain in mathematical as
SUB th2 STH ..5
where W and L denote the transistor width and length, µ denotes the carrier mobility, VTH = is the thermal voltage
at temperature T, CSTH = CDEP+ Cit denotes the summation of the depletion region capacitance and the interface trap capacitance both per unit area of the MOS gate, and η is the drain-induced barrier lowering (DIBL) coefficient is the slope shape factorand is calculated by equation-2
n = 1 + … … … ... 6
And the Oxide tunneling Current (IG or IFN) explain as
…… …..7
Where EOX is the field across the oxide; ØOX is the barrier height for electrons in the conduction band; and m* is the effective mass of an electron in the conduction band of silicon. The FN current equation represents the tunneling through the triangular potential barrier and is valid for VOX >ØOX, where is the voltage drop across the oxide
5. Leakage Reductions at Process Level
In a full adder, the total power dissipation in dynamic and static components during the active mode. In the standby mode, the power dissipation is due to the standby leakage current. Dynamic power dissipation consists of two components. One is the switching power due to charging and discharging of load capacitance. The other is short circuit power due to the nonzero rise and fall time of input waveforms. The static power of a CMOS circuit is determined by the leakage current through each transistor. The dynamic (switching) power (PD) and leakage power (PLEAK) are expressed as
PD = αfCVDD2 … … … 8 PLEAK = ILEAK. VDD …. … .… … .. …9
Where α is the switching activity; f is the operation frequency; C is the load capacitance. The substrate doping
Volume 2, Issue 5, May 2013
Page 8
Fig-3(a) Leakage current of Adder
Fig-3(b) Leakage current after improve on process level
6. Leakage Reductions at Circuit Level
At the circuit level we can reduced leakage by some technique they self reverse biasing, multiple threshold voltage, gated Vdd/Ground
a.
Self Reverse Biasing
The body effect in CMOS transistors, a smaller width of the depletion layer leads to lower VT. The reverse biasing of CMOS transistor increases VT while on forward biasing of the COMS transistor VT decreases. And also in CMOS threshold voltage increases with increased doping of the channel but decreases with applied bias. Therefore the current in the sub threshold region can be partially decreased by reverse biasing. Equation (10) quantifies the back-gate bias parameter as function of the oxide capacitance and substrate doping level.
.. . … … … . . . 10
Where is gate oxide thickness, is substrate doping level q is unity electron charge is gate oxide permittivity and is Silicon permittivity.
Volume 2, Issue 5, May 2013
Page 9
Fig 4(b) 10T Adder circuit with reverse bias
Fig5 (a) Leakage current without reverse bias
Fig 5(b) Leakage current with reverse bias
a.
Multiple channel doping
The threshold voltage equals the sum of the flat band voltage, twice the bulk potential and the voltage across the oxide due to the depletion layer charge.
Where the flat band voltage, VFB is given by
With
Volume 2, Issue 5, May 2013
Page 10
Fig-6 Threshold voltage of n-type (upper curve) and p-type (lower curve) MOSFETs versus substrate doping density
The threshold of both types of devices is slightly negative at low doping densities and differs by 4 times the absolute value of the bulk potential. The threshold of nMOSFETs increases with doping while the threshold of pMOSFETs decreases with doping in the same way.
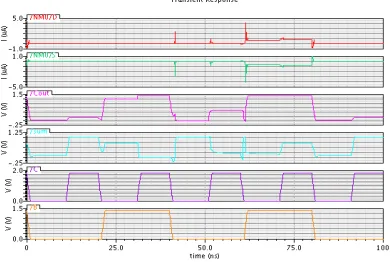
Fig7 Transient Response with multiple doping
7. Simulation and Result
We simulate various Adder cell on cadence tool in different-different technique and circuit parameter in 10T Adder and other and found that 10T Adder is the most prominent low power consumption cell. The leakage power is reduced by high level using various techniques. We have clear that VT is the most appropriate parameter for reducing leakage power and current. By increasing doping and decreasing TOX reduced power consumption. The Equation-11 show that the threshold voltage dependent on various parameters on Adder cell. Here we can see that the threshold can changed by Ø, γ and η. They are easily change by well engineering design.
……11
A variation of the flat band voltage due to oxide charge will cause a reduction of both threshold voltages if the charge is positive and an increase if the charge is negative.
8. References
[1.]Madhuri.Sada1, A.Srinivasulu2, C.Md.Aslam3 “1 Bit Full Adder Cell for Reducing Low Leakage Current in Nano Meter Technology” International Journal of Engineering Research and Development, Volume 2, Issue 4 (July 2012), PP. 11-18
[2.]Radu Zlatanovici, Sean Kao, Borivoje Nikolic, “Energy-Delay of Optimization 64-Bit Carry- Lookahead Adders With a 240ps 90nm CMOS Design Example,” IEEE J. Solid State circuits, vol.44, no. 2, pp. 569-583, Feb. 2009. [3.]Massimo Alioto and Gaetano Palumbo “Analysis and Comparison on Full Adder Block in Submicron Technology”
Volume 2, Issue 5, May 2013
Page 11
[4.]A. Shams and M. Bayoumi, “A novel high-performance CMOS 1-Bit full-adder cell” IEEE Trans. Circuits Syst.— Part II, vol. 47, pp 478–481, May 2000.
[5.]H. Mahmoud and M. Bayoumi, “A 10-transistor low-power high-speed full adder cell” in Proc. ISCAS’99, Orlando, FL, June 1999, pp. 43–46
[6.]K. Chu and D. Pulfrey, “A comparison of CMOS circuit techniques: Dif-ferential cascode voltage switch logic versus conventional logic” IEEE J. Solid-State Circuits , vol. SC-22, pp. 528–532, Aug. 1987